White Box Server Market

ID: MRFR/ICT/3933-HCR
100 Pages
Ankit Gupta
Last Updated: June 17, 2026
White Box Server Market Size, Share and Research Report By Server Type (Rack Mounted Server, GPU Server, Twin Server, Blade Server, Storage Server), By Processor Type (X86 Servers, Non-X86 Servers), By Organization Size (Large Enterprise, Small and Medium Enterprise), By End-User Vertical (IT & Telecommunications, Healthcare, BFSI, Government & Defense, Retail & E-Commerce) and By Regional (North America, Europe, South America, Asia Pacific, Middle East and Africa) - Industry Forecast to 2035.
Download PDF ×

We do not share your information with anyone. However, we may send you emails based on your report interest from time to time. You may contact us at any time to opt-out.

  1. 1 Market Overview |
    1. 1.1 Study Assumptions & Market Definition |
    2. 1.2 Scope of the Study |
    3. 1.3 Research Methodology
  2. 2 Market Summary & Key Takeaways
  3. 3 Market Dynamics |
    1. 3.1 Market Drivers Analysis | |
      1. 3.1.1 Hyperscale Cloud CapEx Expansion | |
      2. 3.1.2 AI / GPU-Dense Workload Proliferation | |
      3. 3.1.3 OCP Standardization & Ecosystem Growth | |
      4. 3.1.4 Total Cost of Ownership Advantage over OEM | |
      5. 3.1.5 Sovereign Cloud & Data Localization Mandates | |
      6. 3.1.6 Edge Computing & Distributed Inference Demand | |
      7. 3.1.7 Liquid-Cooling & High-Density Rack Innovation |
    2. 3.2 Market Restraints Analysis | |
      1. 3.2.1 Supply Chain Concentration in Taiwan | |
      2. 3.2.2 Limited After-Sales Support vs. OEM | |
      3. 3.2.3 Firmware & Security Certification Gaps | |
      4. 3.2.4 Tariff and Trade Policy Uncertainty | |
      5. 3.2.5 Component Allocation Conflicts during Shortage Cycles |
    3. 3.3 Market Opportunity Analysis | |
      1. 3.3.1 AI Inference at the Edge | |
      2. 3.3.2 As-a-Service and Managed White-Box Offerings | |
      3. 3.3.3 Emerging-Market Data-Center Build-Outs | |
      4. 3.3.4 Liquid-Cooling and High-Density Rack Integration | |
      5. 3.3.5 Data Monetization through Telemetry Platforms |
    4. 3.4 Industry Value Chain Analysis |
    5. 3.5 Porter's Five Forces Analysis
  4. 4 Global White Box Server Market Size & Forecast (2021–2035) |
    1. 4.1 Historical Market Size (2021–2025) |
    2. 4.2 Current & Forecast Market Size (2026–2035) |
    3. 4.3 Market Size by Revenue (USD Billion) |
    4. 4.4 Year-over-Year Growth Analysis
  5. 5 Segmentation Analysis |
    1. 5.1 By Server Type | |
      1. 5.1.1 Rack Mounted Server | |
      2. 5.1.2 GPU Server | |
      3. 5.1.3 Twin Server | |
      4. 5.1.4 Blade Server | |
      5. 5.1.5 Storage Server |
    2. 5.2 By Processor Type | |
      1. 5.2.1 X86 Servers | |
      2. 5.2.2 Non-X86 Servers |
    3. 5.3 By Organization Size | |
      1. 5.3.1 Large Enterprise | |
      2. 5.3.2 Small and Medium Enterprise |
    4. 5.4 By End-User Vertical | |
      1. 5.4.1 IT & Telecommunications | |
      2. 5.4.2 Healthcare | |
      3. 5.4.3 BFSI | |
      4. 5.4.4 Government & Defense | |
      5. 5.4.5 Retail & E-Commerce
  6. 6 Regional Analysis |
    1. 6.1 North America | |
      1. 6.1.1 United States | |
      2. 6.1.2 Canada | |
      3. 6.1.3 Mexico |
    2. 6.2 Europe | |
      1. 6.2.1 Germany | |
      2. 6.2.2 United Kingdom | |
      3. 6.2.3 France | |
      4. 6.2.4 Italy | |
      5. 6.2.5 Spain | |
      6. 6.2.6 Nordic Countries | |
      7. 6.2.7 Russia | |
      8. 6.2.8 Rest of Europe |
    3. 6.3 Asia-Pacific | |
      1. 6.3.1 China | |
      2. 6.3.2 India | |
      3. 6.3.3 Japan | |
      4. 6.3.4 South Korea | |
      5. 6.3.5 ASEAN | |
      6. 6.3.6 Rest of Asia-Pacific |
    4. 6.4 South America | |
      1. 6.4.1 Brazil | |
      2. 6.4.2 Argentina | |
      3. 6.4.3 Rest of South America |
    5. 6.5 Middle East & Africa | |
      1. 6.5.1 Saudi Arabia | |
      2. 6.5.2 UAE | |
      3. 6.5.3 South Africa | |
      4. 6.5.4 Egypt | |
      5. 6.5.5 Rest of MEA
  7. 7 Competitive Landscape |
    1. 7.1 Market Share Analysis (2025) |
    2. 7.2 Competitive Benchmarking Matrix |
    3. 7.3 Company Profiles | |
      1. 7.3.1 Quanta Computer | |
      2. 7.3.2 Wistron / Wiwynn | |
      3. 7.3.3 Inventec | |
      4. 7.3.4 MiTAC Holdings | |
      5. 7.3.5 Supermicro | |
      6. 7.3.6 Foxconn (Hon Hai Precision) | |
      7. 7.3.7 Compal Electronics | |
      8. 7.3.8 Pegatron | |
      9. 7.3.9 ZT Systems | |
      10. 7.3.10 Celestica
  8. 8 Future Outlook & Strategic Recommendations (2026–2035) |
    1. 8.1 AI Infrastructure Scaling and Autonomous Operations |
    2. 8.2 Platform Economics and ODM Vertical Integration |
    3. 8.3 Sustainability and Circular Hardware Models |
    4. 8.4 Chiplet Architectures and Heterogeneous Compute
  9. 9 Recent Developments & News
  10. 10 Frequently Asked Questions (FAQs)
  11. 11 Report Scope & Methodology |
    1. 11.1 Study Period & Base Year |
    2. 11.2 Data Sources & Citations |
    3. 11.3 Abbreviations
  12. 12 LIST OF TABLES |
  13. TABLE 1 Global White Box Server Market Size & Forecast, by Revenue (USD Billion), 2021–2035 |
  14. TABLE 2 Global White Box Server Market — Year-over-Year Growth Analysis, 2021–2035 |
  15. TABLE 3 Global White Box Server Market — Driver Impact Analysis, 2026–2035 |
  16. TABLE 4 Global White Box Server Market — Restraint Impact Analysis, 2026–2035 |
  17. TABLE 5 Global White Box Server Market Size, by Server Type, 2021–2035 (USD Billion) |
  18. TABLE 6 Global White Box Server Market Size, by Processor Type, 2021–2035 (USD Billion) |
  19. TABLE 7 Global White Box Server Market Size, by Organization Size, 2021–2035 (USD Billion) |
  20. TABLE 8 Global White Box Server Market Size, by End-User Vertical, 2021–2035 (USD Billion) |
  21. TABLE 9 Global White Box Server Market Size, by Region, 2021–2035 (USD Billion) |
  22. TABLE 10 North America White Box Server Market Size, by Country, 2021–2035 (USD Billion) |
  23. TABLE 11 Europe White Box Server Market Size, by Country, 2021–2035 (USD Billion) |
  24. TABLE 12 Asia-Pacific White Box Server Market Size, by Country, 2021–2035 (USD Billion) |
  25. TABLE 13 South America White Box Server Market Size, by Country, 2021–2035 (USD Billion) |
  26. TABLE 14 Middle East & Africa White Box Server Market Size, by Country, 2021–2035 (USD Billion) |
  27. TABLE 15 Competitive Benchmarking Matrix — Global White Box Server Market, 2025 |
  28. TABLE 16 Company Profiles — Key Players, Global White Box Server Market |
  29. TABLE 17 Recent Developments & Strategic Announcements, 2023–2025 |
  30. TABLE 18 North America White Box Server Market Size, by Server Type, 2021–2035 (USD Billion) |
  31. TABLE 19 North America White Box Server Market Size, by Processor Type, 2021–2035 (USD Billion) |
  32. TABLE 20 North America White Box Server Market Size, by Organization Size, 2021–2035 (USD Billion) |
  33. TABLE 21 North America White Box Server Market Size, by End-User Vertical, 2021–2035 (USD Billion) |
  34. TABLE 22 Europe White Box Server Market Size, by Server Type, 2021–2035 (USD Billion) |
  35. TABLE 23 Europe White Box Server Market Size, by Processor Type, 2021–2035 (USD Billion) |
  36. TABLE 24 Europe White Box Server Market Size, by Organization Size, 2021–2035 (USD Billion) |
  37. TABLE 25 Europe White Box Server Market Size, by End-User Vertical, 2021–2035 (USD Billion) |
  38. TABLE 26 Asia-Pacific White Box Server Market Size, by Server Type, 2021–2035 (USD Billion) |
  39. TABLE 27 Asia-Pacific White Box Server Market Size, by Processor Type, 2021–2035 (USD Billion) |
  40. TABLE 28 Asia-Pacific White Box Server Market Size, by Organization Size, 2021–2035 (USD Billion) |
  41. TABLE 29 Asia-Pacific White Box Server Market Size, by End-User Vertical, 2021–2035 (USD Billion) |
  42. TABLE 30 South America White Box Server Market Size, by Server Type, 2021–2035 (USD Billion) |
  43. TABLE 31 South America White Box Server Market Size, by Processor Type, 2021–2035 (USD Billion) |
  44. TABLE 32 South America White Box Server Market Size, by Organization Size, 2021–2035 (USD Billion) |
  45. TABLE 33 South America White Box Server Market Size, by End-User Vertical, 2021–2035 (USD Billion) |
  46. TABLE 34 Middle East & Africa White Box Server Market Size, by Server Type, 2021–2035 (USD Billion) |
  47. TABLE 35 Middle East & Africa White Box Server Market Size, by Processor Type, 2021–2035 (USD Billion) |
  48. TABLE 36 Middle East & Africa White Box Server Market Size, by Organization Size, 2021–2035 (USD Billion) |
  49. TABLE 37 Middle East & Africa White Box Server Market Size, by End-User Vertical, 2021–2035 (USD Billion) |
  50. TABLE 38 Report Scope & Methodology Summary |
  51. TABLE 39 Detailed Sources and Citations
  52. 13 LIST OF FIGURES |
  53. FIGURE 1 Global White Box Server Market Dynamics — Drivers, Restraints, Opportunities |
  54. FIGURE 2 Industry Value Chain Analysis — White Box Server Market |
  55. FIGURE 3 Porter's Five Forces Analysis — White Box Server Market |
  56. FIGURE 4 Global White Box Server Market Size Trend, 2021–2035 (USD Billion) |
  57. FIGURE 5 White Box Server Market Share, by Server Type, 2025 (%) |
  58. FIGURE 6 White Box Server Market Share, by Processor Type, 2025 (%) |
  59. FIGURE 7 White Box Server Market Share, by Organization Size, 2025 (%) |
  60. FIGURE 8 White Box Server Market Share, by End-User Vertical, 2025 (%) |
  61. FIGURE 9 White Box Server Market Share, by Region, 2025 (%) |
  62. FIGURE 10 North America White Box Server Market Size, by Country, 2025 (%) |
  63. FIGURE 11 Europe White Box Server Market Size, by Country, 2025 (%) |
  64. FIGURE 12 Asia-Pacific White Box Server Market Size, by Country, 2025 (%) |
  65. FIGURE 13 Competitive Landscape — White Box Server Market Revenue Share, 2025

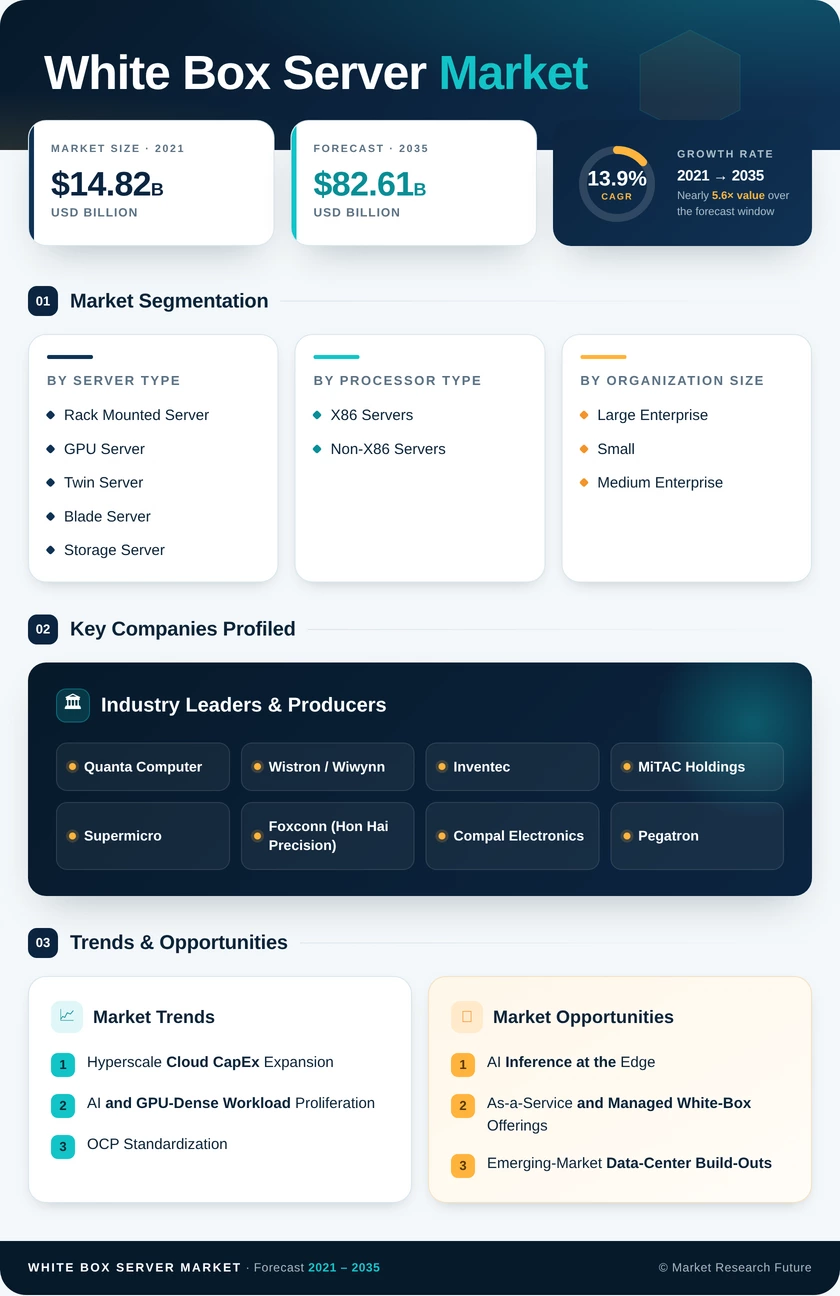
Segmentation Quick Reference

DimensionSub-SegmentsDominant SegmentFastest Growing Segment
Server TypeRack Mounted Server, GPU Server, Twin Server, Blade Server, Storage ServerRack Mounted ServerGPU Server
Processor TypeX86 Servers, Non-X86 ServersX86 ServersNon-X86 Servers
Organization SizeLarge Enterprise, Small and Medium EnterpriseLarge EnterpriseSmall and Medium Enterprise
End-User VerticalIT & Telecommunications, Healthcare, BFSI, Government & Defense, Retail & E-CommerceIT & TelecommunicationsHealthcare


Market Segmentation Overview

By Server Type

Sub-SegmentKey Trend
Rack Mounted ServerOCP Open Rack v3 adoption driving standardization across hyperscale fleets
GPU ServerGenerative-AI training and inference scaling GPU density per rack
Twin ServerHigh-density virtualization for cost-sensitive multi-tenant hosting
Blade ServerEnterprise private-cloud consolidation favoring modular blade chassis
Storage ServerObject-storage and big-data analytics fueling capacity expansion


Rack-mounted and GPU servers collectively account for the majority of new procurement. The rapid evolution of AI accelerator hardware is compressing design-to-deployment cycles and elevating GPU servers as the primary growth vector within the White Box Server Market.

By Processor Type

Sub-SegmentKey Trend
X86 ServersAMD EPYC market-share gains intensifying competition with Intel Xeon
Non-X86 ServersARM Neoverse and RISC-V silicon expanding cloud and inference adoption


The x86 duopoly of AMD and Intel continues to underpin the vast majority of deployments, but ARM-based processors are demonstrating competitive performance-per-watt metrics in cloud-native and inference workloads, opening a multi-architecture future for the White Box Server Market.

By Organization Size

Sub-SegmentKey Trend
Large EnterpriseDirect ODM contracting for custom rack designs at scale
Small and Medium EnterpriseManaged white-box services reducing entry barriers


Large enterprises remain the dominant buyer cohort, but managed-service offerings are making white-box infrastructure accessible to organizations without dedicated hardware-engineering teams.

By End-User Vertical

Sub-SegmentKey Trend
IT & TelecommunicationsCloud-region expansion and 5G core network deployments
HealthcareGPU-accelerated medical imaging and genomics processing
BFSILow-latency trading systems and regulatory compute requirements
Government & DefenseSovereign-cloud mandates and national AI compute programs
Retail & E-CommerceReal-time recommendation engines and logistics optimization


IT and telecommunications operators anchor demand, while healthcare is the fastest-growing vertical — deploying GPU-rich white-box nodes for radiology AI and drug-discovery simulation.