Wind Energy Market (2026 - 2035)

Wind Energy Market Research Report By Installation Type (Onshore Wind, Offshore Wind), By Component (Turbines (Blades, Nacelle, Drivetrain, Tower), Electrical Infrastructure (Cables, Substations, Transformers), Support Services (O&M, Monitoring, Logistics)), By Application (Utility-Scale, Industrial & Commercial, Residential & Small Wind) and By Regional (North America, Europe, South America, Asia Pacific, Middle East and Africa) - Industry Forecast to 2035
ID: MRFR/EnP/20124-HCR
128 Pages
Anshula Mandaokar
Last Updated: July 24, 2026
Wind Energy Market
Market Size
Forecast Period2026-2035
CAGR (2026-2035)8.2%
2025 Market SizeUSD 128.5 Billion
2035 Market SizeUSD 282.6 Billion
Key Players
Vestas Wind Systems
Goldwind
GE Vernova
Siemens Gamesa
Envision Energy
Mingyang Smart Energy
Opportunities
  • Floating Offshore Wind Commercialization
  • Green Hydrogen Integration
  • Repowering and Life Extension of Aging Fleets

Wind Energy Market Summary

The global Wind Energy Market reached an estimated USD 128.5 billion in 2025 and is projected to grow from USD 139.0 billion in 2026 to USD 282.6 billion by 2035, registering a CAGR of 8.2% during the forecast period (2026–2035). Two policy catalysts are driving this acceleration: the European Union's revised Renewable Energy Directive mandating a 42.5% renewable share by 2030 [1], and the U.S. Inflation Reduction Act's extension of production tax credits worth an estimated USD 270 billion in clean energy incentives over the coming decade [2]. These commitments have turned wind energy from an alternative into a baseline power planning assumption for grid operators worldwide.

The technology transformation underway in the Wind Energy Market centers on turbine scaling and digitalization. Turbines rated below 3 MW dominated installations a decade ago; today, 6–8 MW onshore platforms and 14–16 MW offshore machines are becoming standard. The International Energy Agency estimates that global wind power investment surpassed USD 210 billion in 2024, a figure that reflects both larger individual projects and the expanding geographic footprint of wind development [3].

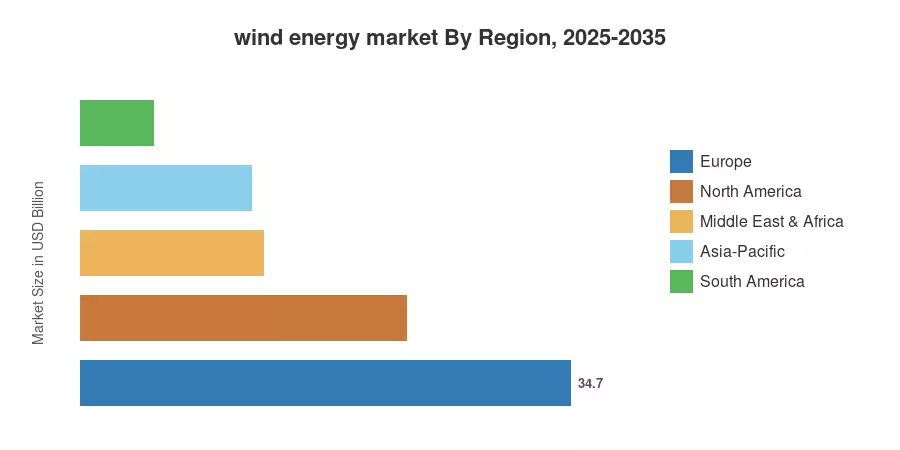
Asia-Pacific commands roughly 47% of the Wind Energy Market, driven primarily by China's dominance in both manufacturing and deployment. The region also registers the fastest forecast CAGR at 9.4%, fueled by aggressive capacity targets in India, Vietnam, and South Korea. Europe holds the second-largest share at approximately 27%, anchored by mature offshore programs in the North Sea. North America accounts for around 18%, with the U.S. federal permitting reforms expected to unlock significant pipeline acceleration through 2030.


Key Report Takeaways

• By Installation Type

  • Onshore installations account for approximately 82% of the Wind Energy Market by value, supported by lower capital intensity and faster permitting cycles across most geographies.
  • Offshore wind is the fastest-growing installation segment, posting an estimated CAGR of 12.8% during 2026–2035 as governments finalize seabed leasing programs and port infrastructure investments.

• By Component

  • Turbine systems (including blades, nacelles, towers, and generators) represent the largest component category, valued at approximately USD 78.4 billion in 2025.
  • Electrical infrastructure and balance-of-plant services are gaining share as grid-integration complexity rises.

• By Region

  • The Wind Energy Market in Asia-Pacific grows at the fastest regional pace (9.4% CAGR), with China and India collectively adding over 60 GW of new capacity annually.


  • North America's share of the Wind Energy Market is expanding as the U.S. accelerates permitting reform and Canada scales Atlantic offshore leasing.


Wind Energy Market Size and Forecast (2021–2035)

Market Research Future's sizing methodology integrates bottom-up capacity installation data, average capital expenditure per MW, and operations & maintenance revenue streams across the value chain. Historical figures draw on validated deployment statistics from IRENA and national grid authorities, while forecast projections apply capacity pipeline analysis, policy-driven demand modeling, and technology cost-curve assumptions.
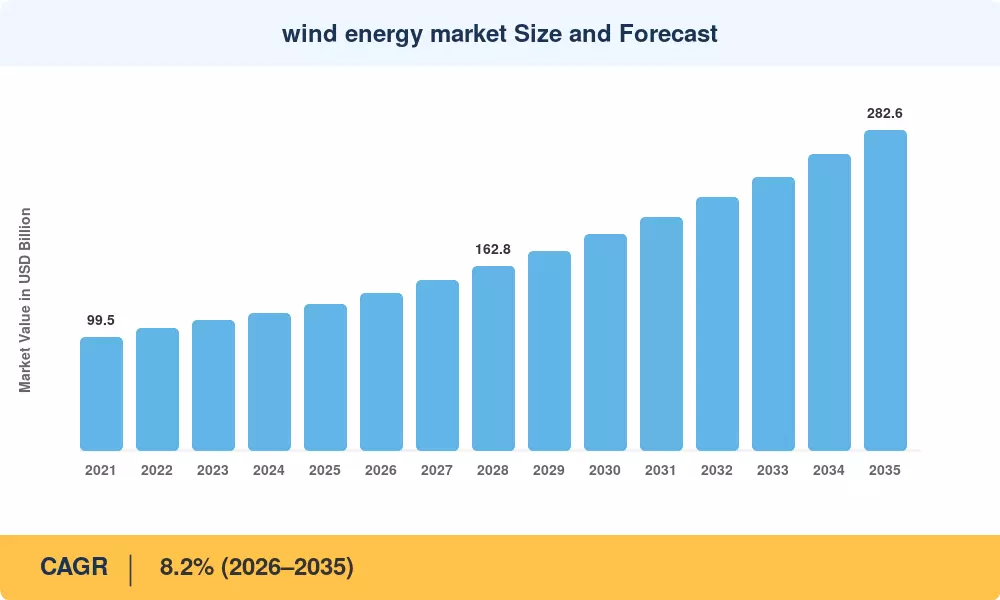
wind energy market Size and Forecast
Our Impact
Enabled $4.3B Revenue Impact for Fortune 500 and Leading Multinationals
Partnering with 2000+ Global Organizations Each Year
30K+ Citations by Top-Tier Firms in the Industry

Driver Impact Analysis

Driver ~% Impact on CAGR Geographic Relevance Impact Timeline
Government renewable mandates and carbon pricing ~22% Global Long-term (≥4 yr)
Turbine scaling and technology cost decline ~20% Global Medium-term (2–4 yr)
Offshore wind industrialization ~18% Europe, Asia-Pacific, N. America Medium-term (2–4 yr)
Grid modernization and storage pairing ~15% N. America, Europe Long-term (≥4 yr)
Corporate PPA demand and ESG commitments ~12% N. America, Europe Short-term (≤2 yr)
Emerging-market electrification programs ~8% Asia-Pacific, Africa, S. America Long-term (≥4 yr)
Green hydrogen integration ~5% Europe, Middle East Long-term (≥4 yr)


Government Renewable Mandates and Carbon Pricing

National climate legislation continues to be the single most potent growth engine for the Wind Energy Market. The EU’s Fit for 55 package has set binding targets of adding over 30 GW of wind capacity per year across the bloc to achieve 55% reductions in greenhouse gases for member states by 2030 [1]. In China, the 14th Five-Year Plan targets 1,200 GW combined capacity from solar and wind by 2030, with wind accounting for around 500 GW [4]. In the United States, the Inflation Reduction Act includes a technology-neutral tax credit for clean power, providing as much as USD 27.50 per MWh for qualifying projects through at least 2032, delivering a persistent investment signal well beyond a single election cycle [2].


Turbine Scaling and Technology Cost Decline

Average onshore turbine ratings have increased from 2.5 MW in 2015 to over 6 MW in 2025, with corresponding capacity factor improvements of 15–20 percentage points. Offshore turbines are following the same trajectory at a compressed pace: GE Vernova's Haliade-X platform and Vestas's V236-15.0 MW machine both demonstrate that nameplate ratings above 15 MW are commercially viable, which reduces the per-MW balance-of-plant cost and improves project-level economics [14].

Offshore Wind Industrialization

Offshore wind is moving from a European specialty to a worldwide industry. The U.S. Bureau of Ocean Energy Management has leased over 3.5 million acres of Outer Continental Shelf for offshore development with an aggregate pipeline of over 50 GW [9]. Taiwan, Japan, and South Korea have altogether over 80 GW of offshore commitments by 2035. Investment in port infrastructure is an important enabler: the UK has committed GBP 160 million to its Offshore Wind Manufacturing Investment Support scheme to upgrade harbours and fabrication yards [15].


Corporate PPA Demand and ESG Commitments

Since 2019, corporate demand for wind energy via power purchase agreements has grown at a compound annual pace of above 25%. By end-2024, Corporate PPAs accounted for more than 50 GW of committed renewable energy globally, according to BloombergNEF [11]. Tech companies including Microsoft, Amazon and Google have signed multi-GW wind offtake agreements that provide revenue predictability to bankability even in areas with less developed feed-in frameworks.


Restraints Impact Analysis

The restraint impacts below are directional estimates of downward pressure on market growth. They reflect partial headwinds rather than absolute CAGR reductions, as mitigation measures and policy adjustments offset portions of each constraint.

Restraint ~% Impact on CAGR Geographic Relevance Impact Timeline
Permitting and land-use conflicts ~−25% Europe, N. America Medium-term (2–4 yr)
Supply-chain bottlenecks and raw materials ~−20% Global Short-term (≤2 yr)
Grid congestion and curtailment ~−20% China, India, Germany Medium-term (2–4 yr)
Interest rate and financing cost pressure ~−18% Global Short-term (≤2 yr)
Community opposition and visual impact ~−17% Europe, N. America Long-term (≥4 yr)


Permitting and Land-Use Conflicts

Permitting timelines are the main non-financial hurdle for the Wind Energy Market. The EU aim is 2 years for average onshore wind permits in Europe; however, in some member states it takes 4–7 years [16]. Germany’s story serves as a warning. Although the country has set lofty 2030 targets, administrative backlogs, environmental effect concerns and military radar objections have stymied new onshore capacity approvals to only 1.8 GW in 2022. The EU Wind Power Action Plan included fast-track emergency permitting in 2023, but implementation at the national level is still patchy.


Supply-Chain Bottlenecks and Raw Materials

The wind turbine supply chain has been under sustained pressure. Chinese supply chains are heavily concentrated in rare earths, especially neodymium and dysprosium used in permanent-magnet generators, with more than 70% of global refined rare earths coming from a single country [5]. Europe’s monopile and jacket foundation fabrication capacity is booked 3-4 years out, creating a chokepoint for offshore project timetables. The lack of balsa wood is pushing blade manufacturers to use alternatives like PET foam, which adds cost and qualification delays.


Grid Congestion and Curtailment

Wind curtailment reached 6.5% in China and 5.2% in parts of northern Germany during 2024, representing billions of dollars in lost revenue [10]. Transmission infrastructure build-out consistently lags generation capacity additions. India's Green Energy Corridors program will require connecting its major wind-producing states to demand centers in the south and west [7].


Wind Energy Market Opportunities

Floating Offshore Wind Commercialization

Fixed-bottom offshore wind is constrained to water depths below approximately 60 meters, excluding over 80% of the world's offshore wind resource. Floating wind technology unlocks deep-water sites off the coasts of Japan, the U.S. West Coast, the Mediterranean, and the Korean Peninsula. France's 250 MW AO5 floating tender and the UK's ScotWind leasing round — which includes multiple floating wind sites totaling over 15 GW — signal the beginning of industrial-scale deployment [18]. Cost reductions will depend on serial production of floating platforms, which several developers expect to achieve by 2030.

Green Hydrogen Integration

Wind-to-hydrogen projects are emerging as a high-value growth vector for the Wind Energy Market. The European Commission's REPowerEU plan targets 10 million tonnes of domestic renewable hydrogen production by 2030, with dedicated offshore wind zones identified for electrolyzer co-location [13]. In the Middle East, Saudi Arabia's NEOM project plans 4 GW of dedicated wind and solar capacity for a single hydrogen facility. This opportunity transforms wind assets from electricity-only generators into multi-commodity platforms.

Repowering and Life Extension of Aging Fleets

Over 80 GW of installed onshore wind capacity in Europe and North America will reach the 20-year design life threshold before 2030 [19]. Repowering these sites with modern turbines can double or triple energy output per site without new land acquisition or transmission interconnection. Denmark and Germany have already seen repowered sites achieve 2.5x generation increases. This creates a recurring upgrade cycle that sustains demand even as greenfield sites become harder to permit.

Emerging-Market Electrification

Sub-Saharan Africa and Southeast Asia present large addressable markets for distributed and utility-scale wind. Africa's total installed wind capacity remains below 10 GW despite strong wind resources across the Sahel, the Horn of Africa, and the southern coast. Vietnam's Power Development Plan VIII targets 31 GW of onshore and offshore wind by 2030, creating one of the largest single-country pipelines in the developing world.

Digital Twin and Predictive Maintenance Platforms

Operators managing aging and expanding fleets are turning to AI-driven digital twins to reduce unplanned downtime and extend component life. Predictive analytics platforms can lower operations and maintenance costs by 20–30% according to DNV estimates [20]. These platforms also generate data assets that OEMs monetize through service contracts, creating a recurring revenue stream layered on top of equipment sales.


Wind Energy Market Future Outlook

AI-Driven Operations and Autonomous Wind Farms

Artificial intelligence and machine learning platforms are transforming wind asset management. By analyzing turbine sensor telemetry, real-time wind shear, and wake interaction patterns, AI-enabled predictive condition monitoring minimizes unplanned downtime, optimizes aerodynamic pitch and yaw alignments, and extends major component lifecycle durations across expanding utility-scale fleets.

Offshore Wind as Infrastructure Platform

The next decade will see offshore wind farms evolve from standalone power generators into multi-use marine infrastructure platforms. Energy islands — artificial hubs combining offshore wind interconnection, hydrogen electrolysis, and data-center cooling — are moving from concept to construction in Denmark and Belgium [15]. This platform model transforms the Wind Energy Market from a generation-only sector into an integrated energy, industrial, and digital ecosystem.

Electrification Supercycle and Wind's Role

Global electricity demand is projected to increase by 60% by 2040, driven by transport electrification, building heat pumps, and industrial decarbonization [8]. Wind energy is positioned to supply a substantial share of this incremental demand, with IRENA estimating that wind's share of global electricity generation must reach 35% by 2050 in a 1.5°C-aligned pathway [3]. The Wind Energy Market will grow not only because of climate policy but because electricity demand itself is expanding at a pace not seen since the post-WWII industrialization era.

ESG Reporting and Sustainable Finance Alignment

Mandatory climate disclosure regulations — including the EU Corporate Sustainability Reporting Directive and the U.S. SEC climate-risk rules — are embedding renewable energy procurement into corporate compliance frameworks. Financial institutions managing over USD 130 trillion in assets under the Glasgow Financial Alliance for Net Zero have committed to financing the energy transition [17]. The Wind Energy Market benefits directly, as wind projects satisfy Scope 2 and Scope 3 emission reduction requirements for reporting corporations.


Wind Energy Market Segmentation

By Installation Type

Segment Key Metric Primary Demand Driver
Onshore Wind ~82% market share (2025) Lower CAPEX; established permitting; broader geographic applicability
Offshore Wind 12.8% CAGR (2026–2035) Higher capacity factors; proximity to coastal demand centers; policy support


Onshore wind continues to dominate the Wind Energy Market by installed capacity and revenue, driven by faster development timelines and lower per-MW capital costs relative to offshore projects. China, the United States, and Brazil collectively account for over 70% of annual onshore additions. Turbine scaling to the 6–8 MW class has improved onshore economics significantly, narrowing the productivity gap with offshore installations.

Offshore wind is the fastest-growing segment within the Wind Energy Market, supported by dedicated government auction programs and seabed leasing frameworks. The segment's higher upfront costs are offset by capacity factors frequently exceeding 45–55%, compared to 30–40% for typical onshore sites. Offshore project pipelines in the U.S., UK, and Taiwan are expected to convert at accelerating rates through 2030 as port infrastructure and installation vessel capacity expand.

By Component

Segment Key Metric Primary Demand Driver
Turbines USD 78.4 B (2025) Nameplate capacity increases; materials innovation
Electrical Infrastructure 9.1% CAGR (2026–2035) Grid integration requirements; subsea cabling for offshore
Support Services (O&M) ~15% market share (2025) Fleet aging; performance optimization; digital platforms


Turbine systems represent the largest component category in the Wind Energy Market, encompassing blades, nacelles, drivetrains, towers, and foundations. Blade lengths exceeding 115 meters for offshore turbines have necessitated new manufacturing processes, including segmented blade designs that ease transport logistics. The transition toward direct-drive permanent-magnet generators in larger turbines is reducing gearbox-related maintenance costs but increasing exposure to rare earth supply risks.

Electrical infrastructure and support services are gaining value share as the installed base matures and grid-integration complexity rises. Subsea export cables for offshore wind now represent 15–20% of total project CAPEX, and specialized installation vessels command day rates exceeding USD 250,000 during peak construction seasons.

By Application

Segment Key Metric Primary Demand Driver
Utility-Scale ~91% market share (2025) Auction-driven capacity additions; grid-connected projects
Industrial & Commercial 10.3% CAGR (2026–2035) Behind-the-meter demand; corporate sustainability targets
Residential & Small Wind USD 1.2 B (2025) Rural electrification; microgrid integration


Utility-scale wind overwhelmingly dominates the Wind Energy Market, as competitive auction mechanisms and grid-scale project economics favor large installations. Projects above 100 MW in capacity benefit from volume procurement on turbines and shared balance-of-plant infrastructure. The industrial and commercial segment is the fastest-growing application, fueled by corporate PPA structures that allow manufacturers, data center operators, and mining companies to secure long-term renewable electricity at fixed prices.


Regional Market Share Analysis

Region Key Metric Primary Investment Themes
Asia-Pacific 9.4% CAGR (2026–2035) Massive onshore build-out; offshore industrialization in China, Taiwan, Japan
Europe ~27% market share (2025) Offshore scale-up; repowering aging onshore fleets; green hydrogen
North America USD 23.1 B (2025) IRA-driven investment; offshore leasing; transmission expansion
South America ~4.0% market share (2025) Brazil capacity auctions; Chile, Colombia early-stage development
Middle East & Africa 10.1% CAGR (2026–2035) Emerging pipelines in South Africa, Egypt, Saudi Arabia; green hydrogen
Total USD 128.5 B (2025)

The Wind Energy Market exhibits significant regional concentration, with Asia-Pacific and Europe together accounting for nearly three-quarters of global value. Regional growth trajectories diverge based on policy maturity, grid capacity, and offshore resource endowment.


Asia-Pacific

Country Key Metric Key Driver
China ~65% of regional share 14th Five-Year Plan wind targets; domestic manufacturing dominance
India 11.3% CAGR National Wind-Solar Hybrid Policy; Green Energy Corridors
Japan USD 4.2 B (2025) Offshore wind auction framework; energy security priorities
South Korea 10.8% CAGR 14.3 GW offshore target by 2030
Australia USD 1.8 B (2025) Renewable Energy Target; offshore wind legislation


China installed over 76 GW of onshore wind in 2023 alone, a single-year record that underscores the scale asymmetry between Asia-Pacific and other regions [4]. India's wind sector is entering a second growth phase after years of policy uncertainty, with central and state-level auctions driving capacity toward the 60 GW target by 2030 [7]. Japan's Round 1 offshore auctions attracted bids below JPY 12 per kWh, signaling competitive pricing that could accelerate the pipeline of 45 GW in identified offshore zones.

Europe

Country Key Metric Key Driver
Germany ~24% of regional share Onshore repowering wave; North Sea offshore expansion
United Kingdom 9.6% CAGR CfD auction rounds; 50 GW offshore target by 2030
France USD 4.1 B (2025) Floating offshore pilots; nuclear-wind balancing strategy
Spain ~10% of regional share PPA-driven merchant market growth
Denmark 8.9% CAGR Energy island projects; Bornholm hub


The Wind Energy Market in Europe is increasingly defined by offshore ambitions. The North Sea Summit declarations of 2023 and 2024 committed nine nations to 120 GW of combined North Sea offshore capacity by 2030, with 300 GW envisioned by 2050 [15]. Germany's revised Wind Energy Area Requirement Act designated 2% of national land area for onshore wind, a legislative step that could double the country's onshore pipeline within five years.

North America

Country Key Metric Key Driver
United States ~84% of regional share IRA tax credits; BOEM offshore leasing; state RPSs
Canada 9.2% CAGR Atlantic offshore exploration; provincial procurement
Mexico USD 1.1 B (2025) Oaxaca wind corridor; private-sector PPAs


The U.S. Wind Energy Market benefits from the most financially generous incentive structure in the country's history through the Inflation Reduction Act. Production tax credits at USD 27.50 per MWh (inflation-adjusted) and investment tax credits of up to 30–50% with domestic content and energy community bonuses have restructured project economics nationwide [2]. Canada's Nova Scotia and Newfoundland provinces are developing offshore regulatory frameworks that could support 5+ GW of Atlantic offshore wind by the early 2030s.

South America

Country Key Metric Key Driver
Brazil ~72% of regional share A-series energy auctions; northeastern wind corridor
Chile 10.5% CAGR Green hydrogen export strategy; copper mine electrification
Colombia USD 0.4 B (2025) La Guajira wind resource; energy transition roadmap


Brazil has emerged as the dominant Wind Energy Market in South America, with installed capacity exceeding 30 GW concentrated in the northeast states of Bahia, Rio Grande do Norte, and Piauí. Chile's National Green Hydrogen Strategy envisions dedicated wind capacity for electrolysis, leveraging the Atacama and Patagonia wind corridors that rank among the world's highest capacity factor sites [12].

Middle East & Africa

Country Key Metric Key Driver
South Africa ~38% of regional share REIPPPP auction rounds; Eskom capacity shortfalls
Egypt 11.6% CAGR Gulf of Suez wind corridor; EBRD financing
Saudi Arabia USD 0.6 B (2025) Vision 2030 diversification; NEOM hydrogen project
Kenya 10.9% CAGR Lake Turkana scale-up; geothermal-wind balancing


The Wind Energy Market in the Middle East & Africa region starts from a small base but posts the second-fastest regional growth trajectory. South Africa's Renewable Energy Independent Power Producer Procurement Programme has awarded over 6 GW of wind capacity across multiple bid windows, with Round 6 expected to add another 3.6 GW by 2028 [12]. Egypt's Gabal El-Zeit wind complex and the 1.1 GW Ras Ghareb corridor attract multilateral financing from the EBRD and the African Development Bank.


wind energy market By Region, 2025-2035

Competitive Benchmarking

The Wind Energy Market is moderately concentrated, with the top five turbine OEMs holding an estimated combined share of 55–60% of global annual installations. The Herfindahl-Hirschman Index for the turbine manufacturing segment sits in the 1,200–1,500 range, indicating moderate concentration with meaningful competition across regional sub-markets. Chinese OEMs have expanded their global footprint rapidly since 2020, intensifying competitive pressure on established Western players.

Company Est. Revenue Share Range Key Offerings for Wind Energy Market Strategic Positioning
Vestas Wind Systems ~14–17% Onshore and offshore turbines; service agreements; digital platforms Largest Western OEM by installed base; strong aftermarket presence
Goldwind ~12–15% Permanent-magnet direct-drive turbines; EPC services Leading Chinese OEM; expanding in South America and Southeast Asia
GE Vernova ~10–13% Haliade-X offshore platform; onshore 3–5 MW range; grid solutions Vertically integrated across generation and grid
Siemens Gamesa (SGRE) ~9–12% Offshore market leader (SG 14-236 DD); onshore portfolio Dominant offshore market share in Europe
Envision Energy ~7–9% Smart turbines; energy management software; green hydrogen Technology-focused; digital ecosystem strategy
Mingyang Smart Energy ~5–7% Offshore turbines up to 16 MW; floating wind platforms Fast-growing Chinese offshore player
Nordex Group ~4–6% Onshore Delta4000 platform; service contracts Mid-market European positioning
CSSC Haizhuang ~3–5% Large offshore turbines; state-backed development Chinese state-enterprise model; domestic focus
Suzlon Energy ~2–4% Onshore turbines; Indian market specialist Restructured balance sheet; re-entering growth phase
Enercon ~2–4% Direct-drive onshore turbines; German market focus Privately held; technology conservative


Recent News & Developments


  • GE Vernova (October 2023): Achieved first power generation at the 3.6 GW Dogger Bank Offshore Wind Farm in the UK following the successful installation and commissioning of its flagship Haliade-X 13MW/14MW offshore wind turbines.
  • European Commission (October 2023): Published the European Wind Power Action Plan, introducing accelerated permitting timelines, auction design reforms, and cybersecurity requirements for wind infrastructure. [1]
  • Goldwind (June 2023): Announced a 16 MW offshore prototype for deployment in the Fujian Strait, marking the company's entry into the ultra-large turbine segment previously dominated by Western OEMs. [21]
  • Envision Energy (July 2024): Established a strategic joint venture with Saudi Arabia's Public Investment Fund (PIF) and Vision Industries to localize wind turbine manufacturing, assembling nacelles, hubs, and blades for Middle Eastern projects.


Wind Energy Market Report Scope

Parameter Detail
Market Scope Global Wind Energy Market, encompassing onshore and offshore wind generation assets, turbine systems, electrical infrastructure, and support services
Study Period 2021–2035
CAGR (Forecast) 8.2% (2026–2035)
Market Size — Base Year (2025) USD 128.5 Billion
Market Size — Forecast End (2035) USD 282.6 Billion
Fastest Growing Segment Offshore Wind (12.8% CAGR)
Companies Profiled Vestas, Goldwind, GE Vernova, Siemens Gamesa, Envision Energy, Mingyang Smart Energy, Nordex, CSSC Haizhuang, Suzlon Energy, Enercon
Valuation Currency USD (constant 2025 dollars)


FAQs

How do wind energy projects typically secure financing in today's interest rate environment?
Most utility-scale projects blend tax equity (capturing IRA credits), project-finance debt from infrastructure funds, and sponsor equity. Higher base rates have increased all-in capital costs by 100–150 basis points since 2022, making contract structures like PPAs and CfDs essential for bankability [17].
What distinguishes direct-drive turbines from geared turbines in terms of lifecycle cost?
Direct-drive machines eliminate the gearbox, reducing maintenance frequency and unplanned downtime. They carry higher upfront costs due to permanent-magnet generators but typically deliver 10–15% lower lifecycle O&M expense over a 25-year operating period [20].
How does wind curtailment affect project returns and what mitigation strategies exist?
Curtailment reduces annual energy production by 3–7% in congested grids, directly cutting revenue. Co-located battery storage, grid reinforcement agreements, and dynamic line rating systems are the primary mitigation tools deployed by developers [10].
What role does local content regulation play in shaping the Wind Energy Market's supply chain Region?
Countries including the U.S., India, and Brazil impose domestic manufacturing or assembly requirements as conditions for incentive eligibility. These rules are reshaping blade, nacelle, and tower production regions toward demand markets [2].
How do offshore wind auction designs differ across major markets?
The UK uses Contracts for Difference with strike prices, while the U.S. relies on lease-bonus bidding followed by state-level offtake procurement. European CfD models provide revenue certainty; U.S. lease models shift more merchant risk onto developers [9].
What insurance and risk-transfer mechanisms are available for wind energy assets?
Offshore wind developments carry higher insurance costs due to harsh marine environments, subsea cabling risks, and severe weather exposure. Developers rely on construction all-risk, parametric coverages, and business interruption policies, though premiums fluctuate based on regional climate risks and supply chain replacement costs.
How are hybrid wind-plus-storage projects changing the value proposition of wind assets?
Adding 2–4 hours of battery storage to wind projects increases dispatchability, reduces curtailment losses, and qualifies projects for capacity payments. Hybrid configurations can improve project IRR by 1–3 percentage points depending on market structure [10].    
Author
Author
Author Profile
Anshula Mandaokar LinkedIn
Team Lead - Research
Anshula Mandaokar holds an academic degree in Chemical Engineering and has been contributing to the field for more than 5 years. She has expertise in Market Research and Business Consulting and serves as a Team Lead for a reputed Market Research firm under the Chemicals and Materials domain spectrum. She has worked on multiple projects, generating explicit results in a quick turnaround time. Her understanding of data interpretation justifies her role as a leader.

Research Approach


Secondary Research

The secondary research process involved comprehensive analysis of energy regulatory databases, peer-reviewed engineering journals, industry publications, and authoritative energy organizations. Key sources included the International Energy Agency (IEA), Global Wind Energy Council (GWEC), International Renewable Energy Agency (IRENA), US Department of Energy (DOE)/National Renewable Energy Laboratory (NREL), European Commission DG Energy, WindEurope, American Clean Power Association (ACP), Energy Information Administration (EIA), International Electrotechnical Commission (IEC), DNV GL Energy, BloombergNEF, International Atomic Energy Agency (IAEA) Power Reactor Information System, World Bank Energy Data, UN Environment Programme (UNEP), and national energy ministry reports from key markets including China's National Energy Administration (NEA), India's Ministry of New and Renewable Energy (MNRE), Germany's Bundesministerium für Wirtschaft und Klimaschutz (BMWK), and the UK Department for Energy Security and Net Zero (DESNZ).

Installation capacity statistics, turbine deployment data, grid integration studies, LCOE (Levelized Cost of Energy) trends, regulatory policy frameworks, carbon offset metrics, and technology landscape analysis for offshore wind platforms, horizontal and vertical axis wind turbines, turbine components (rotor blades, gearboxes, generators, nacelles), and hybrid renewable systems were gathered from these sources.


Primary Research

In order to gather both qualitative and quantitative insights, supply-side and demand-side stakeholders were interviewed during the primary research process. CEOs, CTOs, heads of offshore wind development, chief sustainability officers, and heads of procurement from wind turbine OEMs, wind farm developers, independent power producers (IPPs), and utility-scale engineering, procurement, and construction (EPC) contractors were examples of supply-side sources. Chief Investment Officers from utility companies, grid operators, corporate buyers of renewable energy, asset managers of wind farms, and policy directors from energy regulatory organizations were examples of demand-side sources. In addition to confirming offshore project pipeline timelines and validating market segmentation across turbine types and applications, primary research also gathered information on grid interconnection challenges, power purchase agreement (PPA) pricing dynamics, turbine technology adoption patterns, and regulatory compliance requirements.

Primary Respondent Breakdown:

By Designation: C-level Executives (40%), Director Level (32%), Others (28%)

By Region: North America (32%), Europe (30%), Asia-Pacific (28%), Rest of World (10%)


Market Size Estimation

Revenue mapping throughout the value chain and capacity deployment analysis were used to get the global market valuation. The methodology comprised:

Finding more than fifty major manufacturers in North America, Europe, Asia-Pacific, Latin America, the Middle East, and Africa, including turbine OEMs, suppliers of components (such as manufacturers of blades, gearboxes, and generators), and providers of offshore wind foundation and installation services

Product mapping for Offshore Wind Turbines, Onshore Wind Turbines, Horizontal Axis Wind Turbines (HAWT), Vertical Axis Wind Turbines (VAWT), and component categories such as Rotor Blades, Gearbox, Generator, Control Systems, nacelle, and Tower

Analysis of reported and projected yearly income for wind energy portfolios, including contracts for operations and maintenance (O&M), offshore logistics, turbine sales, and installation services

Coverage of producers accounting for 75–80% of the world market in 2024

Extrapolation of segment-specific valuations across Power Generation, Mechanical Power, and Hybrid Systems applications, as well as Utility, Commercial, Industrial, and Residential end-use segments, using top-down (manufacturer revenue validation) and bottom-up (installed capacity × LCOE/ASP by country/region) methods

Download Free Sample

Kindly complete the form below to receive a free sample of this Report

Download PDF ×

We do not share your information with anyone. However, we may send you emails based on your report interest from time to time. You may contact us at any time to opt-out.
















