Wind Turbine Rotor Blade Market (2026 - 2035)

Wind Turbine Rotor Blade Market Size, Share & Growth Analysis Report By Material Type (Glass Fiber Composite (GFRP), Carbon Fiber Composite (CFRP), Hybrid (Glass-Carbon)), By Application (Onshore, Offshore), By Blade Length (Below 50 m, 50–100 m, Above 100 m) and By Regional (North America, Europe, South America, Asia Pacific, Middle East and Africa) – Industry Growth & Forecast to 2035
ID: MRFR/EnP/27725-HCR
100 Pages
Chitranshi Jaiswal
Last Updated: July 01, 2026
Wind Turbine Rotor Blade Market
Market Size
Forecast Period2026-2035
CAGR (2026-2035)7.4%
2035 Market SizeUSD 61.6 Billion
Key Players
LM Wind Power
TPI Composites
Vestas
Siemens Gamesa
Sinoma Wind Power
Zhongfu Lianzhong
Opportunities
  • Floating Offshore Wind Commercialization
  • Thermoplastic and Recyclable Blade Architectures
  • Emerging-Market Onshore Wind Expansion

Wind Turbine Rotor Blade Market Summary

The global Wind Turbine Rotor Blade Market reached an estimated USD 30.2 billion in 2025 and is projected to grow from USD 32.4 billion in 2026 to USD 61.6 billion by 2035, registering a CAGR of 7.4% during the forecast period (2026–2035). This trajectory is anchored by aggressive national renewable energy targets — the European Union's binding commitment to 42.5% renewable energy by 2030 and China's pledge to install 1,200 GW of combined wind and solar capacity by the same year are funneling tens of billions into turbine procurement pipelines [1][2].

A generational shift in blade engineering is reshaping the supply chain. Turbines rated below 3 MW dominated onshore installations a decade ago; today, 6–8 MW platforms are standard onshore, and offshore machines exceeding 15 MW demand blades stretching beyond 115 meters. This scale-up is driving capital-intensive investments in new manufacturing tooling, automated layup systems, and thermoplastic resin research. Siemens Gamesa's RecyclableBlade program and LM Wind Power's commitment to zero-waste blade production by 2030 reflect an industry recalibrating around circular-economy principles [3][4].

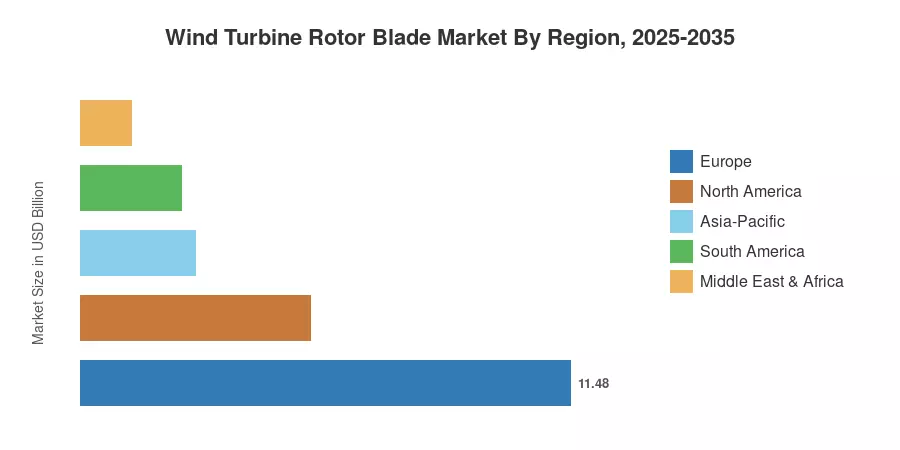
Europe commands the largest share of the Wind Turbine Rotor Blade Market at approximately 38%, buoyed by the North Sea offshore build-out and EU Innovation Fund disbursements. Asia-Pacific is the fastest-growing region with a projected CAGR of 8.9%, propelled by Chinese domestic manufacturing capacity and India's 500 GW non-fossil target for 2030. North America holds roughly 18% of global revenue, with the U.S. Inflation Reduction Act's production tax credits sustaining demand through the early 2030s [5][6]. The decade ahead will test whether blade supply chains can keep pace with turbine OEM order books that already extend three to four years out.


Key Report Takeaways

• By Material Type

  • Glass fiber composites account for an estimated 62% of the Wind Turbine Rotor Blade Market by value, reflecting their cost-effectiveness for onshore applications under 80 meters.
  • Carbon fiber composite blades are expanding at an estimated CAGR of 9.8%, driven by demand for stiffer, lighter structures in offshore turbines exceeding 12 MW.
  • Hybrid fiber blades using selective carbon spar caps generated approximately USD 3.6 billion in 2025, balancing performance with material cost.

• By Application

  • Onshore wind blades represent roughly 58% share of the Wind Turbine Rotor Blade Market, though growth is moderating as land-constrained markets saturate.
  • Offshore wind blade demand is forecast to grow at a CAGR of 10.2%, supported by floating wind demonstration projects scaling toward commercial arrays.

• By Region

  • Europe generated approximately USD 11.5 billion in blade revenue in 2025, maintaining the dominant regional position.
  • Asia-Pacific is projected at a CAGR of 8.9% through 2035, the fastest among all regions.
  • North America contributed roughly USD 5.4 billion in 2025, with production tax credits underpinning domestic blade manufacturing expansion.


Market Size and Forecast (2021–2035)

Market sizing draws on a triangulated methodology combining turbine OEM shipment data, blade-per-turbine ratios by rated capacity, and average selling prices per meter of blade length. Historical figures (2021–2024) reflect confirmed installations reported by GWEC and national grid operators, while the 2025 base-year estimate incorporates Q1–Q3 actuals and Q4 order-book projections. Forecast values apply a 7.4% compound annual growth rate informed by announced pipeline capacity, policy visibility, and manufacturing expansion timelines.
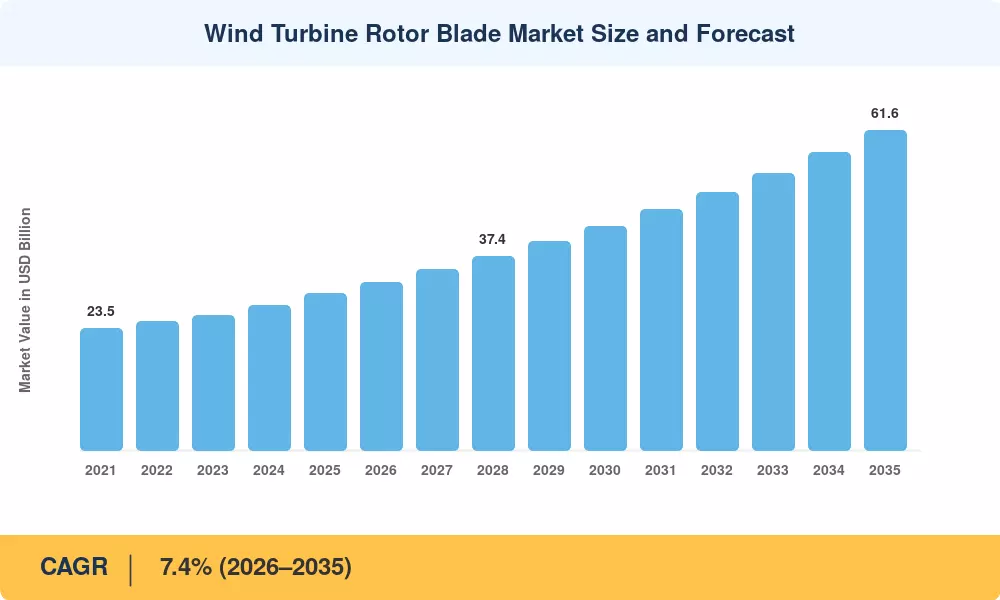
Wind Turbine Rotor Blade Market Size and Forecast
Our Impact
Enabled $4.3B Revenue Impact for Fortune 500 and Leading Multinationals
Partnering with 2000+ Global Organizations Each Year
30K+ Citations by Top-Tier Firms in the Industry

Driver Impact Analysis

Driver ~% Impact on CAGR Geographic Relevance Impact Timeline
Government renewable energy mandates +1.8% Global Long-term (≥4 yr)
Offshore wind capacity pipeline expansion +1.5% Europe, Asia-Pacific Medium-term (2–4 yr)
Turbine upsizing beyond 15 MW rated capacity +1.2% Europe, North America Medium-term (2–4 yr)
Inflation Reduction Act production tax credits +0.8% North America Short-term (≤2 yr)
Grid decarbonization and coal-phase-out policies +0.7% Asia-Pacific, Europe Long-term (≥4 yr)
Repowering aging onshore wind fleets +0.6% Europe, North America Medium-term (2–4 yr)
Emerging-market electrification demand +0.5% South America, MEA Long-term (≥4 yr)


Government Renewable Energy Mandates

National policy targets remain the single most consequential demand driver for the Wind Turbine Rotor Blade Market. The EU's REPowerEU plan earmarked €210 billion for accelerated renewable deployment, with offshore wind singled out for a target of 111 GW by 2030 — roughly triple the installed base at end-2023 [1]. China's 14th Five-Year Plan channels an estimated USD 750 billion into clean energy infrastructure, and provincial governments have begun mandating local-content requirements for blade manufacturing that are expanding domestic production capacity by 25–30 GW-equivalent per year [2]. These mandates convert political ambition into binding procurement schedules that blade manufacturers can finance against.

Offshore Wind Capacity Pipeline Expansion

The global offshore wind pipeline stood at approximately 340 GW of consented or pre-consented capacity at end-2024, according to GWEC data [8]. Each offshore turbine in the 12–15 MW class requires three blades of 107–115 meters, making blade production the critical path item for project timelines. The North Sea alone has lease awards covering over 90 GW through 2035, and the U.S. Bureau of Ocean Energy Management approved seven commercial lease areas between 2022 and 2024 [10]. This pipeline visibility gives blade OEMs the order-book certainty needed to justify new factory investments, such as LM Wind Power's 120-meter-capable facility in Cherbourg, France [3].

Turbine Upsizing Beyond 15 MW

The economics of offshore wind improve with larger rotors because swept area — and therefore energy capture — scales with the square of blade length. Vestas unveiled its V236-15.0 MW platform with 115.5-meter blades in 2022, and CSSC Haizhuang tested a 16 MW prototype with 123-meter blades in 2023 [15]. Moving from 10 MW to 15 MW reduces the number of foundations per project by roughly one-third, saving USD 400,000–600,000 per avoided monopile at current steel prices [9]. This upsizing trend directly increases blade revenue per turbine and pushes average selling prices higher across the Wind Turbine Rotor Blade Market.

4.4 U.S. Inflation Reduction Act Production Tax Credits

Section 45X of the IRA provides a production tax credit of USD 0.02 per watt-equivalent for domestically manufactured blade components, a subsidy valued at roughly USD 200,000–300,000 per blade set for a 5 MW onshore turbine [5]. TPI Composites expanded its Newton, Iowa, facility in response, and Siemens Gamesa committed to a blade finishing plant in Virginia. These credits de-risk capital expenditure for blade manufacturers and have already triggered approximately USD 2.8 billion in announced domestic blade facility investments since August 2022 [16].


Restraints Impact Analysis

The restraint impacts below are directional estimates of headwinds that moderate growth. They are not directly subtractive from the headline CAGR and should be read as qualitative magnitudes.

Restraint ~% Impact on CAGR Geographic Relevance Impact Timeline
Raw material cost volatility (epoxy resins, carbon fiber) –0.9% Global Short-term (≤2 yr)
Blade transportation and logistics constraints –0.6% North America, Europe Medium-term (2–4 yr)
Permitting and grid interconnection delays –0.5% Europe, North America Medium-term (2–4 yr)
End-of-life blade disposal and regulatory uncertainty –0.4% Europe Long-term (≥4 yr)
Skilled labor shortages in composite manufacturing –0.3% Global Long-term (≥4 yr)


Raw Material Cost Volatility

Epoxy resin prices surged approximately 40% between Q1 2021 and Q3 2022, driven by bisphenol-A supply constraints and elevated energy costs in European petrochemical clusters [7]. Carbon fiber prices remained elevated at USD 22–26 per kilogram through 2024, well above pre-pandemic norms of USD 16–18 per kilogram. For a 115-meter offshore blade consuming roughly 30 metric tons of composite materials, a 15% resin price swing translates to USD 150,000–200,000 in variable cost per blade. This volatility compresses blade manufacturer margins, which already operate in the low-to-mid single digits, and periodically delays final investment decisions on new wind projects when turbine OEMs pass cost increases through to developers.

Blade Transportation and Logistics Constraints

Blades exceeding 70 meters face acute overland transport challenges — specialized trailers, route engineering, bridge clearance surveys, and police escort requirements add USD 50,000–150,000 per blade move in markets like the central United States and interior Germany [17]. Rail gauge limitations restrict blade transport in India, and port draft depths constrain load-out options for 115-meter offshore blades. These logistics costs are driving interest in segmented blade designs, but segmented architectures introduce structural complexity and have yet to achieve wide commercial adoption. The net effect is a geographic cap on blade length growth in landlocked regions, slowing adoption of the largest turbine platforms in the Wind Turbine Rotor Blade Market.

End-of-Life Disposal Uncertainty

An estimated 14,000 blades per year will reach end-of-life in Europe alone by 2030, generating roughly 50,000 metric tons of thermoset composite waste annually [18]. Landfill bans on composite materials took effect in Germany, the Netherlands, Austria, and Finland between 2020 and 2025, yet commercial recycling capacity remains limited. Cement kiln co-processing can handle volumes at scale but recovers only thermal energy and calcium-rich ash. True fiber recovery through pyrolysis or solvolysis remains pre-commercial, with pilot plants processing fewer than 5,000 tons annually as of 2024. Regulatory ambiguity around extended producer responsibility obligations creates contingent liabilities that blade manufacturers must increasingly price into their contracts.


Wind Turbine Rotor Blade Market Opportunities

Floating Offshore Wind Commercialization

Floating wind unlocks massive deepwater acreage – An estimated 80% of worldwide offshore wind resource lies in waters deeper than 60 meters, out of reach of fixed-bottom foundations [11]. France, South Korea, Norway and Japan have jointly issued tenders for more than 15 GW of floating wind power through to 2035. Floating-platform blade designs have to accommodate larger dynamic loads due to platform motion, creating a need for premium composite architectures and load-monitoring systems. Early movers in the Wind Turbine Rotor Blade Market that qualify blades for floating-specific load envelopes would grab margin premiums on what IRENA forecasts may be a USD 15 billion annual blade sub-segment by the early 2030s.


Thermoplastic and Recyclable Blade Architectures

The move from thermoset to thermoplastic resins is a need for sustainability and an opportunity for production productivity. Thermoplastic blades can be fusion-bonded instead of adhesive-joined, which can reduce cycle times by an estimated 20-30% and allow end-of-life disassembly for material recovery [4]. Siemens Gamesa’s RecyclableBlade is commercially deployed in 2023, and Arkema’s Elium resin is qualified by several blade OEMs. The thermoplastic production scale will allow blade makers to differentiate themselves on ESG credentials and reduce warranty liability from adhesive bond-line failures.


Emerging-Market Onshore Wind Expansion

In 2023 alone, Brazil built 4.8 GW of onshore wind capacity, while the wind pipeline in sub-Saharan Africa reached 18 GW of pre-development projects [14]. These markets are best served by cost-optimized blades in the 60 to 80 meter range – a sector where glass fiber composites still dominate, and the production tooling is easily translatable from maturing Chinese and Indian manufacturing lines. Localized blade finishing factories can serve multiple country markets with capex as low as USD 30–50 million, satisfying local-content criteria that are increasing across Latin America and Africa.


Digital Twin and Predictive Maintenance Services

Embedded fiber-optic strain sensors and accelerometers in blade layups provide real-time structural health monitoring throughout 25-year operational lifetimes. Machine-learning models are developed using data from instrumented fleets of blades – over 30,000 units globally – to forecast fatigue damage 12-18 months before visual assessment [20]. This forms a service layer of recurring revenue next to blade hardware, with annual monitoring contracts of USD 5,000-15,000 per turbine. In the Wind Turbine Rotor Blade Market, digital services are a way of improving margins on more than one-time blade sales.


Onshore Repowering Cycle

First-generation wind farms installed between 2000 and 2010 — representing roughly 180 GW of cumulative capacity in Europe and North America — are approaching or exceeding their 20-year design lives [13]. Repowering these sites with modern, longer blades on taller towers can double energy yield per site without new land permitting. Germany's repowering pipeline alone is estimated at 15 GW through 2030, creating blade replacement demand worth an estimated USD 4–5 billion in the Wind Turbine Rotor Blade Market. This cycle effectively doubles the addressable demand from mature wind markets.


Wind Turbine Rotor Blade Market Future Outlook

Blade Digitalization and Autonomous Inspection

Drone-based blade inspection using AI-powered image recognition is replacing manual rope-access surveys, cutting inspection time from three days to under four hours per turbine. By 2030, an estimated 60% of operational wind fleets will employ digital twins integrating SCADA data, LiDAR-measured inflow conditions, and embedded strain sensor feeds to optimize individual blade pitch angles in real time [20]. This digitalization layer extends blade fatigue life by 10–15%, deferring replacement capex and reshaping aftermarket economics across the Wind Turbine Rotor Blade Market.

Circular Economy and Extended Producer Responsibility

The EU's forthcoming Ecodesign for Sustainable Products Regulation is expected to mandate recyclability passports for wind turbine blades by 2028, requiring full material traceability from resin batch to decommissioned blade segment [18]. WindEurope's industry pledge targets 100% recyclable blades by 2030. This regulatory trajectory will channel R&D investment toward thermoplastic resins, mechanical recycling of glass fiber, and chemical depolymerization of epoxy matrices — collectively reshaping blade material selection for the Wind Turbine Rotor Blade Market over the coming decade.

Supply-Chain Regionalization and Nearshoring

Geopolitical tensions and pandemic-era disruptions have accelerated blade supply-chain regionalization. The EU Critical Raw Materials Act and the U.S. IRA both incentivize domestic manufacturing, and India's Production Linked Incentive scheme includes advanced composite components [5][6]. By 2030, Market Research Future expects three distinct regional blade manufacturing ecosystems — Europe, China-centric Asia, and North America — each serving primarily local or near-shore demand, with limited cross-regional trade in finished blades exceeding 80 meters due to transport constraints [17].

Next-Generation Turbine Architectures

Turbine OEMs are pursuing 20 MW+ offshore platforms with rotor diameters exceeding 280 meters, requiring individual blades of 135–140 meters. These blades will likely demand carbon-glass hybrid spar structures, segmented tip assemblies, and active load-alleviation systems. IRENA's 2024 innovation outlook projected that 20 MW turbines could reduce offshore LCOE by an additional 15–20% relative to current 15 MW platforms [11]. The Wind Turbine Rotor Blade Market stands to benefit disproportionately from this trend, as blade cost as a percentage of total turbine cost rises from approximately 22% for a 5 MW onshore unit to 28–30% for a 15 MW+ offshore machine.


Wind Turbine Rotor Blade Market Segmentation

By Material Type

Segment Key Metric Primary Demand Driver
Glass Fiber Composite (GFRP) ~62% market share (2025) Cost leadership for onshore blades <80 m
Carbon Fiber Composite (CFRP) CAGR ~9.8% Stiffness-to-weight ratio for offshore blades >100 m
Hybrid (Glass-Carbon) ~USD 3.6 B (2025) Selective carbon spar caps balancing cost and performance


The Wind Turbine Rotor Blade Market remains dominated by glass fiber composites, which benefit from mature supply chains and price points roughly one-fifth those of aerospace-grade carbon fiber on a per-kilogram basis. GFRP blades serve the high-volume onshore segment, where blade lengths of 55–80 meters keep structural loads within glass fiber's modulus limitations. Vestas, Nordex, and Enercon source the bulk of their onshore blade glass from suppliers like Owens Corning and Jushi Group.

Carbon fiber adoption accelerates as blade length pushes beyond 100 meters for offshore platforms. At these scales, the weight penalty of all-glass construction becomes prohibitive — a 115-meter all-GFRP blade would weigh roughly 70 metric tons versus 55 metric tons with carbon spar caps, imposing unsustainable fatigue loads on the hub and main bearing [3]. Hybrid architectures that embed carbon fiber only in the spar cap — the primary load-bearing structure — capture most of the weight benefit at roughly 40% of the cost of a full-carbon blade.

By Application

Segment Key Metric Primary Demand Driver
Onshore ~58% market share (2025) Global repowering cycle; emerging-market greenfield installs
Offshore CAGR ~10.2% EU, UK, and Asia-Pacific pipeline; floating wind scale-up


Onshore wind remains the volume backbone of the Wind Turbine Rotor Blade Market, with cumulative global installed capacity exceeding 900 GW by end-2025. Growth in this segment increasingly comes from repowering aging sites with larger rotors, rather than purely greenfield development in mature markets. Blade lengths for modern onshore turbines have settled in the 70–85 meter range for 5–7 MW platforms.

Offshore wind is the primary growth vector. The segment's blade revenue is projected to surpass onshore in absolute terms by the early 2030s, driven by the sheer material intensity of 100 m+ blades and premium pricing that reflects higher certification and quality-assurance requirements. A single set of three 115-meter blades for a 15 MW offshore turbine carries a price tag of approximately USD 1.5–2.0 million, compared to USD 400,000–600,000 for a 75-meter onshore blade set [9].

By Blade Length

Segment Key Metric Primary Demand Driver
Below 50 m ~12% market share (2025) Small-wind and legacy sub-2 MW replacements
50–100 m ~USD 16.8 B (2025) Mainstream onshore 4–7 MW platforms
Above 100 m CAGR ~12.1% Offshore 12–15 MW+ turbines


The above-100-meter segment is the fastest-growing portion of the Wind Turbine Rotor Blade Market, albeit from a smaller base. Blades of this scale require specialized mold tooling costing USD 8–12 million per mold, automated fiber placement systems, and dedicated logistics infrastructure for transport and installation. The investment barrier favors incumbent blade OEMs with the balance-sheet capacity to finance multi-year tooling amortization.


Regional Market Share Analysis

Region Key Metric Primary Investment Themes
Europe ~38% market share (2025) Offshore mega-projects; repowering; recyclable blade mandates
Asia-Pacific CAGR ~8.9% (2026–2035) Domestic manufacturing scale; India offshore tenders; China exports
North America ~USD 5.4 B (2025) IRA production credits; Atlantic offshore pipeline; onshore repowering
South America CAGR ~7.8% (2026–2035) Brazil onshore auctions; local-content incentives
Middle East & Africa ~USD 1.2 B (2025) Saudi NEOM wind; South Africa REIPPPP Round 7
Total USD 30.2 B (2025)

The Wind Turbine Rotor Blade Market exhibits a tri-polar concentration across Europe, Asia-Pacific, and North America, with emerging contributions from South America and the Middle East & Africa.


Europe

Country Key Metric Key Driver
Germany ~28% of regional share Repowering pipeline; EEG 2023 auction volumes
United Kingdom CAGR ~9.1% CfD Round 6; Dogger Bank, Hornsea clusters
Denmark ~USD 1.3 B (2025) Vestas/LM Wind Power home-base effect
France CAGR ~8.5% South Brittany and Mediterranean offshore tenders
Rest of Europe ~19% of regional share Netherlands, Spain, Poland emerging offshore


The European Wind Turbine Rotor Blade Market benefits from a vertically integrated supply ecosystem. LM Wind Power operates major facilities in Denmark, Spain, and Poland, while Siemens Gamesa maintains blade plants in Denmark and the UK. The EU Innovation Fund allocated €1.8 billion to clean energy manufacturing grants in its 2023–2024 cycle, with blade recycling and thermoplastic resin scale-up among designated priority areas [1]. The UK's Contracts for Difference Round 6 cleared a record 10.8 GW of offshore capacity in 2024, directly translating into blade orders valued at an estimated USD 3.2 billion over 2025–2028 [9].

Asia-Pacific

Country Key Metric Key Driver
China ~58% of regional share Domestic OEM dominance; provincial mandates
India CAGR ~10.4% 500 GW non-fossil target; first offshore tenders
South Korea ~USD 0.9 B (2025) 12 GW offshore roadmap by 2030
Japan CAGR ~8.2% Floating wind demonstration; Akita/Goto projects
Rest of Asia-Pacific ~6% of regional share Vietnam, Taiwan, Philippines emerging pipelines


China's blade manufacturing capacity exceeded 120 GW-equivalent per year in 2024, supported by vertically integrated OEMs such as Goldwind, Envision, and Mingyang, alongside independent blade suppliers like Sinoma and Zhongfu Lianzhong [2]. India's Ministry of New and Renewable Energy tendered its first 4 GW of offshore wind capacity in Gujarat and Tamil Nadu in 2024, creating a new blade demand vector in a geography historically limited to sub-3 MW onshore platforms [12]. The Wind Turbine Rotor Blade Market in Asia-Pacific is defined by a dual dynamic: massive scale at competitive cost in China, and high-growth greenfield opportunities across Southeast Asia and the Indian subcontinent.

North America

Country Key Metric Key Driver
United States ~85% of regional share IRA Section 45X credits; Atlantic offshore lease areas
Canada CAGR ~6.8% Alberta/Ontario repowering; Atlantic offshore exploration
Mexico ~USD 0.3 B (2025) Isthmus of Tehuantepec onshore clusters


The U.S. dominates the North American Wind Turbine Rotor Blade Market with over 150 GW of installed onshore wind capacity creating sustained aftermarket and repowering demand. BOEM's Atlantic offshore pipeline represents approximately 40 GW of potential installations through 2035, though permitting timelines and power-purchase agreement pricing have introduced project-level uncertainty [10]. TPI Composites remains the only pure-play independent blade manufacturer headquartered in North America, operating factories in Iowa and Mexico alongside facilities in India, Turkey, and China [16].

South America

Country Key Metric Key Driver
Brazil ~78% of regional share Regulated auctions; strong Class-II/III wind resource in Northeast
Chile CAGR ~9.3% Green hydrogen export strategy requiring wind capacity
Rest of South America ~USD 0.2 B (2025) Colombia, Argentina early-stage development


Brazil's ANEEL-regulated wind auctions cleared 3.5 GW of new capacity in 2024, and the country's cumulative installed base surpassed 30 GW. Blade demand is concentrated in the 60–75 meter range for 4–6 MW onshore platforms, and local-content regulations have encouraged TPI Composites and Aeris Energy to maintain manufacturing operations in Bahia and Ceará states [14].

Middle East & Africa

Country Key Metric Key Driver
South Africa ~45% of regional share REIPPPP Round 6/7 allocations
Saudi Arabia CAGR ~11.2% NEOM 400 MW Dumat Al Jandal; Vision 2030
Rest of MEA ~USD 0.3 B (2025) Morocco, Egypt, Kenya emerging wind markets


South Africa's Renewable Energy Independent Power Producer Procurement Programme remains the continent's most mature wind procurement framework, with Round 7 expected to allocate 3.6 GW of wind capacity through 2028 [14]. Saudi Arabia's 400 MW Dumat Al Jandal project — the Middle East's largest operational wind farm — uses Vestas V150-4.2 MW turbines with 73.7-meter blades, and the kingdom's Public Investment Fund has signaled 16 GW of renewable targets by 2030 that will substantially increase blade procurement in the region.


Wind Turbine Rotor Blade Market By Region, 2025-2035

Competitive Benchmarking

The Wind Turbine Rotor Blade Market exhibits moderate concentration. The top five blade suppliers — LM Wind Power, TPI Composites, Sinoma Wind Power, Zhongfu Lianzhong, and vertically integrated Vestas — collectively hold an estimated 55–60% of global blade revenue. In-house blade production by turbine OEMs such as Siemens Gamesa, Nordex, and Enercon further consolidates supply. Independent blade makers face margin pressure as OEMs internalize manufacturing to secure supply-chain control and protect technology IP.

Company Est. Revenue Share Range Key Offerings Strategic Positioning
LM Wind Power (GE Vernova) ~14–17% Blades up to 115 m; offshore-focused portfolio Largest independent supplier; global footprint
TPI Composites ~8–11% Contract blade manufacturing; onshore and offshore Pure-play independent; multi-OEM customer base
Vestas (in-house) ~10–13% V236-15.0 MW 115.5 m blades; proprietary carbon spar tech Vertically integrated; technology leader
Siemens Gamesa (in-house) ~9–12% RecyclableBlade; IntegralBlade one-shot infusion Sustainability differentiation; offshore focus
Sinoma Wind Power ~7–9% Cost-competitive large blades for Chinese OEMs Domestic scale; emerging export ambitions
Zhongfu Lianzhong ~5–7% Blades up to 100 m for Goldwind, Envision China's second-largest independent supplier
Nordex (in-house) ~4–6% Delta4000 platform blades; onshore specialist European onshore focus; cost optimization
Enercon (in-house) ~3–5% Rotor-only design philosophy; direct-drive integration Vertically integrated; niche positioning
TPI India / Aeris Energy ~2–4% Regional blade manufacturing for Indian and Brazilian markets Emerging-market cost leaders
Mingyang (in-house) ~2–4% MySE 16-260 platform; export-oriented offshore blades Aggressive internationalization from China base


Recent News & Developments


  • GWEC (June 2024): Published the Global Wind Report 2024 showing 117 GW of new installations in 2023 — a record year — with blade supply identified as the primary bottleneck for 2025–2026 delivery schedules [8].
  • European Commission (April 2024): Proposed inclusion of wind turbine blades under the Ecodesign for Sustainable Products Regulation, signaling mandatory recyclability requirements by 2028 [18].


Wind Turbine Rotor Blade Market Report Scope

Parameter Detail
Market Scope Global Wind Turbine Rotor Blade Market, including raw materials, manufacturing, and aftermarket services
Study Period 2021–2035
CAGR 7.4% (2026–2035)
Base Year 2025 (USD 30.2 Billion)
2035 Forecast USD 61.6 Billion
Fastest Growing Segments Carbon fiber composite blades (by material); Offshore (by application); Above 100 m (by blade length); Asia-Pacific (by region)
Companies Profiled LM Wind Power, TPI Composites, Vestas, Siemens Gamesa, Sinoma Wind Power, Zhongfu Lianzhong, Nordex, Enercon, Aeris Energy, Mingyang
Valuation Currency USD (constant 2025 dollars)


FAQs

How does blade length selection affect total project economics beyond energy capture?
Longer blades increase foundation loads, crane specifications, and installation vessel costs. For offshore projects, moving from 80 m to 115 m blades can raise per-turbine installation costs by 20–30% while cutting the turbine count per project by one-third [9].
What insurance and warranty structures dominate blade procurement contracts?
Most OEMs offer 5-year standard blade warranties with optional 10–15-year extensions priced at 1.5–2.5% of blade contract value annually. Serial defect clauses typically cap OEM liability at fleet-wide replacement cost [16].
How do segmented blade designs compare to monolithic blades in structural performance?
Segmented blades introduce bolted or bonded joints that add 5–8% to blade mass and require periodic torque verification. Monolithic designs remain structurally superior but face hard transport limits above 75–80 meters in landlocked regions [17].
What quality-certification standards must blades meet for bankable offshore projects?
IEC 61400-5 and DNV-ST-0376 are the primary standards. Full-scale static and fatigue testing takes 12–18 months and costs USD 3–5 million per blade type [20].
How are blade manufacturers managing carbon fiber supply concentration risk?
Over 60% of large-tow carbon fiber used in blades comes from three suppliers: Toray, SGL Carbon, and Teijin. OEMs are qualifying alternative precursors and investing in textile-grade carbon fiber to diversify sourcing [7].
What role do blade coatings play in long-term energy yield preservation?
Leading-edge erosion from rain, hail, and particulates can reduce annual energy production by 2–5% within ten years. Polyurethane erosion shields and field-applied coatings extend maintenance intervals from 3 to 7+ years [20].
How do local-content requirements in emerging markets shape blade supply-chain decisions?
Brazil, India, and South Africa mandate 40–60% local value addition for wind projects. This drives blade finishing and assembly localization even when raw composites are imported [14].    
Author
Author
Author Profile
Chitranshi Jaiswal LinkedIn
Team Lead - Research
Chitranshi is a Team Leader in the Chemicals & Materials (CnM) and Energy & Power (EnP) domains, with 6+ years of experience in market research. She leads and mentors teams to deliver cross-domain projects that equip clients with actionable insights and growth strategies. She is skilled in market estimation, forecasting, competitive benchmarking, and both primary & secondary research, enabling her to turn complex data into decision-ready insights. An engineer and MBA professional, she combines technical expertise with strategic acumen to solve dynamic market challenges. Chitranshi has successfully managed projects that support market entry, investment planning, and competitive positioning, while building strong client relationships. Certified in Advanced Excel & Power BI she leverages data-driven approaches to ensure accuracy, clarity, and impactful outcomes.

Research Approach


Secondary Research

The secondary research process involved comprehensive analysis of renewable energy databases, peer-reviewed engineering journals, industry publications, and authoritative energy organizations. Key sources included the International Energy Agency (IEA), Global Wind Energy Council (GWEC), American Wind Energy Association (AWEA/WindEurope), National Renewable Energy Laboratory (NREL), European Wind Energy Association (EWEA), International Renewable Energy Agency (IRENA), U.S. Department of Energy (DOE) Wind Energy Technologies Office, International Electrotechnical Commission (IEC), DNV GL Energy, WindPower Engineering & Development, BloombergNEF, Wood Mackenzie Power & Renewables, International Composite Materials Conference proceedings, and national energy ministry reports from key markets (China National Energy Administration, German Federal Ministry for Economic Affairs and Energy, Indian Ministry of New and Renewable Energy). These sources were used to collect wind capacity installation statistics, blade manufacturing capacity data, material innovation studies, aerodynamic design advancements, recycling technology developments, and supply chain landscape analysis for Glass Fiber Reinforced Polymer (GFRP), Carbon Fiber Reinforced Polymer (CFRP), Natural Fiber Reinforced Polymer (NFRP), and other advanced composite technologies.


Primary Research

In order to gather both qualitative and quantitative insights, supply-side and demand-side stakeholders were interviewed during the primary research process. CEOs, vice presidents of manufacturing, chief technology officers, heads of research and development, and commercial directors from wind turbine OEMs, blade producers, and suppliers of composite materials were examples of supply-side sources. Project developers, wind farm operators, utility company procurement leaders, independent power producers (IPPs), engineering procurement construction (EPC) contractors, and offshore wind developers were examples of demand-side suppliers. In addition to confirming product development timelines and gathering information on manufacturing capacity expansion, blade recycling initiatives, pricing dynamics, and logistics challenges, primary research validated market segmentation across material types (GFRP, CFRP, NFRP), blade designs (fixed-pitch, variable-pitch, semi-variable-pitch), size categories (small <40m, medium 40-60m, large >60m), power outputs (low <2MW, medium 2-5MW, high >5MW), and applications (onshore vs. offshore).

Primary Respondent Breakdown:

By Designation: C-level Primaries (28%), Director Level (33%), Others (39%)

By Region: North America (28%), Europe (32%), Asia-Pacific (34%), Rest of World (6%)


Market Size Estimation

Global market valuation was derived through revenue mapping and installation capacity analysis. The methodology included:

Identification of 50+ key manufacturers across North America, Europe, Asia-Pacific, and Latin America

Product mapping across GFRP, CFRP, NFRP, and hybrid composite material categories

Analysis of reported and modeled annual revenues specific to rotor blade manufacturing portfolios

Coverage of manufacturers representing 75-80% of global market share in 2024

Extrapolation using bottom-up (blade unit volume × ASP by blade length and material) and top-down (manufacturer revenue validation) approaches to derive segment-specific valuations for onshore and offshore applications, with particular emphasis on the rapidly expanding >60 meter blade segment for offshore wind installations

Download Free Sample

Kindly complete the form below to receive a free sample of this Report

Download PDF ×

We do not share your information with anyone. However, we may send you emails based on your report interest from time to time. You may contact us at any time to opt-out.

















