乘车共享市场总结
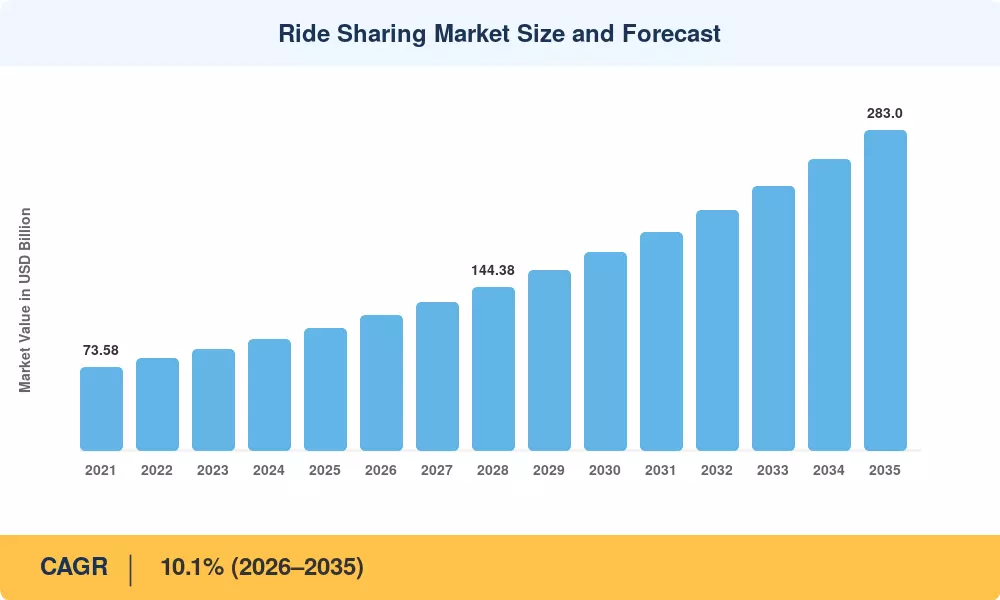
乘车共享市场预计到 2025 年将达到 1082 亿美元,预计将从 2026 年的 1191 亿美元增长到 2035 年的 2830 亿美元,预测期内(2026-2035 年)复合年增长率为 10.1%。有两个催化剂支撑着这一轨迹:G20 国家积极实施减少城市拥堵的强制令,以及自 2021 年以来风险加企业对网约车平台技术的累计投资超过 420 亿美元[2]。乘车共享市场不再是一种便利游戏——它正在成为嵌入式市政基础设施。
技术转型正在重塑该行业的核心。传统的街头叫车出租车调度和分散的私人租赁模式正在让位于算法优化的拼车、共享行程匹配、实时动态定价引擎以及日益自动化的机器人出租车乘车共享试点。仅 Waymo 就承诺在 2023 年至 2025 年间投资超过 55 亿美元用于自动驾驶车队扩张,而 Uber 和 Lyft 则投入资源用于与净零排放承诺相关的电动汽车共享车队转换[3][4]。企业乘车共享员工通勤计划现在代表着一个快速扩张的领域,Zeelo 和 Via 等平台每年获得价值数亿美元的企业合同[5].
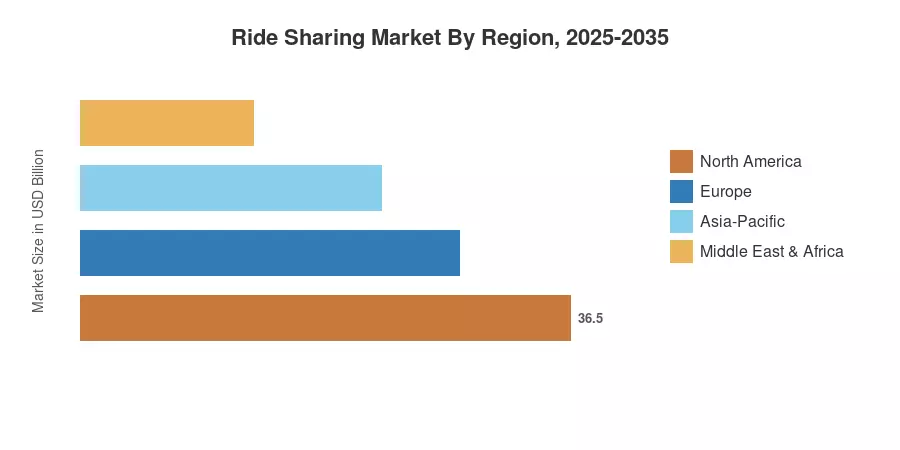
在美国智能手机的深入普及和成熟的网约车平台生态系统的推动下,北美占据了全球约 38% 的乘车共享市场。在印度、印度尼西亚和越南城市化浪潮的推动下,亚太地区是增长最快的地区,预计复合年增长率为 12.6%。欧洲占据约 25% 的份额,严格的排放标准加速了电动汽车共享车队的采用。随着自动驾驶出租车共享出行从试点阶段扩展到商业部署,共享出行市场正处于一个拐点,到 2035 年将重新定义城市出行。
报告要点
• 按服务类型
- 乘车服务在乘车共享市场中占据最大收入份额,约占 62%,由西方市场占主导地位的乘车平台运营商 Uber 和 Lyft 以及亚洲市场的 Grab 和 DiDi 维持。
- 在注重成本的城市通勤者和市政 HOV 车道激励措施的推动下,拼车共享行程匹配是增长最快的细分市场,预计复合年增长率为 13.4%
- 2025 年汽车租赁和微型交通领域的收入总计达 187 亿美元
• 按会员类型
- 个人出行在乘车共享市场中占据大约 74% 的份额,反映出消费者对按需交通的依赖
- 随着雇主补贴最后一英里连接,企业拼车员工通勤计划正以 14.1% 的复合年增长率扩大
• 按地区
- 2025 年北美乘车共享市场收入约为 411 亿美元
- 到 2035 年,亚太地区的复合年增长率将达到 12.6%,超过所有其他地区
- 欧洲的份额由拼车监管保险责任框架支撑,该框架使平台与司机的关系正式化
乘车共享市场规模及预测(2021-2035)
市场规模评估采用自下而上的方法,汇总平台报告的总预订量、监管备案、车队远程信息处理数据以及对 18 个国家/地区 120 多名行业高管的 MRFR 初步访谈。历史数据与 Uber、Lyft、Grab 和 DiDi 的公开收益披露进行了三角测量[6].
驾驶员影响分析
| 司机 |
~% 对复合年增长率的影响 |
地理相关性 |
影响时间表 |
参考号 |
| 城市化和拥堵收费 |
〜2.1% |
全球的 |
长期(≥4年) |
[2] |
| 自动驾驶出租车共享部署 |
〜1.8% |
北美、中国 |
中期(2-4 年) |
[9] |
| 电动汽车共享车队指令 |
〜1.5% |
欧洲、加利福尼亚州 |
短期(≤2年) |
[4] |
| 拼车共享行程匹配算法 |
〜1.3% |
全球的 |
短期(≤2年) |
[8] |
| 企业乘车共享员工通勤补贴 |
〜1.1% |
北美、欧洲 |
中期(2-4 年) |
[5] |
| 超级应用集成(支付、配送、运输) |
~0.9% |
亚太 |
中期(2-4 年) |
[10] |
| 乘车共享监管、保险和责任标准化 |
~0.7% |
欧盟、澳大利亚 |
长期(≥4年) |
[11] |
城市化和拥堵收费规定
据联合国估计,到2050年,居住在城市的人口将增加25亿,占世界人口的68%[2]。伦敦、斯德哥尔摩、新加坡和纽约等城市已经设立或增加了拥堵收费区,直接鼓励拼车、共享出行匹配而不是单人乘车出行。到 2024 年,伦敦超低排放区已将中心交通量减少了 17%,每年带来超过 2.2 亿英镑的收入,这鼓励了通勤者使用乘车共享市场[12].
自主机器人出租车车队部署
到 2024 年底,Waymo 在旧金山、菲尼克斯和洛杉矶每周的付费自动驾驶乘车次数超过 150,000 次,这是自动驾驶最切实的证明机器人出租车商业规模的拼车服务[9]。尽管 Cruise 于 2023 年暂停运营,但仍于 2025 年在通用汽车重组后的自动驾驶部门的领导下恢复了有限的测试。到 2024 年中期,中国的百度 Apollo Go 机器人出租车累计完成超过 700 万次出行[13]。这些部署消除了司机成本(通常占每次乘车经济效益的 60% 至 65%),并且一旦规模扩大,可以将乘车平台费用压缩 40%。
电动汽车车队转型
Uber 和 Lyft 基本上需要将其车队转换为电动汽车,以符合加州的清洁里程标准,该标准要求到 2030 年 90% 的乘车平台车辆里程为零排放[4]。欧盟类似的“Fit for 55”计划也推动了商业车队的类似电气化时间表。早期电气化可降低每英里的运营成本(ICE 为 0.04-0.06 美元/英里,而 ICE 为 0.12-0.15 美元/英里),并为拼车市场运营商提供进入机场和监管区域路缘的优先权。
企业通勤计划扩展
2024 年全球工作场所分析研究发现,62% 的财富 500 强公司现在通过乘车共享平台补贴员工通勤计划[5]。到 2025 年,全球企业拼车员工通勤支出预计将达到 83 亿美元,其中 Via、Zeelo 和 Uber for Business 获得了大部分企业合同。税收优惠——包括每名员工每月高达 315 美元的美国合格交通附加福利——加速了采用。
限制影响分析
以下影响是减缓增长的定向逆风。它们不会从规定的复合年增长率中线性减去。
| 克制 |
~% 对复合年增长率的影响 |
地理相关性 |
影响时间表 |
参考号 |
| 司机分类及劳动争议 |
–1.2% |
欧盟、加利福尼亚州、英国 |
短期(≤2年) |
[11] |
| 乘车共享监管、保险和责任分散 |
–0.9% |
全球的 |
长期(≥4年) |
[14] |
| 数据隐私和监控问题 |
–0.5% |
欧盟、印度 |
中期(2-4 年) |
[15] |
| 新兴市场的基础设施差距 |
–0.7% |
非洲、南亚 |
长期(≥4年) |
[16] |
| 自动驾驶汽车责任模糊 |
–0.4% |
北美、欧盟 |
中期(2-4 年) |
[9] |
驾驶员分类和劳动法规
2024 年通过的欧盟平台工作指令为符合特定标准的零工工人建立了合法的就业推定,迫使网约车平台运营商重新分类司机或重组参与模式[11]。加利福尼亚州的 AB5 先例和英国最高法院 2021 年 Uber 的裁决造成了重叠(有时甚至是矛盾)的合规负担。重新分类预计会使每次乘车成本增加 15-25%,压缩乘车共享市场的利润,并减缓监管严格的司法管辖区的扩张。
跨司法管辖区的监管分散
没有两个国家拥有相同的拼车法律。拼车法规的保险责任要求各不相同,从美国的强制商业汽车保单到日本的准公共计划,以及德国和西班牙部分地区的彻底平台禁令(直到最近逆转)[14]。由于这种拼凑的结果,运营商必须保留特定管辖区的合规团队,这会延迟市场进入并增加管理费用。拼车和共享出行匹配领域的初创公司面临着不成比例的障碍。
数据隐私限制
针对叫车平台位置跟踪方法的 GDPR 执法程序凸显了服务优化与消费者隐私之间的冲突,例如 Uber 2024 年在荷兰被处以 2.9 亿欧元罚款[15]。印度《数字个人数据保护法》(2023) 实施的同意和数据本地化规则提高了乘车共享市场平台的基础设施费用。
.
乘车共享市场机会
自主机器人出租车大规模商业化
预计到 2029 年至 2031 年,自动驾驶机器人出租车的乘车共享成本将低于人工驾驶的乘车服务,乘车共享市场将出现 45-600 亿美元的潜在机会[9]。拥有监管部门批准和车队管理软件的先行者将占据不成比例的份额
拼车业务在二线和三线城市的扩展
拼车共享出行匹配仍然集中在全球排名前 25 的大城市。将算法匹配扩展到公共交通不发达但智能手机普及率超过 70% 的中型城市意味着到 2030 年每年价值估计达 120 亿美元的新机遇
企业移动即服务捆绑
企业越来越多地将企业乘车共享员工通勤计划与停车管理捆绑在一起,微移动性订阅和交通通行证纳入统一的移动预算。与独立的网约车服务相比,集成这些产品的平台可以将每个帐户的收入提高 3-4 倍
数据货币化和城市规划合作伙伴关系
乘车共享市场平台每天生成数十亿个 GPS 数据点。将匿名出行流分析货币化,为市政交通部门、房地产开发商和零售地点策略师创造独立于乘车量的经常性 SaaS 收入流
非洲和东南亚新兴市场跨越式发展
尼日利亚、肯尼亚、越南和菲律宾等市场正在将传统的出租车基础设施直接跨越到基于应用程序的叫车平台模式。非洲的拼车渗透率仍低于 3%,仍有巨大的发展空间[16]
乘车共享市场未来展望
自主运营和人工智能驱动的车队管理
到 2032 年,自动驾驶出租车共享预计将占美国和中国共享出行市场总出行量的 8% 至 12%[9]. 基于人工智能的车队再平衡、预测需求模型和车辆健康监控将使平台运营成本降低 20-30%,从而降低票价并扩大可寻址乘客群体。
平台经济与整合
随着盈利压力的加大,网约车平台格局可能会进一步整合。 Uber、Lyft、Grab 和 DiDi 共同控制着超过 75% 的潜在市场——这种集中可能会引发反垄断审查,但也能实现为乘车共享市场的自动驾驶和电动转型提供资金所需的规模经济[6][18].
电气化与电网并网
根据 IEA 全球电动汽车展望预测,到 2030 年,电动汽车共享车队在主要平台的渗透率预计将达到 40-50%,到 2035 年将超过 75%[19]. 车到电网(V2G) 集成可以将闲置的乘车共享车辆转变为分布式能源资产,为车队运营商创造二次收入来源。
ESG 报告和可持续发展指令
机构投资者越来越多地根据可衡量的 ESG 绩效来调整资本配置。乘车共享市场平台发布经审计的每次乘车排放指标、驾驶员福利指数和拼车共享行程匹配利用率将吸引优惠的融资条款。气候相关财务披露工作组 (TCFD) 框架正在成为交通部门报告的事实上的标准[20].
区域市场份额分析
| 地区 |
关键指标 |
主要投资主题 |
| 北美 |
38% 份额(41.1 美元乙) |
自动驾驶出租车共享试点、电动汽车车队强制要求 |
| 欧洲 |
25% 份额(27.1 美元 B) |
乘车共享监管、保险责任改革和电气化 |
| 亚太 |
CAGR 12.6% |
超级应用生态系统、拼车、共享行程匹配和密度 |
| 南美洲 |
USD 5.4 B |
摩托出租车数字化、金融科技乘车整合 |
| 中东和非洲 |
CAGR 11.3% |
政府支持的智慧城市计划 |
| 全部的 |
USD 108.2 B |
— |
乘车共享市场呈现出由监管成熟度、城市化密度和车辆拥有经济学决定的独特区域动态。
北美
| 国家 |
关键指标 |
关键驱动程序 |
| 美国 |
82%的地区份额 |
Uber/Lyft 双头垄断,自动驾驶出租车共享出行扩张 |
| 加拿大 |
CAGR 9.8% |
多伦多、温哥华的城市致密化 |
| 墨西哥 |
USD 2.1 B |
滴滴和优步正在争夺打车平台的主导地位 |
美国仍然是全球乘车共享创新的中心。 2024 年 Uber 在美国的总预订量将超过 400 亿美元,而 Waymo 的自动驾驶车队每周处理超过 15 万次乘车[3][9]。加拿大的乘车共享市场受益于联邦清洁燃料法规,这些法规鼓励电动车在主要地铁部署共享出行车队。
欧洲
| 国家 |
关键指标 |
关键驱动程序 |
| 英国 |
地区份额31% |
TfL 许可框架、Bolt 扩展 |
| 德国 |
CAGR 10.9% |
放松管制后网约车平台的增长 |
| 法国 |
USD 4.2 B |
BlaBlaCar 城际拼车、拼车监管、保险、责任调整 |
欧洲的平台工作指令正在重塑乘车共享市场的竞争格局,提高合规成本,但也使驾驶员保护正式化,以提高服务可靠性[11]。欧盟的“Fit for 55”气候计划要求所有成员国加速电动汽车共享车队的转型。
亚太
| 国家 |
关键指标 |
关键驱动程序 |
| 中国 |
42%的地区份额 |
滴滴占据主导地位,百度Apollo自动驾驶出租车共享出行 |
| 印度 |
CAGR 14.2% |
Ola/Uber 价格战,两轮车乘车平台增长 |
| 东南亚 |
USD 7.8 B |
Grab/Gojek 超级应用生态系统 |
人口密度、低车辆保有率以及集成拼车、共享行程匹配支付、食品配送和金融服务的超级应用平台推动了亚太地区的乘车共享市场增长[10]。预计 2025 年至 2035 年间,仅印度就将新增 1.8 亿共享出行用户。
南美洲
| 国家 |
关键指标 |
关键驱动程序 |
| 巴西 |
68%的地区份额 |
99(滴滴子公司)与Uber竞争 |
| 阿根廷 |
CAGR 10.4% |
比索贬值增加了拼车需求 |
巴西的乘车共享市场受益于高城市化率(87%)和长期公共交通投资不足。 99Motos 等摩托出租车平台是独特的区域增长载体[16].
中东和非洲
| 国家 |
关键指标 |
关键驱动程序 |
| 阿联酋 |
地区份额38% |
Careem(Uber 子公司),智慧城市计划 |
| 沙特阿拉伯 |
CAGR 13.1% |
2030 年愿景城市交通投资 |
| 尼日利亚 |
USD 0.6 B |
螺栓快速扩张、无银行账户人口和金融科技整合 |
根据 2030 年愿景,沙特阿拉伯公共投资基金已向城市交通领域投入超过 35 亿美元,直接支持网约车平台基础设施和自动驾驶汽车测试走廊[17].
乘车共享市场细分
按服务类型
| 部分 |
关键指标 |
主要需求驱动因素 |
| 网约车 |
62% 份额 |
乘车平台 Uber Lyft 占据主导地位,便利性 |
| 拼车/共享行程 |
CAGR 13.4% |
节省成本、拼车、共享行程匹配算法 |
| 汽车租赁/订阅 |
USD 11.2 B |
灵活的所有权选择 |
| 微交通/班车 |
CAGR 11.8% |
企业乘车共享员工通勤计划 |
网约车仍然是乘车共享市场的支柱,通过单乘客按需出行产生大部分平台收入。 Uber 和 Lyft 合计占美国打车量的 70% 以上,而滴滴和 Grab 在中国和东南亚分别占据相当的地位[6]。拼车共享行程匹配是增长最快的服务类型,算法现在在密集的城市走廊中实现了 85% 以上的匹配率,与单人出行相比,每位乘客的成本降低了 30-40%[8].
按申请
| 部分 |
关键指标 |
主要需求驱动因素 |
| 个人移动性 |
74% 份额 |
日常通勤、休闲、机场接送 |
| 企业/企业 |
CAGR 14.1% |
企业乘车共享员工通勤预算 |
| 政府/公共交通一体化 |
USD 4.6 B |
第一英里/最后一英里交通间隙解决方案 |
随着雇主采用托管移动计划,企业应用的乘车共享市场正在蓬勃发展。政府合作伙伴关系——例如达拉斯地区捷运公司由 Via 提供支持的微型交通服务——说明了乘车共享平台如何补充而不是取代公共交通[21].
通过车辆推进
| 部分 |
关键指标 |
主要需求驱动因素 |
| 内燃机车 |
61% 份额(下降) |
传统舰队惯性 |
| 纯电动汽车 |
CAGR 18.2% |
电动汽车共享车队授权,降低总体拥有成本 |
| 混合动力汽车 |
USD 14.8 B |
缺乏充电基础设施的市场的过渡桥梁 |
电动汽车共享出行车队细分代表了共享出行市场中最具活力的转型。在深圳和奥斯陆等城市运营纯电动车队的平台报告称,每英里的燃油和维护成本比内燃机同类车型低 35-45%[4][19].
竞争标杆管理
乘车共享市场表现出中等到高度的集中度,全球前 15 个市场的 HHI 估计约为 1,800-2,200。尽管地区构成差异很大,但排名前五的平台总共占据了全球总预订量的 65-70%。
| 公司 |
预计。收益分成范围 |
乘车共享市场的主要产品 |
战略定位 |
| 优步科技 |
〜28–32% |
乘车服务、UberPool、Uber for Business 和自动驾驶合作伙伴关系 |
全球规模领先,网约车平台占据主导地位 |
| 滴滴全球 |
〜18–22% |
叫车、拼车和自动驾驶 |
中国+拉美大本营 |
| 来福车 |
〜6–9% |
叫车、拼车、自行车/踏板车租赁 |
专注于美国/加拿大、拼车、共享行程匹配 |
| 抓斗控股 |
〜5–7% |
超级应用:乘车、送货、支付 |
东南亚生态系统锁定 |
| 螺栓(Taxify) |
〜3–5% |
叫车、微型出行、食品配送 |
欧洲和非洲扩张 |
| 奥拉·卡布斯 |
〜3–5% |
叫车服务,Ola Electric 车队 |
印度占主导地位的电动汽车共享车队先驱 |
| 布拉布拉车 |
〜2–3% |
长途拼车、巴士市场 |
欧洲城际拼车 |
| 通过交通 |
〜1–2% |
B2B 交通即服务、微交通 |
企业乘车共享员工通勤技术 |
| Waymo(字母表) |
〜1–2% |
自主机器人出租车乘车共享服务 |
技术优先、纯无人驾驶模式 |
|
卡瑞姆(优步) |
〜1–2% |
打车、支付超级应用 |
中东和北非 |
最近的新闻和动态
- Waymo(2024 年 10 月):将自动驾驶出租车共享服务扩展到洛杉矶,在美国三个城市每周付费乘车次数超过 100,000 次[9].
- Uber Technologies(2024 年 8 月):宣布与比亚迪合作,到 2027 年在全球网约车平台上部署 10 万辆电动汽车,加速实现电动汽车共享车队目标[4].
- 欧盟(2024 年 4 月):通过了平台工作指令,建立了影响 27 个成员国的拼车监管保险责任框架的就业推定标准[11].
- Grab Holdings(2024 年 1 月):在雅加达和曼谷推出 GrabPool AI 优化的拼车共享行程匹配,报告匹配率比之前的算法高 22%[10].
- Lyft(2025 年 3 月):在拉斯维加斯为其 Motional 驱动的机器人出租车服务推出“Lyft Autonomous”品牌,这是美国第一个提供预定无人驾驶乘车服务的叫车平台[22].
- Ola Electric(2024 年 6 月):承诺斥资 5 亿美元扩大电动两轮车车队,用于印度 50 个城市的企业共享乘车员工通勤计划[23].
- 沙特阿拉伯 PIF(2023 年 11 月):根据 2030 年愿景投资 13 亿美元用于国内拼车基础设施,包括 NEOM 的自动驾驶汽车测试区[17].
- 百度Apollo Go(2024年9月):中国累计自动驾驶出行次数突破800万次,获得监管部门批准在武汉开展完全无人驾驶业务[13].
- Lyft(2025 年 7 月):Lyft 以 1.75 亿欧元(1.91 亿美元)完成对 FREENOW 的收购,将业务扩展到 11 个国家和近 1,000 个城市。
- Waymo(2025 年 6 月):Waymo 和 Uber 在亚特兰大推出了商业机器人出租车服务,使用捷豹 I-PACE 无人驾驶车辆行驶 65 平方英里。
常见问题解答
Q1.乘车共享平台如何利用行程费用以外的数据货币化?
平台向城市规划者、房地产开发商和广告商授权匿名的始发地-目的地流量数据。领先的叫车平台运营商的数据即服务收入流每年以约 20% 的速度增长[18].
Q2。当自动驾驶出租车发生事故时,适用什么保险结构?
大多数司法管辖区将主要责任归于自动驾驶汽车运营商或技术提供商,而不是乘客。乘车共享监管保险责任框架正在不断发展,加州和英国领先政策制定[14].
Q3。与单独打车相比,拼车对司机收入有何影响?
使用拼车共享行程匹配路线的司机每次行程的收入通常会减少 10–15%,但由于空驶里程减少,每小时完成的行程会增加 25–30%[8]。每小时净收入保持可比。
Q4。哪个乘车共享细分市场为机构投资者提供了最佳切入点?
电动汽车共享车队运营商和自动驾驶技术提供商的增长倍数最高。以车队为中心的 SPAC 和 Waymo 预期的 IPO 是受到密切关注的机会[9][19].
Q5.企业乘车共享计划能否与现有的企业资源规划系统集成?
是的 - Via 和 Uber for Business 等平台提供与 SAP、Oracle 和 Workday 的 API 集成,以实现自动费用核对。当 IT 摩擦最小化时,企业乘车共享员工通勤的采用会加速[5].
Q6.印度新兴的乘车共享市场法规与西方框架有何不同?
印度的机动车辆聚合指南将平台佣金上限控制在 20%,并强制规定驾驶员福利基金——比大多数西方拼车监管保险责任模型更为严格[14][16].
Q7.乘车共享市场在市政脱碳目标中发挥什么作用?
阿姆斯特丹和深圳等城市要求到 2030 年,网约车平台车队实现 100% 零排放。与私家车使用相比,共享乘车可减少人均排放量 45-55%,使乘车共享市场成为重要的城市气候工具[12][19].
乘车共享市场报告范围
| 范围 |
细节 |
| 市场范围 |
全球乘车共享市场,包括网约车、拼车、微型交通和自动驾驶服务 |
| 学习期限 |
2021–2035 |
| CAGR |
10.1%(2026-2035) |
| 基准年市场规模 |
USD 108.2 Billion (2025) |
| 预测端点 |
USD 283.0 Billion (2035) |
| 增长最快的细分市场 |
拼车共享行程匹配(复合年增长率 13.4%) |
| 公司简介 |
优步、滴滴、Lyft、Grab、Bolt、Ola、BlaBlaCar、Via、Waymo、Careem |
| 计价货币 |
美元(2025 年不变价) |