Global market valuation was derived through revenue mapping and shipment volume analysis. The methodology included:
Identification of 60+ key manufacturers across North America, Europe, Asia-Pacific, and Latin America
Product mapping across floating ball valves, trunnion-mounted ball valves, fully welded ball valves, top-entry ball valves, and other configurations
Analysis of reported and modeled annual revenues specific to ball valve portfolios
Coverage of manufacturers representing 75-80% of global market share in 2024
Extrapolation using bottom-up (shipment volume × ASP by region/application) and top-down (manufacturer revenue validation) approaches to derive segment-specific valuations across oil & gas (upstream, midstream, downstream), water & wastewater, chemical processing, power generation, and general industrial sectors
End-Use Industry Segmentation:
Oil & Gas (upstream exploration & production, midstream pipelines, downstream refining)
Water & Wastewater (municipal water distribution, sewage treatment, desalination)
Chemical Processing (petrochemicals, specialty chemicals, pharmaceuticals)
Power Generation (thermal, nuclear, renewable energy)
General Industrial (mining, pulp & paper, food & beverage)
Regional Coverage:
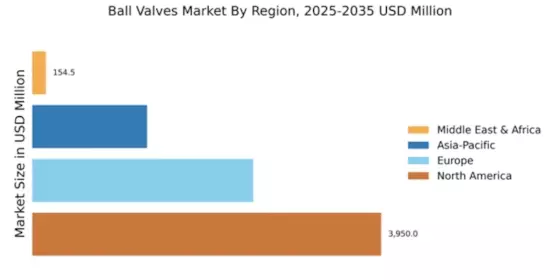
North America (United States, Canada, Mexico)
Europe (Germany, Italy, UK, France, Russia, Norway)
Asia-Pacific (China, Japan, India, South Korea, Australia, Southeast Asia)
Latin America (Brazil, Argentina, Venezuela)
Middle East & Africa (Saudi Arabia, UAE, South Africa, Nigeria)