3D Printing Market (2026 - 2035)

3D Printing Market Size, Share and Research Report By Component (Hardware, Software, Services), By Printer Type (Industrial, Desktop), By Technology (Powder Bed Fusion, Vat Photopolymerization, Material Extrusion, Binder Jetting, Other Technologies (DED, Sheet Lamination, Material Jetting)), By Material (Polymers, Metals & Alloys, Ceramics & Others), By Application (Prototyping, Manufacturing / Production Parts, Tooling, Jigs & Fixtures), By End-User Industry (Aerospace & Defense, Automotive, Healthcare, Consumer Goods & Electronics, Education & Research) and By Region (North America, Europe, Asia-Pacific, South America, Middle East & Africa) – Industry Forecast to 2035.

Forecast Period
2026-2035
CAGR
13.94%
2025 Market Size
USD 32.35 billion (2025)
2035 Market Size
USD 119.35 billion (2035)
Silicon, Wafer and Fabrication ● Updated August 24, 2026 Report ID: MRFR/SEM/0525-HCR | Pages: 200 | Author: Nirmit Biswas, Aarti Dhapte

3D Printing Market Summary

The global 3D Printing Market reached USD 32.35 billion in 2025 and is projected to climb to USD 36.86 billion in 2026 before expanding to USD 119.35 billion by 2035, registering a 13.94% CAGR across the forecast window. Two catalysts are accelerating that trajectory: the U.S. Department of Defense allocated over USD 1.2 billion toward additive manufacturing qualification programs between 2023 and 2025, and the European Commission's Horizon Europe framework earmarked EUR 850 million for digital manufacturing initiatives through 2027 [1][2].

The technology disruption that is transforming the 3D Printing Market is based on replacing traditional subtractive machining with layer-by-layer deposition that reduces material waste by 40-70%. Flight-qualified turbine blades, orthopedic implants, and series-run automobile brackets that previously took months of CNC toolpath programming are now being manufactured via powder bed fusion and binder jetting systems. The metal additive manufacturing industry alone has received more than USD 4.8 billion in corporate capital commitments in 2024, confirming that the industry has shifted from prototype to verified serial production [3][4].


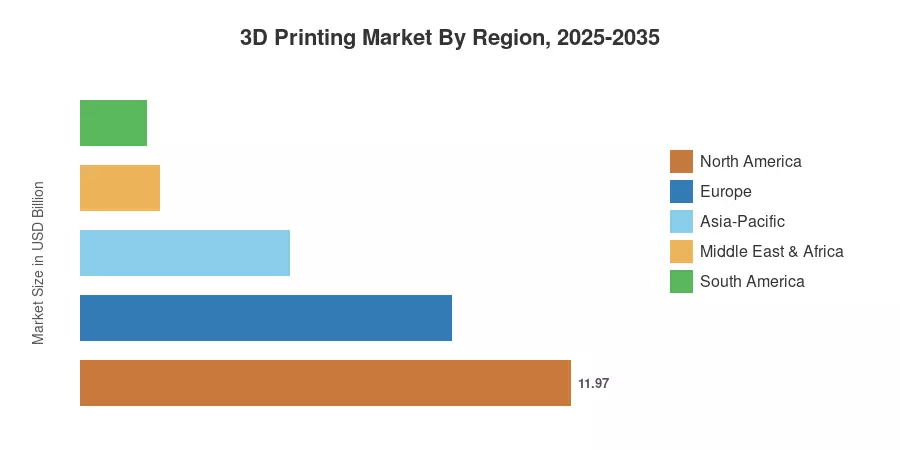
Manufacturing USA institutions and NASA’s in-space manufacturing initiatives lead North America with around 37% of the 3D Printing Market. The Asia-Pacific area is the fastest-expanding region with a predicted 15.8% CAGR driven by China’s “Made in China 2025” subsidies and India’s Production-Linked Incentive program for medical devices. Europe is a close second at about 28%, as Germany’s Fraunhofer network and EU Green Deal digital-manufacturing regulations continue the investment pace over the next decade.


Key Report Takeaways

• By Component

  • Hardware captured roughly 69% of the 3D Printing Market in 2025, reflecting continued capital spending on industrial-grade polymer and metal systems.
  • Services are forecast to post the fastest segment CAGR of 17.5% through 2035 as OEMs outsource post-processing, regulatory documentation, and design optimization.


• By Application

  • Prototyping held a 43.5% revenue share in 2025, though manufacturing and production parts are expanding at a 15.2% CAGR as aerospace programs certify serial-run components.


• By Geography

  • North America led the 3D Printing Market with a 37% share in 2025.
  • Asia-Pacific is anticipated to register a 15.8% CAGR, driven by government subsidies in China, India, and South Korea.

3D Printing Market Size and Forecast (2021–2035)

Market sizing is based on a triangulated approach leveraging top-down revenue analysis of publicly listed additive-manufacturing companies, bottom-up tracking of systems shipments across 42 countries and validated third-party data. Historical figures (2021-2024) are based on audited corporate filings and customs data; projection values (2026-2035) are based on a steady 13.94% CAGR anchored to the 2025 base year.
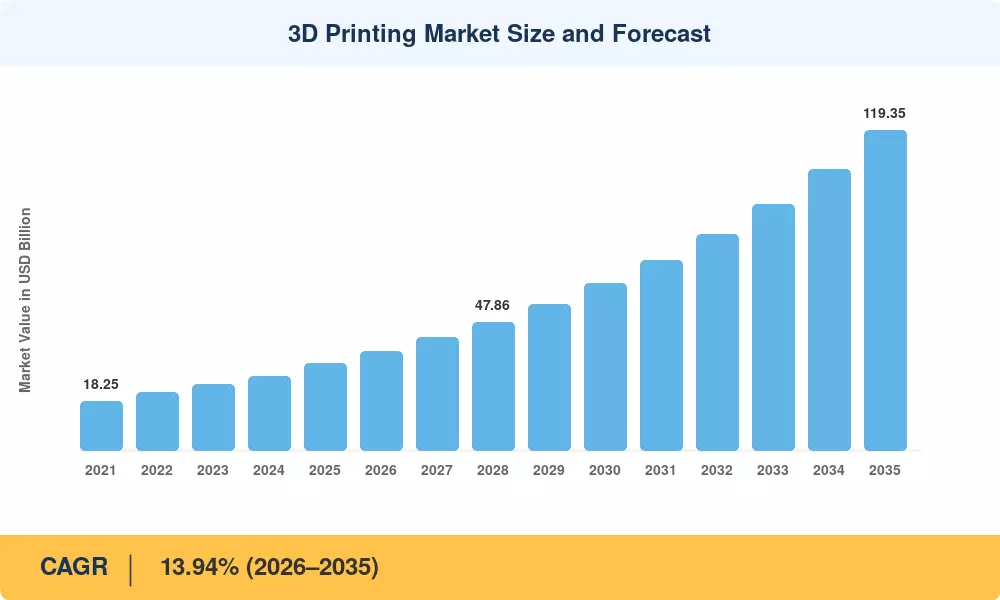
3D Printing Market Size and Forecast
Our Impact
Enabled $4.3B Revenue Impact for Fortune 500 and Leading Multinationals
Partnering with 2000+ Global Organizations Each Year
30K+ Citations by Top-Tier Firms in the Industry

Driver Impact Analysis

Driver ~% Impact on CAGR Geographic Relevance Impact Timeline
Defense & aerospace flight-qualification programs ~2.8 North America, Europe Short-term (≤2 yr)
Automotive lightweighting mandates ~2.3 Global Medium-term (2–4 yr)
Healthcare regulatory fast-tracking for patient-specific implants ~2.0 North America, Europe Medium-term (2–4 yr)
Industrial automation & digital-twin integration ~1.8 Asia-Pacific, Europe Long-term (≥4 yr)
Supply-chain resilience & nearshoring ~1.5 Global Short-term (≤2 yr)
Sustainability & circular-economy material reclamation ~1.2 Europe, Asia-Pacific Long-term (≥4 yr)
Declining powder & resin costs ~1.0 Global Medium-term (2–4 yr)


Defense and Aerospace Qualification Programs

The U.S. Department of Defense and allied branches continue to scale up additive manufacturing for operational readiness, utilizing digital data packages to streamline part onboarding. Concurrently, European defense agencies are expanding qualification frameworks for flight-critical and structural metal components to secure localized supply chains.


Automotive Lightweighting Mandates

Euro 7 emission standards and the U.S. EPA's 2027 tailpipe rules require automakers to cut fleet-average CO₂ by 15%, creating a direct pull for topology-optimized aluminum and polymer components. BMW's Landshut plant now produces over 300,000 additively manufactured parts annually, saving an estimated 42 tonnes of raw material per year compared with die-cast equivalents [7]. General Motors' Ultium platform integrates 3D-printed coolant manifolds that reduced assembly weight by 22% [7].

Healthcare Regulatory Fast-Tracking

Regulatory bodies like the U.S. FDA maintain active expedited review mechanisms (such as the De Novo pathway) to safely clear patient-specific 3D-printed medical devices, including cranial plates, spinal cages, and maxillofacial implants. International regulatory authorities are similarly introducing structured evaluation tracks for advanced Class III medical devices to drive safe clinical adoption.


Supply-Chain Resilience and Nearshoring

Post-pandemic manufacturing strategies have heavily accelerated the integration of distributed 3D printing for industrial applications. Industrial original equipment manufacturers (OEMs) increasingly rely on localized in-house additive cells and digital inventories for rapid spare-part production, effectively mitigating supply-chain bottlenecks and reducing physical warehousing overhead.


Restraints Impact Analysis

Restraint impact percentages are directional and may overlap; they do not subtract linearly from the CAGR.

Restraint ~% Drag on CAGR Geographic Relevance Impact Timeline
High capital cost of industrial metal systems –1.6 Global Short-term (≤2 yr)
Limited build-volume throughput vs. injection molding –1.3 Asia-Pacific Medium-term (2–4 yr)
Workforce skill gaps in design-for-additive –1.0 Global Long-term (≥4 yr)
Inconsistent international certification standards –0.8 Europe, MEA Medium-term (2–4 yr)
Intellectual-property enforcement challenges –0.5 Global Long-term (≥4 yr)


High Capital Cost of Industrial Metal Systems

Entry-level laser powder bed fusion platforms still command USD 400,000–USD 1.2 million, placing them beyond reach for mid-sized job shops. While leasing models and equipment-as-a-service contracts are emerging, a 2024 ASTM survey showed that 58% of prospective buyers cited upfront cost as the primary barrier to adoption [13].

Throughput Limitations Relative to Conventional Manufacturing

Even the fastest multi-laser systems produce metal parts at roughly 100–200 cm³/hr, orders of magnitude below die-casting or injection-molding cycle times. For consumer-electronics housings and high-run automotive brackets, this gap keeps the 3D Printing Market confined to low-to-mid volume applications unless binder-jetting economics improve [14].

Design-for-Additive Skill Gaps

A 2024 study estimated that the global additive-manufacturing workforce gap exceeds 35,000 engineers trained in topology optimization, lattice design, and build-orientation strategy. Universities are scaling curricula, but the lag between enrollment and employability constrains near-term throughput growth [15].


3D Printing Market Opportunities

Distributed Digital Spare-Parts Networks

Defense ministries and energy utilities are piloting "digital warehouse" programs that store part files rather than physical inventory. The U.S. Navy's NAVSEA digital-twin library already holds 2,400 certified part files, with plans to reach 10,000 by 2028, opening a recurring-revenue stream for the 3D Printing Market[1].

Construction-Scale Additive Manufacturing

Large-format concrete and polymer extrusion systems are delivering affordable housing in the Middle East and Latin America. Saudi Arabia's NEOM project specified additively manufactured modular structures for 15% of its Phase-1 residential units, a contract valued at USD 380 million that signals mainstream construction uptake[18].

Point-of-Care Medical Device Fabrication

Hospital-based print labs that produce surgical guides, custom implants, and anatomical models within 24 hours are expanding beyond flagship academic centers. Over 200 U.S. hospitals operated in-house additive cells by end-2024, and CMS reimbursement codes introduced in 2025 for patient-specific guides are expected to accelerate adoption[8].

Data-Driven Print-as-a-Service Platforms

Cloud-based platforms that match design files to certified print bureaus worldwide are creating an "Uber for manufacturing" model. Revenue from platform-mediated print services grew 34% year-over-year in 2024 to reach USD 1.9 billion, offering small and medium enterprises access without capital investment[19].

Emerging-Market Growth in India and Southeast Asia

India's PLI scheme for medical devices, combined with ASEAN tariff harmonization for additive equipment, positions emerging Asia as the next high-growth corridor. India's domestic 3D Printing Market is projected to exceed USD 2.8 billion by 2030[20].


3D Printing Market Future Outlook

AI-Driven Process Optimization

Machine-learning algorithms that predict melt-pool instabilities in real time are cutting scrap rates on metal powder bed fusion systems by up to 30%. By 2030, closed-loop AI controllers are expected to be standard on tier-one industrial platforms, enabling lights-out production that compresses cost-per-part toward injection-molding parity for batches under 10,000 units [9].

Multi-Material and Hybrid Manufacturing

Next-generation systems that deposit metal, polymer, and ceramic feedstocks in a single build are transitioning from lab prototypes to commercial platforms. These hybrid cells will unlock applications in aerospace thermal-management assemblies and biomedical implants with graded porosity, opening an estimated USD 8 billion addressable market by 2032 [3].

Sustainability and Circular-Economy Integration

Life-cycle assessments show that additive manufacturing can reduce buy-to-fly ratios from 15:1 (CNC machining of titanium) to under 2:1. The EU's Corporate Sustainability Reporting Directive is expected to drive OEMs toward processes with lower material waste, positioning the 3D Printing Market as a compliance enabler rather than merely a cost tool [11].

Decentralized Manufacturing Networks

Digital inventories and blockchain-secured part files will enable a shift from centralized factories to regional micro-factories. The IEA projects that decentralized additive networks could reduce logistics-related CO₂ emissions by 12% in heavy industry by 2035, a figure that aligns with defense and energy sectors' supply-chain resilience mandates [10].


3D Printing Market Segmentation

By Component

Segment Metric Primary Demand Driver
Hardware 69% share (2025) Capital investment in metal and polymer systems
Software 14.8% CAGR Build preparation, simulation, and AI-driven nesting
Services 17.5% CAGR Post-processing, certification, and design outsourcing


Hardware dominates the 3D Printing Market because industrial-grade metal and polymer systems still represent the single largest line item in any production-additive budget. Laser powder bed fusion platforms from EOS, SLM Solutions, and Trumpf routinely exceed USD 700,000 per unit, and multi-laser configurations push above USD 1.5 Million. Services, by contrast, represent the fastest-expanding segment as OEMs outsource heat-treatment, HIP processing, and regulatory documentation to specialized bureaus.

By Technology

Segment Metric Primary Demand Driver
Powder Bed Fusion 41.2% share (2025) Aerospace and medical-grade metal parts
Vat Photopolymerization USD 4.85 billion (2025) Dental aligners, jewelry casting patterns
Material Extrusion 18% share (2025) Rapid prototyping, tooling jigs and fixtures
Binder Jetting 16.4% CAGR High-volume automotive sand cores and metal parts
Other Technologies USD 2.10 billion (2025) DED, sheet lamination, material jetting


Powder bed fusion anchors the 3D Printing Market's technology landscape, delivering the dense, isotropic microstructures required for flight-critical turbine blades and load-bearing orthopedic implants. Binder jetting, meanwhile, is gaining traction in automotive contracts where geometric complexity is moderate and throughput requirements are high, with Volkswagen and BMW qualifying sand-core and stainless-steel production lines.

By Material

Segment Metric Primary Demand Driver
Polymers 48% share (2025) Prototyping, consumer goods, dental
Metals & Alloys 15.5% CAGR Aerospace titanium, automotive aluminum
Ceramics & Others USD 1.78 billion (2025) Electronics substrates, biomedical scaffolds


Polymer feedstocks still command the largest share of the 3D Printing Market by material, spanning nylon, ABS, photopolymer resins, and high-performance PEEK. Metals and alloys, however, are growing fastest as aerospace OEMs certify titanium Ti-6Al-4V, Inconel 718, and aluminum AlSi10Mg powders for serial production.

By Application

Segment Metric Primary Demand Driver
Prototyping 43.5% share (2025) Design-iteration speed across all verticals
Manufacturing / Production Parts 15.2% CAGR Aerospace, automotive, and medical serial runs
Tooling, Jigs & Fixtures USD 3.56 billion (2025) Assembly-line optimization


By End-User Industry

Segment Metric Primary Demand Driver
Aerospace & Defense USD 7.12 billion (2025) Flight qualification, weight reduction
Automotive 15.8% CAGR Lightweighting, EV thermal management
Healthcare 16.3% CAGR Patient-specific implants, surgical guides
Consumer Goods & Electronics 11% share (2025) Customization, rapid product iteration
Education & Research 12.4% CAGR Desktop system proliferation


Regional Market Share Analysis

Region Metric Primary Investment Themes
North America 37% share (2025) Defense qualification, aerospace OEM integration
Europe 28% share (2025) Automotive lightweighting, Horizon Europe R&D
Asia-Pacific 15.8% CAGR (2026–2035) Government subsidies, medical-device PLI
South America USD 1.62 billion (2025) Dental prosthetics, oil & gas tooling
Middle East & Africa USD 1.94 billion (2025) Construction-scale printing, defense modernization
Total USD 32.35 billion (2025)


North America

Country Metric Key Driver
United States 78% of regional share DoD qualification programs, NASA in-space manufacturing
Canada 12.8% CAGR Aerospace cluster in Montréal, NRC additive R&D
Mexico USD 0.68 billion (2025) Automotive nearshoring, maquiladora adoption


The United States anchors the 3D Printing Market in this region through a combination of federal funding, venture capital, and deep OEM integration. America Makes, the national additive-manufacturing institute, has funded over 150 collaborative R&D projects since inception, channeling USD 290 million in public-private investment toward process standardization and workforce training [1].

Europe

Country Metric Key Driver
Germany 32% of regional share Fraunhofer IAPT, automotive OEM adoption
United Kingdom 13.6% CAGR Aerospace MRO, NHS point-of-care programs
France USD 1.38 billion (2025) DGA defense contracts, luxury-goods customization
Italy 9% of regional share Dental and jewelry manufacturing
Spain 11.4% CAGR Automotive supplier integration
Nordic Countries USD 0.72 billion (2025) Sustainable manufacturing initiatives
Russia 4% of regional share Import-substitution programs
Rest of Europe 12.2% CAGR Eastern European contract-manufacturing growth


Germany's industrial ecosystem positions it as Europe's 3D Printing Market leader, with EOS, SLM Solutions (Nikon), and Trumpf headquartered in-country. The Fraunhofer IAPT institute in Hamburg operates one of the world's largest multi-technology additive research floors, certifying processes for Airbus and Volkswagen supply chains [2].

Asia-Pacific

Country Metric Key Driver
China 42% of regional share Made in China 2025 subsidies, Farsoon & BLT expansion
India 17.3% CAGR PLI medical devices, defense indigenization
Japan USD 1.45 billion (2025) Electronics miniaturization, dental
South Korea 14.6% CAGR Semiconductor tooling, Hyundai-Kia integration
ASEAN USD 0.58 billion (2025) Contract manufacturing, dental prosthetics
Rest of Asia-Pacific 13.8% CAGR Emerging industrial bases


China dominates the Asia-Pacific 3D Printing Market through a dual strategy of domestic system development and aggressive industrial subsidies. Beijing's 14th Five-Year Plan designated additive manufacturing as a "strategic emerging industry," directing CNY 8.5 billion toward metal-system scale-up, powder atomization, and satellite constellation component printing [20].

South America

Country Metric Key Driver
Brazil 58% of regional share Embraer aerospace, dental labs
Argentina 12.5% CAGR University research, medical-device prototyping
Rest of South America USD 0.28 billion (2025) Oil & gas tooling


Brazil leads South America's 3D Printing Market, with Embraer integrating additive components into regional-jet interiors and Petrobras piloting on-platform spare-part printing for offshore rigs [21].

Middle East & Africa

Country Metric Key Driver
Saudi Arabia 34% of regional share NEOM construction, Vision 2030 industrialization
UAE 15.6% CAGR Dubai 3D Printing Strategy, aerospace MRO
South Africa USD 0.31 billion (2025) Mining tooling, medical implants
Egypt 13.2% CAGR Healthcare and dental manufacturing
Rest of MEA USD 0.24 billion (2025) Oil & gas, defense modernization


The UAE's Dubai 3D Printing Strategy mandates that 25% of new buildings incorporate additively manufactured structural elements by 2030, a policy that has already attracted Apis Cor and COBOD to establish regional production facilities [18].


3D Printing Market By Region, 2025-2035

Competitive Benchmarking

The 3D Printing Market is somewhat consolidated with an HHI of ~650 and top five players accounting for 38-44% of the revenue share. Legacy hardware OEMs are competing furiously to incorporate software platforms, while service bureaus are building multi-technology fleets.

Company Est. Revenue Share Range Key Offerings Strategic Positioning
3D Systems ~6–9% SLA, SLS, DMP metal systems, regenerative medicine Integrated hardware-software-services verticals
Stratasys ~6–8% FDM, PolyJet, SAF polymer systems Polymer production and prototyping leadership
HP Inc. ~5–7% Multi Jet Fusion polymer, Metal Jet binder jetting High-throughput industrial polymer and metal
EOS ~5–7% DMLS metal and SLS polymer systems Premium aerospace and medical certification
GE Aerospace (Additive) ~4–6% EBM, DMLM metal systems, Arcam & Concept Laser Vertically integrated aerospace OEM
Desktop Metal ~3–5% Binder jetting, bound-metal FFF High-volume, cost-competitive metal parts
Carbon ~3–4% DLS continuous resin printing Subscription model, dental and consumer
Materialise ~3–4% Software suite, medical and industrial services Software-and-services platform
Renishaw ~2–4% Metal PBF systems, metrology integration Precision engineering and process control
Markforged ~2–3% Continuous fiber and metal FFF Distributed manufacturing, Digital Forge cloud


Recent News & Developments

  • 3D Systems (April 2024): In April 2024, 3D Systems received FDA 510(k) clearance for its VSP PEEK cranial implant workflow utilizing its EXT 220 MED 3D printer.
  • HP Inc. (September 2022): HP commercially launched the modular Metal Jet S100 production platform in September 2022 at the International Manufacturing Technology Show (IMTS)
  • Stratasys (April 2024): Stratasys completed the acquisition of Covestro's additive manufacturing materials business for roughly EUR 43 million in April 2023 (announced August 2022).


3D Printing Market Report Scope

Parameter Detail
Market Scope Global 3D Printing Market by Component, Printer Type, Technology, Material, Application, End-User Industry, and Region
Study Period 2021–2035
CAGR 13.94% (2026–2035)
Base Year Size USD 32.35 billion (2025)
Forecast Endpoint USD 119.35 billion (2035)
Fastest Growing Segment Services (by Component); Healthcare (by End User)
Companies Profiled 10 (see Section 10)
Valuation Currency USD billion

FAQs

What print volume threshold makes in-house metal additive manufacturing cost-effective versus outsourcing?
Most manufacturers reach break-even on a laser PBF system at roughly 800–1,200 parts per year, assuming an average part mass of 200 g. Below that threshold, service bureaus typically deliver lower total cost of ownership.
How does binder jetting compare with laser powder bed fusion for automotive production runs?
Binder jetting offers 5–10× higher throughput and lower per-part cost at moderate geometric complexity. Laser PBF remains superior for high-density, fatigue-critical components requiring full ASTM F3301 certification.
Which cybersecurity standards apply to digital part files shared across additive supply chains?
NIST SP 800-171 and CMMC Level 2 govern controlled unclassified information in U.S. defense additive programs. Commercial supply chains increasingly adopt ISO/IEC 27001 for file-integrity assurance [17].
What recycling pathways exist for spent metal powder in the 3D Printing Market?
Unused powder is typically sieved and blended with virgin stock up to 8–12 reuse cycles. Fully degraded powder can be re-atomized or sold to conventional powder-metallurgy processors.
How are insurance underwriters assessing liability for safety-critical 3D-printed parts?
Underwriters now require full digital-thread traceability — build logs, in-situ monitoring data, and post-process CT scans — before issuing product-liability coverage for Class III medical or aerospace components [8].
What role does topology optimization software play in reducing material consumption?
Topology-optimization algorithms routinely cut part mass by 30–50% while maintaining structural targets. This reduces powder consumption and shortens build times, directly improving unit economics.
Are there trade-restriction risks for exporting high-end metal 3D printing systems?
Yes. The Wassenaar Arrangement classifies certain multi-laser metal systems above 200 W as dual-use items, requiring export licenses for shipments to restricted jurisdictions [17].    
Author
Author
Author Profile
Nirmit Biswas LinkedIn
Senior Research Analyst
With 5+ years of expertise in Market Intelligence and Strategic Research, Nirmit Biswas specializes in ICT, Semiconductors, and BFSI. Backed by an MBA in Financial Services and a Computer Science foundation, Nirmit blends technical depth with business acumen. He has successfully led 100+ projects for global enterprises and startups, including Amazon, Cisco, L&T and Huawei, delivering market estimations, competitive benchmarking, and GTM strategies. His focus lies in transforming complex data into clear, actionable insights that drive growth, innovation, and investment decisions. Recognized for bridging engineering innovation with executive strategy, Nirmit helps businesses navigate dynamic markets with confidence.
Co-Author
Co-Author Profile
Aarti Dhapte LinkedIn
AVP - Research
A consulting professional focused on helping businesses navigate complex markets through structured research and strategic insights. I partner with clients to solve high-impact business problems across market entry strategy, competitive intelligence, and opportunity assessment. Over the course of my experience, I have led and contributed to 100+ market research and consulting engagements, delivering insights across multiple industries and geographies, and supporting strategic decisions linked to $500M+ market opportunities. My core expertise lies in building robust market sizing, forecasting, and commercial models (top-down and bottom-up), alongside deep-dive competitive and industry analysis. I have played a key role in shaping go-to-market strategies, investment cases, and growth roadmaps, enabling clients to make confident, data-backed decisions in dynamic markets.
Share::
Request Free Sample

Research Approach


Secondary Research

The secondary research process involved a comprehensive analysis of regulatory databases, peer-reviewed engineering journals, industry publications, and authoritative technology organizations. Key sources included the US National Institute of Standards and Technology (NIST), European Committee for Standardization (CEN), International Organization for Standardization (ISO), ASTM International, Society of Manufacturing Engineers (SME), Additive Manufacturing Users Group (AMUG), America Makes (National Additive Manufacturing Innovation Institute), European Association of the Machine Tool Industries (CECIMO), US Bureau of Labor Statistics, OECD Manufacturing Statistics, World Intellectual Property Organization (WIPO) Patent Database, US Patent and Trademark Office (USPTO), EU Eurostat Industrial Production Database, National Institutes of Standards and Technology (NIST) Additive Manufacturing Laboratory, NASA Technical Reports Server, IEEE Xplore Digital Library, ScienceDirect (Elsevier), and national technology ministry reports from key manufacturing markets.

For Stereolithography (SLA), Fused Deposition Modeling (FDM), Selective Laser Sintering (SLS), Direct Metal Laser Sintering (DMLS), hardware systems, software platforms, polymer/metal/ceramic materials, and industrial vs. desktop printing applications, adoption statistics, regulatory framework data, materials science studies, technology trend analysis, and market landscape assessment were gathered from these sources.


Primary Research

In order to gather both qualitative and quantitative insights, supply-side and demand-side stakeholders were interviewed during the primary research process. CEOs, VPs of Product Development, heads of regulatory affairs, and commercial directors from manufacturers of 3D printers, suppliers of materials, and software developers were examples of supply-side sources. Chief manufacturing officers, engineering directors, R&D chiefs, procurement leads from defense and aerospace contractors, automakers, medical device manufacturers, industrial design firms, and educational institutions using additive manufacturing were among the demand-side sources. In addition to gathering information on supply chain dynamics, pricing tactics, and industry adoption patterns, primary research verified technology roadmap dates and validated market segmentation.

By Designation C-level Primaries (28%), Director Level (32%), Others (40%)

By Region North America (32%), Europe (30%), Asia-Pacific (28%), Rest of World (10%)


Market Size Estimation

Unit shipment analysis and revenue mapping were used to get the global market valuation. The methodology comprised:

Finding more than fifty important manufacturers in North America, Europe, Asia-Pacific, and Latin America

Product mapping for materials (polymer, metal, ceramic), services (consulting, maintenance, training), software (design, printer management, scanning), and hardware (desktop and industrial printers)

Stereolithography (SLA), Fused Deposition Modeling (FDM), Direct Metal Laser Sintering (DMLS), Selective Laser Sintering (SLS), and upcoming technologies are all included in this technology division.

Examination of reported and projected yearly income for portfolios related to additive manufacturing

Coverage of producers accounting for 75–80% of the world market in 2024

Extrapolating segment-specific valuations utilizing top-down (manufacturer revenue validation) and bottom-up (unit shipments × ASP by country/vertical) methods

Share::
Request Free Sample
Download Free Sample

Kindly complete the form below to receive a free sample of this Report

* Please use a valid business email

Share::
Request Free Sample
Download PDF ×

We do not share your information with anyone. However, we may send you emails based on your report interest from time to time. You may contact us at any time to opt-out.

















