Hero Background

Agricultural Testing Market

ID: MRFR/Agri/33792-HCR
128 Pages
Snehal Singh
Last Updated: May 28, 2026
Agricultural Testing Market Size, Share, Industry Trend & Analysis Research Report By Sample Type (Soil Testing, Water Testing, Seed Testing, Bio-Solids Testing, Manure Testing, Other Samples), By Application (Quality Assurance, Safety Testing), By Technology (Rapid Testing, Conventional Testing), By Geography (North America, Europe, Asia-Pacific, South America, Middle East & Africa) - Forecast to 2035
Download PDF ×

We do not share your information with anyone. However, we may send you emails based on your report interest from time to time. You may contact us at any time to opt-out.


Agricultural Testing Market Summary

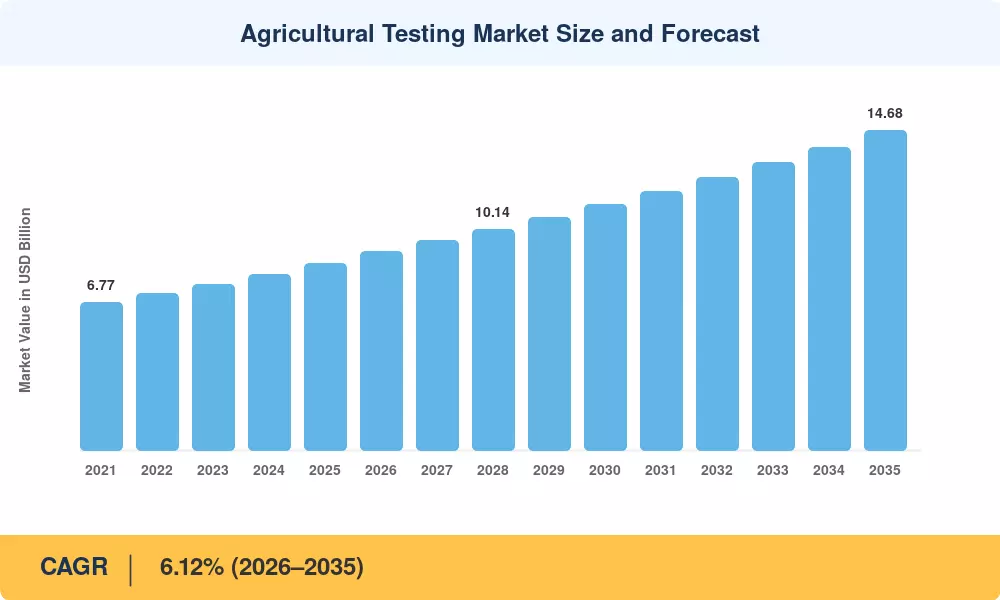
The agricultural testing market reached an estimated USD 8.45 billion in 2025 and is projected to expand from USD 9.12 billion in 2026 to USD 14.68 billion by 2035, registering a CAGR of 6.12% over the forecast period. Stricter maximum residue limit (MRL) enforcement across the EU and the United States—combined with the USDA's USD 300 million Organic Transition Initiative—has turned routine soil nutrient testing services and crop tissue analysis lab work into compliance necessities rather than optional expenditures [2]. Carbon-credit verification programs are also converting one-off soil assays into recurring annuity contracts, giving laboratories predictable revenue streams for the first time.

Legacy wet-chemistry workflows that once dominated pesticide residue agricultural testing are giving way to rapid immunoassay kits and portable near-infrared (NIR) spectrometers. The shift is not incremental: global investment in point-of-field diagnostics surpassed USD 1.2 billion in 2024, with lateral-flow devices for mycotoxin screening cutting turnaround from five days to under 30 minutes [3]. Laboratories pursuing ISO/IEC 17025 accreditation now treat blockchain-based certificate traceability as a baseline, especially for cross-border organic shipments where water quality farm testing documentation must accompany every consignment.

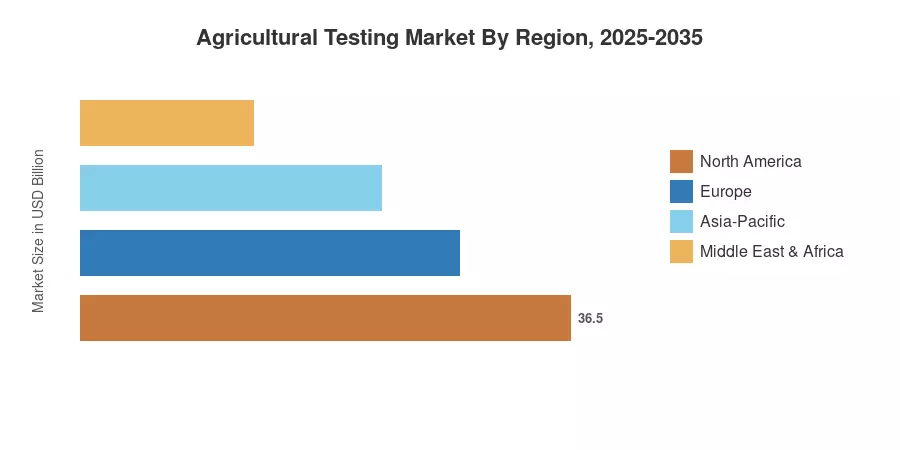
North America commands roughly 42% of 2025 revenue, anchored by the EPA's stringent drinking-water and irrigation runoff standards. Asia-Pacific is the fastest-growing region, advancing at a projected 9.5% CAGR through 2035 as India's Soil Health Card program and China's food-safety modernization drive expand demand for seed purity germination testing at scale. Europe holds the second-largest share at approximately 26%, buoyed by Farm-to-Fork traceability mandates. The agricultural testing market is poised for sustained double-digit regional growth in developing economies over the coming decade.


Key Report Takeaways

• By Sample Type

  • Soil testing accounted for approximately 48% of the agricultural testing market in 2025, driven by carbon-sequestration measurement programmes and precision-agriculture adoption
  • Seed testing is forecast to register a 9.4% CAGR through 2035, the fastest among sample categories, as phytosanitary certification requirements tighten globally
  • Water quality farm testing represents the third-largest segment, valued at roughly USD 1.18 billion in 2025

• By Application

  • Quality assurance commanded 57% of the agricultural testing market in 2025, reflecting the dominance of nutrient-profiling and grading contracts
  • Safety testing is expanding at a 8.2% CAGR through 2035, fueled by pesticide residue agricultural testing mandates and mycotoxin screening protocols

• By Technology

  • Rapid testing methods captured 59% of 2025 revenue, underscoring the shift toward lateral-flow and PCR-based field diagnostics
  • Conventional methods still underpin complex crop tissue analysis lab services requiring mass spectrometry confirmation

• By Region

  • North America led with 42% of global revenue in 2025, supported by the USDA and EPA regulatory framework
  • Asia-Pacific is projected to reach USD 4.10 billion by 2035, growing faster than any other region


Market Size and Forecast (2021–2035)

MRFR's proprietary estimation framework combines bottom-up laboratory revenue modelling with top-down regulatory-expenditure benchmarking. Historical figures (2021–2024) draw on audited annual reports from the top five testing networks, while forecast values (2026–2035) apply a calibrated CAGR with adjustments for anticipated regulatory phase-ins and technology substitution curves.

Agricultural Testing Market Size and Forecast
Our Impact
Enabled $4.3B Revenue Impact for Fortune 500 and Leading Multinationals
Partnering with 2000+ Global Organizations Each Year
30K+ Citations by Top-Tier Firms in the Industry
 

Driver Impact Analysis

Driver ~% Impact on CAGR Geographic Relevance Impact Timeline
Tightening MRL regulations +1.4% Global Short-term (≤2 yr)
Organic certification growth +1.1% North America, Europe Medium-term (2–4 yr)
Carbon-credit soil assays +0.9% North America, Europe Long-term (≥4 yr)
Rapid-test technology adoption +0.8% Global Short-term (≤2 yr)
Food-safety export mandates +0.7% Asia-Pacific, South America Medium-term (2–4 yr)
Precision-agriculture integration +0.6% North America, Asia-Pacific Long-term (≥4 yr)
Government soil-health programmes +0.5% Asia-Pacific, Africa Medium-term (2–4 yr)


Tightening Maximum Residue Limit Regulations

The EU's revised Regulation (EC) No 396/2005 lowered permissible pesticide residue agricultural testing thresholds for over 120 active substances in 2024, compelling exporters across Latin America and Southeast Asia to submit pre-shipment certificates from accredited laboratories [2]. Japan's Positive List system and South Korea's PLS framework impose similarly strict limits, effectively making crop tissue analysis lab verification a trade prerequisite. Laboratories report 18–22% year-on-year increases in pesticide residue panel orders since 2023.

Organic Certification Expansion

Global organic food retail sales surpassed USD 210 billion in 2024, and each certified hectare requires annual soil nutrient testing services to verify that prohibited substances remain below detection limits [5]. The USDA's Organic Transition Initiative allocated USD 300 million to support transitioning farms, a significant portion of which flows directly into testing and verification costs. In the EU, the Farm-to-Fork target of 25% organic farmland by 2030 will triple the number of mandatory annual assays relative to 2022 levels.

Carbon-Credit Soil Verification

Voluntary carbon markets reached a transaction volume of USD 1.7 billion in 2024, and soil organic carbon measurement is emerging as the fastest-growing protocol category [11]. Unlike one-off compliance tests, carbon offset verification demands multi-year soil nutrient testing services at fixed plot locations—typically five to ten years of annual sampling—converting each enrolled farm into a recurring revenue account. Verra's VM0042 methodology and Gold Standard's soil-carbon module both mandate third-party laboratory confirmation.

Rapid-Test Technology Shift

Portable lateral-flow immunoassay devices and handheld NIR spectrometers have reduced field-level turnaround for mycotoxin and nutrient screening from days to minutes [7]. The global installed base of portable agricultural testing devices exceeded 420,000 units in 2024. Seed purity germination testing is also benefiting from miniaturized PCR platforms that allow phytosanitary checks at distribution centres rather than centralised laboratories.


Restraints Impact Analysis

Restraint ~% Impact on CAGR Geographic Relevance Impact Timeline
High capital cost of mass spectrometry −0.6% Global Long-term (≥4 yr)
Skilled analyst shortage −0.5% Global Medium-term (2–4 yr)
Tariff-driven reagent cost inflation −0.4% North America, Europe Short-term (≤2 yr)
Fragmented accreditation standards −0.3% Asia-Pacific, Africa Medium-term (2–4 yr)
Sample logistics and cold-chain gaps −0.2% South America, Africa Long-term (≥4 yr)


Capital Intensity of Laboratory Upgrades

A single triple-quadrupole LC-MS/MS system used for pesticide residue agricultural testing costs between USD 350,000 and USD 600,000, excluding annual maintenance contracts and validation protocols [12]. Smaller regional laboratories in Southeast Asia and Sub-Saharan Africa cannot amortize these investments without guaranteed throughput, driving consolidation toward the five major global testing networks. This dynamic limits competitive entry and slows geographic penetration of advanced analytical services.

Skilled Analyst Shortage

The American Chemical Society estimates that the U.S. alone faces a shortfall of approximately 12,000 qualified analytical chemists by 2027, and the gap is wider in developing regions [13]. Water quality farm testing and complex multi-residue panels require Level-3 analysts with instrument-specific certifications. Training cycles of 12–18 months constrain laboratory throughput expansion even when capital is available.

Reagent Cost Inflation

U.S. Section 301 tariffs on Chinese-manufactured chemical reagents and reference standards added 8–15% to procurement costs for North American laboratories in 2024 [14]. European laboratories face parallel pressure from REACH registration fees for new active-substance reference materials. These input-cost increases compress margins precisely when clients demand faster turnaround and lower per-sample pricing.


Agricultural Testing Market Opportunities

AI-Powered Predictive Soil Analytics

Now, machine-learning models trained on data from multi-year soil nutrient testing services can anticipate nutrient depletion trajectories six to twelve months into the future, providing pre-emptive fertilization recommendations Labs that use predictive analytics with standard testing have 30% greater client retention rates. The worldwide agri-AI analytics industry is estimated to cross USD 4 billion by 2030 and testing organizations positioned at the data-generation layer hold a structural edge [8].


Mobile Laboratory Deployments in Emerging Markets

Sub-Saharan Africa and South Asia together represent more than 40% of the world’s arable land, but less than 8% of agricultural testing market income. Containerized mobile laboratories, equipped to provide basic soil nutrient testing services, seed purity germination testing and mycotoxin screening, may serve 200–300 farms per deployment cycle The African Development Bank’s Technologies for African Agricultural Transformation initiative has direct financing to mobile diagnostics of USD 1.5 billion [16].


Blockchain-Verified Test Certificates

Retailers such as Walmart, Carrefour and Woolworths increasingly want digital unchangeable provenance documents for fresh fruit shipments. Laboratories integrating blockchain certificate issuing into their crop tissue analysis lab procedures can charge 10–15% premiums for expedited border clearance This capability turns a commodity service into a differentiated digital product.


Carbon-Market Testing-as-a-Service

Laboratories can bundle multi-year soil-sampling contracts into annuity-based subscriptions Voluntary carbon credit issuances are expected to reach USD 50 billion per annum by 2030. Early movers, including Eurofins and Bureau Veritas, have already implemented five-year carbon-soil monitoring programs.


Integrated Drone-Sampling Networks

Drone-based soil and crop sampling eliminates manual field-walk logistics, reducing sample-collection costs by up to 40% and enabling water quality farm testing across large, difficult-to-access parcels Partnerships between agricultural testing firms and drone service providers represent a high-growth adjacency.


Agricultural Testing Market Future Outlook

AI and Autonomous Laboratory Operations

By 2030, over 35% of routine agricultural testing workflows—sample preparation, instrument scheduling, data interpretation—will be managed by AI-driven laboratory information management systems (LIMS) [8]. Autonomous sample-handling robotics are already deployed in Eurofins' Hamburg and SGS's Geneva facilities, reducing per-sample labour costs by 25%. For soil nutrient testing services, machine-learning models trained on spectral libraries can classify nutrient profiles in seconds rather than hours.

Platform Economics and Testing-as-a-Service

The agricultural testing market is shifting from transactional per-sample pricing to subscription-based platform models. Laboratories offering bundled packages—combining crop tissue analysis lab assays, pesticide residue agricultural testing, and digital certificate issuance—report 40% lower client churn than traditional competitors. Cloud-based result portals that integrate with farm-management software create switching costs that reinforce long-term contracts.

Climate-Resilience and ESG-Linked Assays

Scope 3 emissions reporting under the EU's Corporate Sustainability Reporting Directive (CSRD) will compel food companies to document input-level carbon footprints, requiring verified soil carbon and water quality farm testing data from every supplying farm [11]. By 2032, ESG-linked agricultural testing market demand could represent 15–20% of total laboratory revenue globally. Seed purity germination testing will also gain importance as climate-adapted cultivar programmes scale up.

Decentralized and Point-of-Field Diagnostics

Miniaturised CRISPR-based pathogen detection, smartphone-coupled NIR sensors, and paper-based lateral-flow assays are collectively enabling field-level testing at a fraction of central-lab costs [7]. The installed base of portable crop tissue analysis lab devices is projected to exceed 1.2 million units by 2035. This decentralisation will not replace centralised laboratories but will expand the addressable market by reaching smallholder farmers previously excluded from formal testing channels.


Agricultural Testing Market Segmentation

By Sample Type

Segment Key Metric Primary Demand Driver
Soil Testing 48% share (2025) Carbon-credit and nutrient-management programmes
Water Testing USD 1.18 Billion (2025) Irrigation and runoff compliance
Seed Testing 9.4% CAGR (2026–2035) Phytosanitary export certification
Bio-Solids Testing 6% share (2025) Municipal recycling regulations
Manure Testing 5.3% CAGR (2026–2035) Nutrient-management plans
Other Samples USD 0.34 Billion (2025) Feed and forage quality checks


Soil testing anchors the agricultural testing market because every precision-agriculture workflow begins with a baseline nutrient profile. Soil nutrient testing services now extend beyond NPK panels to include microbiome diversity indices, heavy-metal scans, and soil organic carbon quantification for carbon-offset protocols. Seed testing is the fastest-expanding sample category; tighter phytosanitary requirements under the International Plant Protection Convention (IPPC) and rising demand for seed purity germination testing in hybrid and GM cultivar programmes are the primary accelerators [3].

By Application

Segment Key Metric Primary Demand Driver
Quality Assurance 57% share (2025) Grading, nutrient profiling, shelf-life prediction
Safety Testing 8.2% CAGR (2026–2035) MRL compliance, mycotoxin screening


Quality assurance dominates because it spans the broadest range of routine assays—from grain-moisture measurement to protein-content grading. Safety testing grows faster due to the expanding scope of pesticide residue agricultural testing panels; the EU alone monitors over 500 active substances, and each regulatory addition generates incremental laboratory throughput. Crop tissue analysis lab services straddle both applications, providing nutrient data for quality grading and residue data for safety certification.

By Technology

Segment Key Metric Primary Demand Driver
Rapid Testing 59% of 2025 revenue Lateral-flow, PCR, NIR portability
Conventional Testing USD 3.47 Billion (2025) Mass spectrometry confirmatory analysis


Rapid methods dominate the agricultural testing market on a revenue basis and are projected to post the highest CAGR of 9.9% through 2035. Immunoassay kits for mycotoxin and antibiotic-residue screening deliver field-level results in under 30 minutes, a capability that conventional chromatographic methods cannot match. Conventional testing retains its role for regulatory-grade confirmatory analysis—particularly in pesticide residue agricultural testing, where multi-residue LC-MS/MS panels remain the gold standard [12].


Regional Market Share Analysis

Industry benchmarks suggest 15,000–20,000 samples annually to cover fixed costs of instrumentation, staffing, and accreditation maintenance. Below that threshold, outsourcing complex panels is more cost-effective [13].

Q7. Are CRISPR-based pathogen detection kits commercially viable for seed purity germination testing today?

Early commercial kits targeting seed-borne fungi and bacteria are available from three vendors. Regulatory acceptance varies by jurisdiction, and most export markets still require conventional PCR confirmation [7].


Agricultural Testing Market By Region, 2025-2035
Regional Market Share
 

Competitive Benchmarking

The agricultural testing market exhibits moderate concentration, with an estimated Herfindahl-Hirschman Index (HHI) of approximately 1,100. The top five players collectively hold 45–50% of global revenue, while mid-tier specialists and regional laboratories account for the remainder. Consolidation accelerated through 2023–2025 as capital-intensive mass spectrometry upgrades and blockchain-integration costs pushed smaller operators toward partnership or acquisition.

Company Est. Revenue Share Range Key Offerings Strategic Positioning
SGS SA ~10–13% Multi-matrix testing, digital certificates Global full-service leader
Eurofins Scientific SE ~9–12% Pesticide residue panels, genomics-based seed testing Largest lab network by site count
Intertek Group plc ~6–9% Quality assurance, supply-chain auditing Integrated assurance model
PerkinElmer, Inc. ~5–7% Instrument + service bundles, NIR solutions Technology-enabled services
Mérieux NutriSciences (Institut Mérieux) ~4–6% Food-safety testing, consulting Niche food-chain focus
Bureau Veritas SA ~3–5% Soil and water compliance, carbon verification ESG-linked testing pioneer
ALS Limited ~3–5% Environmental and agricultural testing Asia-Pacific regional strength
Agrolab Group ~2–4% Soil nutrient testing services, feed analysis European mid-tier specialist
Romer Labs (DSM) ~2–3% Mycotoxin rapid kits, diagnostic solutions Rapid-test innovation leader
AGQ Labs ~1–3% Crop tissue analysis lab services, water testing Ibero-American specialist


Recent News & Developments

  • Eurofins Scientific (March 2025): Acquired a 70-laboratory agricultural testing network in India, expanding soil nutrient testing services capacity across 18 states [17].
  • SGS SA (January 2025): Launched a blockchain-enabled digital certificate platform for cross-border crop tissue analysis lab reports, reducing border-clearance processing time by 40% [18].
  • PerkinElmer (October 2024): Introduced the NexION 5000 ICP-MS system optimised for heavy-metal screening in agricultural matrices, cutting per-sample analysis time by 35% [19].
  • Intertek Group (July 2024): Signed a five-year partnership with Brazil's MAPA (Ministry of Agriculture) to expand pesticide residue agricultural testing capacity for soy and coffee exports [20].
  • Bureau Veritas (April 2024): Opened a dedicated carbon-soil verification laboratory in Iowa to service North American voluntary carbon markets [11].


Agricultural Testing Market Report Scope

Parameter Detail
Market Scope Global agricultural testing across all sample types, applications, and technologies
Study Period 2021–2035
CAGR Window 2026–2035 (6.12%)
Base Year 2025 (USD 8.45 Billion)
2026 Forecast Start USD 9.12 Billion
2035 Forecast End USD 14.68 Billion
Fastest Growing Segment Seed Testing by sample; Rapid Testing by technology
Companies Profiled 10 (SGS, Eurofins, Intertek, PerkinElmer, Mérieux NutriSciences, Bureau Veritas, ALS, Agrolab, Romer Labs, AGQ Labs)
Valuation Currency USD Billion


FAQs

How long does a typical ISO 17025 accreditation take for a new agricultural testing laboratory?

Accreditation typically requires 12–18 months, covering documentation, proficiency testing, and on-site assessment. Budget USD 50,000–120,000 for consulting, inter-laboratory comparison fees, and auditor costs [15].

What is the average cost per sample for a multi-residue pesticide panel in the agricultural testing market?

A 200+ compound LC-MS/MS panel costs USD 120–250 per sample at commercial laboratories. Rapid immunoassay alternatives screen for 10–15 target analytes at USD 15–30 per sample [12].

Can portable NIR devices replace central laboratory soil nutrient testing services entirely?

Portable NIR covers macronutrients and organic matter reliably but lacks the precision for trace-metal or micronutrient quantification. Central laboratories remain essential for regulatory-grade reporting [7].

Which blockchain platforms are agricultural testing laboratories adopting for certificate management?

Hyperledger Fabric and Ethereum-based private chains dominate, chosen for permissioned access and audit-trail immutability. SGS and Bureau Veritas have both deployed Hyperledger-based systems [18].

How do carbon-credit soil testing contracts differ from standard soil nutrient testing services agreements?

Carbon contracts mandate fixed-plot sampling annually for five to ten years, with GPS-tagged cores and chain-of-custody documentation. Standard nutrient tests are one-off or seasonal [11].

Author
Author
Author Profile
Snehal Singh LinkedIn
Manager - Research
High acumen in analyzing complex macro & micro markets with more than 6 years of work experience in the field of market research. By implementing her analytical skills in forecasting and estimation into market research reports, she has expertise in Packaging, Construction, and Equipment domains. She handles a team size of 20-25 resources and ensures smooth running of the projects, associated marketing activities, and client servicing.
Download Free Sample

Kindly complete the form below to receive a free sample of this Report

Request Free Sample ×

Kindly complete the form below to receive a free sample of this Report

* Please use a valid business email

Leading companies partner with us for data-driven Insights

clients tt-cursor