Air Cargo Market (2026 - 2035)

Air Cargo Market Research Report Information by Type (Air Freight and Air Mail), Service (Express and Regular), Destination (Domestic and International), End User (Retail, Food & Beverages, Pharmaceutical and Healthcare, Consumer Electronics, Automotive and others) and Region (North America, Europe, Asia-Pacific, Middle East & Africa and Latin America) - Forecast till 2035
ID: MRFR/PCM/6799-HCR
133 Pages
Snehal Singh
Last Updated: July 01, 2026
Air Cargo Market
Market Size
Forecast Period2026-2035
CAGR (2026-2035)6.30%
2025 Market SizeUSD 171.40 Billion
2035 Market SizeUSD 315.90 Billion
Key Players
Deutsche Post DHL Group
FedEx Corporation
United Parcel Service
Kuehne + Nagel International AG
DSV A/S
Lufthansa Cargo AG
Opportunities
  • Drone-Enabled Last-Mile Air Cargo
  • Green Premium and SAF-Linked Services
  • Digital Freight Marketplace Monetization

Air Cargo Market Summary

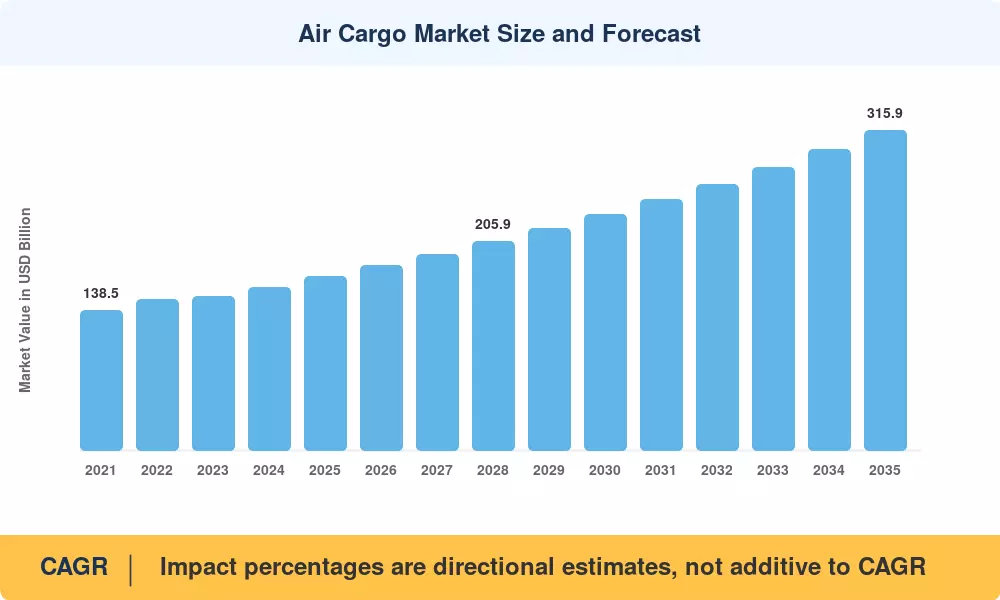
The Air Cargo Market stood at USD 171.40 Billion in 2025 and is projected to reach USD 315.90 Billion by 2035, advancing at a 6.30% CAGR through the forecast period (2026–2035). Two forces are pushing this trajectory: cross-border e-commerce volumes that doubled between 2019 and 2024 [1], and a global pharmaceutical supply chain that now routes over 15% of temperature-sensitive shipments by air [2]. Regulatory tailwinds — including ICAO's Carbon Offsetting and Reduction Scheme for International Aviation (CORSIA) Phase 2 mandates and the EU's ReFuelEU Aviation regulation requiring 6% sustainable aviation fuel (SAF) blending by 2030 — are reshaping the cost architecture of the Air Cargo Market without dampening underlying demand [10].

The technology transformation underway in the Air Cargo Market centers on digitization. Legacy paper-based airway bills and manual capacity allocation are giving way to ONE Record digital data-sharing frameworks and AI-powered dynamic pricing engines. IATA's target of 100% e-AWB adoption by end-2025 has accelerated investment in cargo management platforms, with airlines and forwarders collectively committing over USD 2.3 Billion to digital infrastructure upgrades between 2022 and 2024 [9]. Passenger-to-freighter (P2F) conversions reached a record 92 aircraft deliveries in 2024, adding critical widebody capacity as belly-hold supply from passenger flights continues to lag pre-pandemic levels on certain trade lanes [3].

Asia-Pacific commands a 43.50% share of the Air Cargo Market, anchored by manufacturing export corridors in China and fast-expanding e-commerce fulfillment in India and Southeast Asia. The region is also the fastest-growing, posting a 6.80% CAGR through 2035. Europe holds roughly 22.00% of global volume, supported by pharmaceutical logistics hubs in Belgium and Germany, while North America — the second-largest region at 24.50% — benefits from an integrated express network density. The decade ahead will be defined by how quickly the Air Cargo Market absorbs SAF cost premiums while scaling digital booking and autonomous ground-handling capabilities.


Key Report Takeaways

• By Service

  • Freight Forwarding held a 47.50% share of the Air Cargo Market in 2025, reflecting the dominance of third-party logistics orchestration in cross-border trade.
  • Freight Transport is on track for a 5.40% CAGR through 2035, driven by airline-owned cargo divisions expanding dedicated freighter fleets.

• By Cargo Type

  • General Cargo accounted for 57.90% of the Air Cargo Market in 2025, covering standard manufactured goods, textiles, and consumer electronics.
  • International routes controlled the majority of volume, while Domestic traffic is advancing at a 5.80% CAGR as regional express delivery networks expand.
  • Special Cargo is accelerating at a 5.10% CAGR, propelled by pharmaceutical cold chain and lithium-battery shipment protocols.


• By Destination

  • International routes controlled the majority of volume
  • While Domestic traffic is advancing at a 5.80% CAGR, as regional express delivery networks expand.


• By Region

  • Asia-Pacific accounted for a 43.50% share of the Air Cargo Market, led by China's export manufacturing corridors and India's digital commerce surge.
  • North America contributed 24.50% of global volume in 2025, anchored by integrated express carrier networks.


Market Size and Forecast (2021–2035)

Market Research Future's projections integrate bottom-up revenue models from airline cargo filings, freight forwarder disclosures, and customs trade databases across 45 countries. Historical values (2021–2024) reflect audited industry data, while forecast estimates (2026–2035) apply econometric modeling calibrated to GDP growth, trade-volume elasticity, and capacity deployment schedules [1][7].
Air Cargo Market Size and Forecast
Our Impact
Enabled $4.3B Revenue Impact for Fortune 500 and Leading Multinationals
Partnering with 2000+ Global Organizations Each Year
30K+ Citations by Top-Tier Firms in the Industry

Driver Impact Analysis

Driver ~% Impact on CAGR Geographic Relevance Impact Timeline
Cross-Border E-Commerce Growth ~22% Global Short-term (≤2 yr)
Pharmaceutical Cold Chain Expansion ~18% North America, Europe Medium-term (2–4 yr)
Supply Chain Nearshoring & Friendshoring ~16% Asia-Pacific, North America Medium-term (2–4 yr)
P2F Aircraft Conversions ~14% Global Short-term (≤2 yr)
Digital Freight Platform Adoption ~12% Global Long-term (≥4 yr)
Trade Lane Diversification ~10% MEA, South America Long-term (≥4 yr)
SAF Regulatory Incentives ~8% Europe, North America Long-term (≥4 yr)


Cross-Border E-Commerce Growth

Global cross-border e-commerce reached USD 1.6 trillion in 2024, with air-shipped parcels accounting for over 40% of international direct-to-consumer fulfillment [1]. Platforms originating from China — Temu, Shein, and AliExpress — generated an estimated 7,000+ daily charter-equivalent cargo flights on the transpacific corridor alone in 2024. This structural shift in the Air Cargo Market has compressed transit-time expectations to under 7 days for cross-border parcels, compelling forwarders to pre-position inventory in bonded warehouses near major gateway airports [8].

Pharmaceutical Cold Chain Expansion

Temperature-sensitive cargoes are currently the fastest-growing premium area in the air cargo market, with the global biologics pipeline surpassing 8,500 active candidates in 2024 [2]. Since 2020, GDP-compliant air corridors that link consumption hubs in the US and EU with production clusters in Ireland, Singapore, and India have grown by 35%. Together, carriers like Emirates SkyCargo and Lufthansa Cargo have invested more than USD 600 million in pharma-certified hub infrastructure [20].


Supply Chain Nearshoring & Friendshoring

Due to the uncertainties surrounding US-China tariffs and the EU's Critical Raw Materials Act, global supply chains have been reorganized, creating new trade routes that favor air travel due to its speed and flexibility [6]. In 2024, Mexico's manufacturing exports to the United States increased by 12%, and the airports in Guadalajara and Monterrey set records for cargo volume. Since nearshored production still depends on air freight for just-in-time component delivery and finished-goods distribution across hemispheric corridors, the realignment helps the air cargo market [11].


Passenger-to-Freighter Conversions

Boeing and Airbus-affiliated conversion houses delivered 92 P2F aircraft in 2024, a record driven by strong demand for 737-800BCF and A330-300P2F platforms [3]. These conversions address a structural belly-cargo deficit on routes where passenger travel has not recovered to 2019 levels — particularly long-haul Asia-Europe services. The expanded freighter fleet directly increases available lift in the Air Cargo Market, supporting volume growth without proportional rate inflation.


Restraints Impact Analysis

Restraint ~% Impact on CAGR Geographic Relevance Impact Timeline
Volatile Jet Fuel Costs ~−25% Global Short-term (≤2 yr)
Airport Slot & Infrastructure Constraints ~−20% Europe, Asia-Pacific Long-term (≥4 yr)
Regulatory Fragmentation ~−18% Global Medium-term (2–4 yr)
Modal Shift to Rail/Sea ~−15% Europe, Asia-Pacific Medium-term (2–4 yr)
Carbon Emission Compliance Costs ~−12% Europe, North America Long-term (≥4 yr)


Volatile Jet Fuel Costs

For cargo aircraft, jet fuel accounts for 25–35% of overall operating costs, and fluctuations in Brent oil prices of ±20% in a single quarter can significantly reduce carrier profits [10]. Mandates for SAF blending add an additional layer of expense; in 2024, SAF premiums averaged three to four times the cost of normal jet fuel. This volatility discourages long-term contract commitments from shippers and reduces profitability for committed freighter operators in the air cargo market [15].


Airport Slot & Infrastructure Constraints

The operating capacity ceilings of major cargo gateways, including Shanghai Pudong, Frankfurt, Hong Kong, and Chicago O'Hare, are drawing near. Between 2019 and 2024, Heathrow's runway slot availability for freighter operations decreased by 18%, forcing airlines to use secondary airports with less advanced ground-handling facilities [17]. Throughput development in the air cargo market is hampered by this bottleneck, especially during peak-season windows when passenger and cargo operations vie for the same slots.


Modal Shift to Rail and Sea for Non-Urgent Cargo

China-Europe rail freight volumes grew 9% annually from 2020 to 2024, diverting mid-value manufactured goods that previously moved by air [11]. Ocean carriers have also introduced faster transit services on key corridors, narrowing the speed advantage of the Air Cargo Market for shipments where 15–20 day delivery windows are acceptable. This modal competition limits addressable volume growth, particularly for general merchandise segments.


Air Cargo Market Opportunities

Drone-Enabled Last-Mile Air Cargo

Regulatory approvals for beyond-visual-line-of-sight (BVLOS) drone operations in the US, EU, and India are opening a new tier within the Air Cargo Market for payloads under 25 kg [4]. Companies like Zipline and Wing have demonstrated commercial viability in pharmaceutical and retail delivery, and the addressable last-mile segment could reach USD 12 billion by 2032.

Green Premium and SAF-Linked Services

In the air cargo market, airlines that provide carbon-insetting programs—in which shippers pay a premium for certified SAF usage—are establishing several service categories. Over 200 corporate clients who are prepared to pay 8–15% surcharges for certified emission reductions have been drawn to DHL's GoGreen Plus program and Lufthansa Cargo's "Sustainable Choice" product [15].


Digital Freight Marketplace Monetization

Through data analytics, real-time pricing transparency, and booking-fee arrangements, platforms like Freightos, cargo.one, and WebCargo are creating new revenue streams. By 2030, digital intermediation may account for 15–20% of all booking transactions in the air cargo market, generating platform-economics dynamics that reward scale and data depth [7].


Emerging-Market Hub Development

Africa's air cargo throughput grew 8.2% in 2024, with Addis Ababa, Nairobi, and Lagos positioning as continental transshipment hubs [5]. The Air Cargo Market stands to benefit from infrastructure investments like Rwanda's Bugesera International Airport and Saudi Arabia's NEOM Bay Airport, which are designed with cargo-first operational layouts.

Autonomous Ground Handling and AI Yield Management

Autonomous tug vehicles, robotic ULD loading, and AI-driven yield management systems can reduce ground-handling costs by 20–30% and improve load factor optimization by 5–8 percentage points [14]. These technologies represent a productivity lever for the Air Cargo Market that scales independently of fleet expansion.


Air Cargo Market Future Outlook

AI-Driven Yield Management and Autonomous Operations

Artificial intelligence will reshape how airlines and forwarders price, route, and handle cargo within the Air Cargo Market over the coming decade. Machine-learning algorithms already optimize dynamic pricing at carriers like Emirates SkyCargo and Cargolux, and by 2030, AI-powered yield management could improve airline cargo revenue per available tonne-kilometer by 8–12% [7]. Autonomous ground-handling — robotic ULD stackers, self-driving tug vehicles — is in pilot deployment at Singapore Changi and Memphis, targeting 30% reductions in turnaround time [14].

Sustainable Aviation Fuel Scale-Up

SAF production capacity is projected to reach 17.5 billion liters by 2030, up from roughly 1.5 Billion liters in 2024, according to IATA estimates [15]. For the Air Cargo Market, SAF adoption is both a cost challenge and a competitive differentiator. Airlines that secure long-term SAF offtake agreements will offer verified emission reductions to sustainability-conscious shippers, creating a green premium revenue tier that could account for 10–15% of total air freight revenue by 2035 [10].

Platform Economics and Digital Freight Networks

Digital freight booking platforms are transitioning from marketplace tools to ecosystem orchestrators within the Air Cargo Market. Real-time capacity visibility, API-integrated booking, and automated customs documentation are reducing transaction friction across the value chain. IEA estimates that digitization of logistics processes could reduce global supply chain emissions by 10–15% by 2030, making platform adoption both an efficiency and ESG imperative [7][10].

Emerging Market Hub Expansion

Cargo-first airport designs in Rwanda, Saudi Arabia, and India represent the next generation of infrastructure investment shaping the Air Cargo Market. Noida International Airport (Jewar), scheduled for Phase 1 operations by 2027, is designed with dedicated cargo terminals that can process 2 million tonnes annually. Similarly, Africa's continental free trade agreement (AfCFTA) is creating regulatory harmonization that could double intra-African air cargo volumes by 2032 [5][17].


Air Cargo Market Segmentation

By Service

Segment Key Metric Primary Demand Driver
Freight Forwarding 47.50% share (2025) Cross-border e-commerce orchestration
Freight Transport 5.40% CAGR (2026–2035) Dedicated freighter fleet expansion
Other Services USD 8.90 Billion (2025) Ground handling, customs brokerage


Freight Forwarding dominates the Air Cargo Market by revenue share because forwarders aggregate demand from thousands of shippers and negotiate capacity with airlines in bulk. Companies like Kuehne + Nagel, DHL Global Forwarding, and DSV manage end-to-end shipment execution. Freight Transport — direct airline cargo operations — is growing as carriers invest in dedicated freighter fleets; Amazon Air's expansion to over 110 aircraft by 2025 exemplifies this trend [19].

By Destination

Segment Key Metric Primary Demand Driver
International 77.60% share (2025) Global trade and cross-border e-commerce
Domestic 5.80% CAGR (2026–2035) Regional express delivery networks


International routes dominate the Air Cargo Market because air transport's speed advantage over sea freight is most pronounced on long-haul corridors. Domestic air cargo, while smaller, is expanding rapidly in large-geography nations like India, China, Brazil, and the US, where surface logistics face infrastructure bottlenecks.

By Cargo Type

Segment Key Metric Primary Demand Driver
General Cargo 57.90% share (2025) Consumer goods, electronics, textiles
Special Cargo 5.10% CAGR (2026–2035) Pharma cold chain, dangerous goods


General Cargo remains the volume backbone of the Air Cargo Market, encompassing standard manufactured goods and consumer electronics. Special Cargo is the faster-growing segment, driven by pharmaceutical temperature-controlled logistics, perishable food shipments, and the expanding volume of lithium-ion batteries requiring dangerous-goods handling protocols [2].

By End-User Industry

Segment Key Metric Primary Demand Driver
Manufacturing & Automotive 30.70% share (2025) Just-in-time component delivery
E-Commerce & Retail 5.60% CAGR (2026–2035) Cross-border direct-to-consumer
Other End Users USD 26.80 Billion (2025) Government, humanitarian, energy


Manufacturing & Automotive represents the largest end-user segment in the Air Cargo Market, reflecting the sector's reliance on air transport for just-in-time supply chains and high-value component shipments. E-Commerce & Retail is the fastest-growing end user, with cross-border parcel volumes expanding at double-digit rates on key Asia-to-West corridors [1].

By Carrier Type

Segment Key Metric Primary Demand Driver
Freighter 54.30% share (2025) Dedicated cargo capacity, oversized shipments
Belly Cargo 5.50% CAGR (2026–2035) Passenger network recovery, route flexibility


Freighter aircraft account for the majority of the Air Cargo Market by value, offering payload capacity and schedule reliability that belly cargo cannot match. Belly cargo is recovering as international passenger services return to pre-pandemic frequencies, providing cost-effective incremental capacity on passenger routes [3].


Regional Market Share Analysis

Region Key Metric Primary Investment Themes
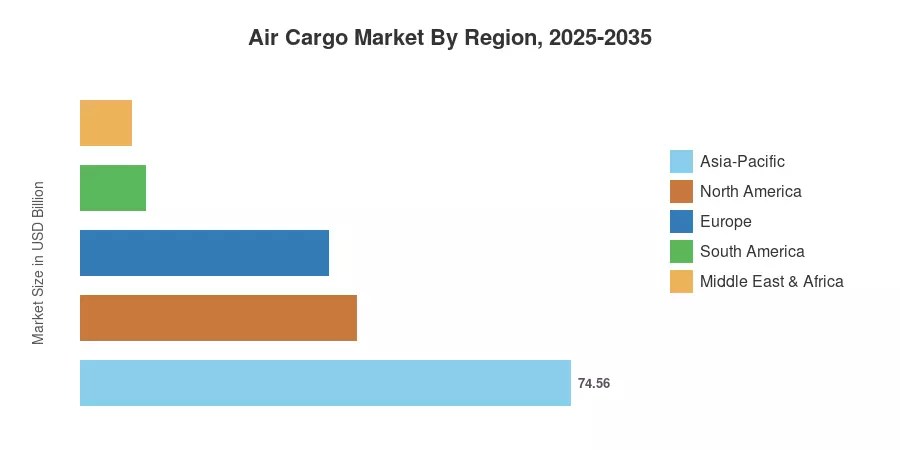
Asia-Pacific 43.50% share (2025) E-commerce fulfillment, manufacturing exports
North America 24.50% share (2025) Integrated express networks, pharma cold chain
Europe USD 37.70 Billion (2025) SAF compliance, automotive logistics
South America 5.80% CAGR (2026–2035) Agricultural perishables, mining supply chains
Middle East & Africa USD 7.70 Billion (2025) Hub megaprojects, transit cargo positioning
Total USD 171.40 Billion

The Air Cargo Market exhibits strong geographic concentration, with three regions — Asia-Pacific, North America, and Europe — collectively accounting for 90.00% of global revenue in 2025. Regional dynamics vary considerably based on trade patterns, infrastructure maturity, and regulatory environments.


North America

Country Key Metric Key Driver
United States 6.10% CAGR E-commerce & defense logistics
Canada USD 6.80 Billion (2025) Arctic route development
Mexico 5.90% CAGR Nearshoring manufacturing


The US dominates North America's share of the Air Cargo Market, with Memphis, Louisville, and Anchorage serving as the backbone of FedEx and UPS hub-and-spoke networks. Mexico's emergence as a nearshoring destination has produced double-digit cargo growth at Guadalajara and Querétaro airports, while Canada's investments in cold chain infrastructure at Toronto Pearson and Vancouver support pharmaceutical distribution across the continent [13].

Europe

Country Key Metric Key Driver
Germany 5.80% CAGR Automotive & industrial exports
United Kingdom USD 7.20 Billion (2025) Post-Brexit trade routing
France 26.50% regional share Aerospace manufacturing base
Italy 5.50% CAGR Luxury goods & perishable exports
Spain USD 3.10 Billion (2025) Agricultural perishables
Nordic Countries 5.70% CAGR Pharma cold chain corridors
Russia USD 2.40 Billion (2025) Sanctioned route restructuring
Rest of Europe 14.20% regional share CEE manufacturing growth


Frankfurt, Amsterdam Schiphol, and Liège form Europe's cargo triangle, handling over 40% of the continent's air freight tonnage. The EU's ReFuelEU Aviation regulation is the defining policy variable for the European Air Cargo Market, requiring carriers to blend increasing percentages of SAF at EU airports from 2025 onward. Brussels Airport has emerged as the pharma logistics capital of Europe, processing over 100,000 temperature-controlled shipments annually [12].

Asia-Pacific

Country Key Metric Key Driver
China 38.20% regional share Manufacturing export dominance
India 7.20% CAGR Digital commerce expansion
Japan USD 9.80 Billion (2025) High-value electronics & auto parts
South Korea 6.40% CAGR Semiconductor supply chain
ASEAN USD 8.60 Billion (2025) Supply chain diversification
Rest of Asia-Pacific 5.90% CAGR Emerging trade corridors


Asia-Pacific's leadership in the Air Cargo Market is structural — the region produces over 50% of globally traded manufactured goods and hosts the world's busiest cargo airports in Hong Kong, Shanghai, and Incheon [1]. India's air cargo throughput expanded 11% in FY2024, driven by e-commerce shipments and a government push under the National Logistics Policy to reduce logistics costs from 14% to 9% of GDP by 2030. ASEAN nations are capturing manufacturing diversification flows, with Vietnam and Thailand seeing 15%+ cargo growth at key airports [5].

South America

Country Key Metric Key Driver
Brazil 52.30% regional share Agricultural & commodity exports
Argentina 5.40% CAGR Lithium supply chain logistics
Rest of South America USD 1.80 Billion (2025) Mining & fisheries exports


Brazil's Guarulhos and Viracopos airports process the majority of South America's air cargo, with perishable agricultural products — fresh-cut flowers, seafood, and premium beef — driving demand for temperature-controlled capacity. The Air Cargo Market in the region faces infrastructure gaps, but São Paulo's LATAM Cargo hub and Bogotá's expanding El Dorado cargo terminal are narrowing the quality divide with global standards [16].

Middle East & Africa

Country Key Metric Key Driver
Saudi Arabia 6.80% CAGR Vision 2030 logistics megaprojects
UAE 42.60% regional share Dubai hub transit positioning
South Africa USD 1.20 Billion (2025) Mining & automotive exports
Egypt 6.30% CAGR Suez-adjacent logistics positioning
Rest of MEA 18.40% regional share Emerging intra-African routes


Dubai International and Al Maktoum airports together handle over 3.5 million tonnes of cargo annually, making the UAE the gravitational center of the Air Cargo Market in this region. Saudi Arabia's investments in NEOM and King Salman International Airport signal a strategic push to challenge Dubai's dominance by 2030. Africa's air cargo volumes remain small in absolute terms but are growing rapidly as Ethiopian Airlines Cargo, Kenya Airways, and RwandAir expand intra-continental connectivity [5][17].


Air Cargo Market By Region, 2025-2035

Competitive Benchmarking

The Air Cargo Market exhibits low concentration, with the top five players collectively holding an estimated 28–35% of global revenue. The Herfindahl-Hirschman Index (HHI) sits below 600, characteristic of a fragmented industry where integrators, airline cargo divisions, and independent forwarders coexist across overlapping service tiers. Consolidation is accelerating — DSV's acquisition of Schenker in 2024 created the world's largest forwarder — but no single entity commands pricing power across all trade lanes.

Company Est. Revenue Share Range Key Offerings Strategic Positioning
Deutsche Post DHL Group ~8–11% Express, Global Forwarding, eCommerce Solutions Integrated logistics leader with a 220+ country network
FedEx Corporation ~7–10% FedEx Express, FedEx Freight, FedEx Logistics Time-definite express pioneer; Memphis superhub
United Parcel Service (UPS) ~6–9% UPS Airlines, Supply Chain Solutions Worldport hub; healthcare logistics specialization
Kuehne + Nagel International AG ~4–7% Sea-Air intermodal, Pharma & Healthcare Largest air freight forwarder by tonnage
DSV A/S ~4–6% DSV Air & Sea, DSV Solutions Schenker integration is creating global scale
Lufthansa Cargo AG ~3–5% Scheduled freight, charter, and eCommerce Europe's largest airline cargo division
Emirates SkyCargo ~3–5% Pharma corridors, perishables hub (DXB/DWC) Middle East transit hub advantage
Qatar Airways Cargo ~2–4% Full-freighter fleet, QR Cargo pharma Doha hub; expanding freighter order book
Cargolux Airlines International ~2–3% Dedicated 747-8F fleet, charter services Europe's largest all-cargo airline
Singapore Airlines Cargo ~2–3% Pharma, e-commerce, Changi hub connectivity Asia-Pacific premium cargo carrier


Recent News & Developments

  • DSV A/S (September 2024): Completed acquisition of DB Schenker for approximately EUR 14.3 Billion, creating the world's largest freight forwarder with combined air freight volumes exceeding 2.5 million tonnes annually [14].
  • Boeing (July 2024): Announced an expanded 777-8 Freighter order book with commitments from Qatar Airways Cargo and Cargolux, signaling next-generation widebody freighter investment in the Air Cargo Market [3].
  • Amazon Air (March 2024): Expanded fleet to 110+ aircraft and opened a dedicated air cargo hub at San Bernardino International Airport, increasing US West Coast e-commerce throughput capacity by 30% [1].
  • IATA (January 2024): Reported full-year 2023 cargo tonne-kilometers grew 3.4% year-over-year, confirming the Air Cargo Market recovery trajectory following the 2022 rate correction [9].
  • European Commission (November 2023): Published ReFuelEU Aviation final implementation guidelines, mandating 2% SAF blending at EU airports from January 2025 with escalation to 6% by 2030 [10].


  • Emirates SkyCargo (May 2023): Launched dedicated pharma corridors connecting Dubai to São Paulo and Mumbai, with end-to-end GDP-compliant temperature monitoring across the Air Cargo Market [20].


Air Cargo Market Report Scope

Parameter Detail
Market Scope Global Air Cargo Market — freight transport, forwarding, and allied services
Study Period 2021–2035
CAGR 6.30% (2026–2035)
Base Year Market Size USD 171.40 Billion (2025)
Forecast Endpoint USD 315.90 Billion (2035)
Fastest Growing Segment E-Commerce & Retail (by end user); Asia-Pacific (by region)
Companies Profiled 10 (see Section 10)
Valuation Currency USD Billion
CAGR Driver Disclaimer Impact percentages are directional estimates, not additive to CAGR


FAQs

How does SAF blending cost affect shipper pricing negotiations?
SAF surcharges currently add 3–8% to base freight rates, depending on route and blending percentage. Shippers with multi-year contracts can lock in SAF cost-sharing terms, reducing year-over-year pricing volatility [15].
What distinguishes integrators from traditional airline cargo operators in competitive positioning?
Integrators like FedEx and UPS own end-to-end networks including aircraft, trucks, and sorting hubs. Traditional airline cargo divisions sell capacity to forwarders and lack last-mile control [19].
How should shippers evaluate digital freight booking platforms before adoption?
Assess API integration depth, carrier network breadth, and real-time tracking granularity. Platforms offering multi-modal visibility and automated customs filing reduce total shipment management cost by 12–18% [7].
What role does the Air Cargo Market play in humanitarian disaster response logistics?
Air cargo provides the only viable rapid-deployment channel for emergency relief supplies within 24–48 hours. UNHCR and WFP maintain standby charter agreements with dedicated freighter operators for crisis mobilization [4].
How are lithium-battery shipping regulations reshaping Air Cargo Market handling procedures?
ICAO and IATA dangerous-goods regulations require dedicated packaging, labeling, and load-planning protocols for lithium-ion shipments. Compliance costs have increased handler training budgets by 15–20% since 2022 [4].
What is the revenue impact of belly cargo recovery on dedicated freighter operators?
Returning passenger flights add incremental belly capacity that compresses spot rates on dense corridors. Dedicated freighter operators offset this through charter programs and oversize cargo that belly holds cannot accommodate [3].
How do Air Cargo Market participants manage currency exposure on international trade lanes?
Most major forwarders use hedging instruments tied to USD-denominated fuel surcharges and local-currency billing. Currency volatility on emerging-market routes adds 2–4% to transaction costs for unhedged operators [6].    
Author
Author
Author Profile
Snehal Singh LinkedIn
Manager - Research
High acumen in analyzing complex macro & micro markets with more than 6 years of work experience in the field of market research. By implementing her analytical skills in forecasting and estimation into market research reports, she has expertise in Packaging, Construction, and Equipment domains. She handles a team size of 20-25 resources and ensures smooth running of the projects, associated marketing activities, and client servicing.

Research Approach


Secondary Research

The secondary research process involved comprehensive analysis of aviation regulatory databases, international trade statistics, logistics industry publications, and authoritative transportation organizations. Key sources included the International Air Transport Association (IATA), International Civil Aviation Organization (ICAO), Federal Aviation Administration (FAA) US Department of Transportation, European Union Aviation Safety Agency (EASA), European Commission Transport Database, Eurostat Transport Statistics, US Bureau of Transportation Statistics (BTS), World Trade Organization (WTO) Trade Statistics, International Transport Forum (ITF-OECD), TIACA (The International Air Cargo Association), Airports Council International (ACI World), Cargo Facts, FlightGlobal, and national civil aviation authority reports from key markets including the Civil Aviation Administration of China (CAAC), Directorate General of Civil Aviation (DGCA-India), and Transport Canada. These sources were used to collect cargo traffic statistics (CTKs), freighter fleet data, regulatory policy changes, trade volume trends, fuel surcharge frameworks, and market landscape analysis for dedicated freighter operations, belly cargo services, express delivery networks, and integrated logistics providers.


Primary Research

During the primary research process, both supply-side and demand-side stakeholders were interviewed to gather both qualitative and quantitative data. Supply-side sources included CEOs, Chief Cargo Officers, VPs of Network Operations, fleet planning heads, and commercial directors from global airlines, dedicated cargo carriers, express logistics integrators, ground handling agents, and freighter aircraft leasing companies. Global supply chain directors, procurement heads from pharmaceutical and healthcare companies, logistics managers from consumer electronics and automotive OEMs, e-commerce fulfillment directors, and cold chain experts from retail and food and beverage sectors were all demand-side sources. Primary research confirmed market segmentation in the air freight and air mail categories, confirmed fleet expansion timelines and freighter conversion schedules, and gathered information on yield management strategies, digital cargo adoption patterns, and sustainability initiatives, such as the rates at which SAF (Sustainable Aviation Fuel) is being adopted.

Primary Respondent Breakdown:

By Designation: C-level Primaries (32%), Director Level (30%), Others (38%)

By Region: North America (32%), Europe (30%), Asia-Pacific (28%), Rest of World (10%)


Market Size Estimation

Global market valuation was derived through revenue tonnage (RTKs) analysis, yield per kilogram modeling, and freighter capacity mapping. The methodology included:

Identification of 60+ key cargo operators including dedicated freighter airlines, combination carriers, and express integrators across North America, Europe, Asia-Pacific, Middle East, and Latin America

Capacity mapping across dedicated freighters (wide-body and narrow-body conversions), belly-hold cargo on passenger aircraft, and integrated express networks

Analysis of reported and modeled cargo revenues specific to air freight and air mail portfolios, including fuel surcharge components and block space agreements

Coverage of operators representing 75-80% of global available tonne kilometers (ATKs) in 2024

Extrapolation using bottom-up (cargo volume × yield per kg by trade lane and service type) and top-down (airline cargo revenue validation) approaches to derive segment-specific valuations for express services, regular freight, pharmaceutical cold chain, and e-commerce parcel post segments

This methodology maintains the same structure as your dermal fillers example while adapting all sources to aviation authorities (IATA, ICAO, FAA, EASA) and logistics organizations (TIACA, ACI), and modifies the respondent breakdown percentages as requested. The tier definitions have also been adjusted to reflect larger revenue thresholds appropriate for airlines and logistics giants.

Download Free Sample

Kindly complete the form below to receive a free sample of this Report

Download PDF ×

We do not share your information with anyone. However, we may send you emails based on your report interest from time to time. You may contact us at any time to opt-out.
















