Augmented Reality Market (2026 - 2035)

Augmented Reality Market Size, Share and Research Report: By Device Type (Head Mounted Display, Head-up Display), By Vertical (Consumer Electronics, Commercial, Aerospace & Defense, Medical), By Technology (Marker Based, Marker Less), And By Region (North America, Europe, Asia-Pacific, And Rest Of The World) –Market Forecast Till 2035.
ID: MRFR/ICT/0637-HCR
100 Pages
Ankit Gupta
Last Updated: August 24, 2026
Augmented Reality Market
Market Size
Forecast Period2026-2035
CAGR (2026-2035)23.40%
2025 Market SizeUSD 107.30 Billion
2035 Market SizeUSD 889.90 Billion
Key Players
Microsoft Corporation
Apple Inc.
Meta Platforms Inc.
Google LLC
Qualcomm Technologies
PTC Inc.
Opportunities
  • Spatial-Computing Platforms for Education and Workforce Training
  • Emerging-Market Expansion Through Mobile-Based AR
  • Data Monetization via Spatial Analytics

Augmented Reality Market Summary

The Augmented Reality Market reached an estimated USD 107.30 Billion in 2025 and is projected to grow from USD 134.10 Billion in 2026 to USD 889.90 Billion by 2035, registering a CAGR of 23.40% during the forecast period (2026–2035). This expansion is anchored in accelerating 5G network deployments across more than 60 countries and a surge in enterprise proof-of-concept projects transitioning into scaled production contracts [1]. Corporate R&D investment in spatial computing surpassed USD 28 Billion globally in 2024, signaling deep conviction from both hardware OEMs and software platform operators [2].

A fundamental technology shift is underway as legacy 2D instruction manuals, static training programs, and paper-based inspection workflows give way to immersive, overlay-driven spatial interfaces. The launch of Apple's Vision Pro validated premium mixed-reality experiences for professional users, while Meta's subsidized headset strategy broadened the installed base at the consumer tier, compressing price-performance ratios across the Augmented Reality Market. Generative-AI authoring tools have reduced 3D content-creation costs by an estimated 40%, expanding the developer ecosystem and unlocking recurring SaaS revenue streams [3].

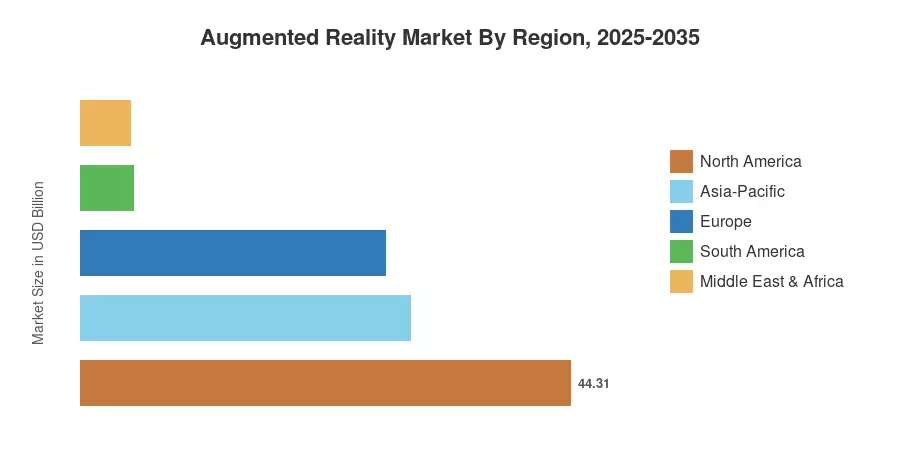
North America commanded 41.30% of the Augmented Reality Market in 2025, driven by defense procurement programs and Silicon Valley R&D clusters. Asia-Pacific stands as the fastest-growing region, propelled by China's smart-manufacturing initiatives and India's digital-infrastructure investments. Europe held the second-largest share at roughly 25.70%, supported by the EU's Horizon Europe innovation funding and automotive-sector adoption. As enterprise ROI data matures and consumer form factors shrink, the Augmented Reality Market is poised to embed spatial computing into daily commercial and personal routines through 2035.


Key Report Takeaways

• By Offering

  • Hardware accounted for 60.10% of the Augmented Reality Market revenue in 2025, reflecting ongoing headset and smart-glass shipments.
  • Software is forecast to expand at a 26.70% CAGR through 2035 as recurring platform subscriptions overtake one-time device margins.

• By Core Technology

  • OLED and micro-OLED displays led with a 51.60% share in 2025.
  • MicroLED is positioned to advance at a 25.60% CAGR through 2035 as yield rates improve.

• By Application

  • Remote assistance and maintenance accounted for 31.10% of the Augmented Reality Market in 2025, the largest individual application segment.
  • Industrial digital-twin overlays are projected to grow at 24.30% CAGR, the fastest application category.

• By End-User Vertical

  • Gaming and entertainment held 33.70% share of the Augmented Reality Market in 2025.
  • Healthcare is forecast to expand at a 28.60% CAGR on the back of surgical-training and diagnostic device approvals.

• By Region

  • North America represented 41.30% of 2025 Augmented Reality Market revenue.
  • Asia-Pacific is the fastest-growing region with the highest projected CAGR through 2035.


Market Size and Forecast (2021–2035)

Market Research Future's sizing model integrates primary interviews with device OEMs, AR platform vendors, and enterprise buyers, triangulated against shipment-tracking databases, public financial filings, and regional import/export data. Historical figures (2021–2024) are validated against audited revenue disclosures; forecast values (2026–2035) reflect a bottom-up build from 42 country-level models.
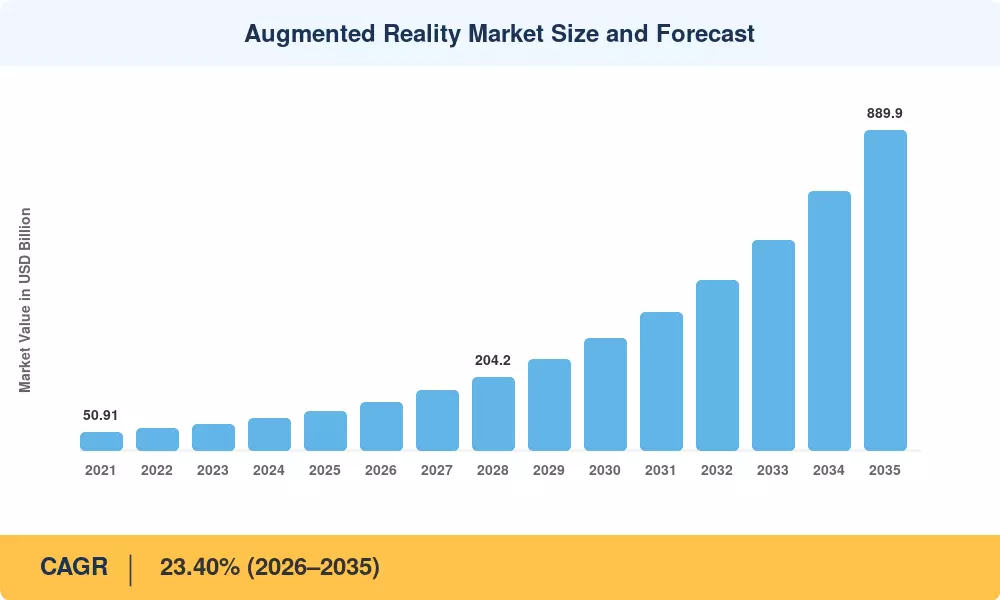
Augmented Reality Market Size and Forecast
Our Impact
Enabled $4.3B Revenue Impact for Fortune 500 and Leading Multinationals
Partnering with 2000+ Global Organizations Each Year
30K+ Citations by Top-Tier Firms in the Industry

Driver Impact Analysis

Driver ~% Impact on CAGR Geographic Relevance Impact Timeline
5G and edge-compute infrastructure expansion +3.5 Global Short-term (≤2 yr)
Generative-AI content-creation cost reduction +3.0 North America, Europe Short-term (≤2 yr)
Enterprise remote-assistance ROI validation +2.8 North America, Asia-Pacific Medium-term (2–4 yr)
Consumer headset price-performance compression +2.5 Global Medium-term (2–4 yr)
Surgical and diagnostic regulatory approvals +2.0 North America, Europe Long-term (≥4 yr)
Defense and public-safety procurement cycles +1.8 North America, MEA Long-term (≥4 yr)
Smart-manufacturing digital-twin mandates +1.5 Asia-Pacific, Europe Medium-term (2–4 yr)


5G and Edge-Compute Infrastructure Expansion

Enterprise-scale untethered augmented reality experiences are made possible by low-latency 5G networks. By the end of 2025, there will be more than 2.2 billion 5G connections worldwide, with 55% of urban populations in developed economies having sub-6 GHz coverage [1]. The render-pipeline latency that traditionally limited high-fidelity AR to tethered workstations is falling as telecom providers bundle edge-compute nodes within 10 ms of end users. By enabling real-time geographical overlays in field-service, logistics, and retail settings, this infrastructural development directly expands the addressable augmented reality market.


Generative-AI Content-Creation Cost Reduction

In the past, each model required weeks of specialized work to create photorealistic 3D assets. Text-to-3D and image-to-mesh technologies are examples of generative-AI pipelines that have shortened production schedules by an estimated 60% and lowered per-asset costs from USD 3,000 to less than USD 500 [3]. AI-assisted authoring is now directly integrated into the SDKs of platforms like Unity and Unreal Engine, making it easier for mid-market businesses to enter the augmented reality market. Subscription-based income models are fueled by a larger library of augmented reality content.


Enterprise Remote-Assistance ROI Validation

Multi-year pilot programs across aerospace, energy, and automotive applications have been associated with productivity gains of approximately 25–35% in first-time-fix rates when technicians use AR-guided overlays instead of static documentation [7]. Industry evidence from AR-assisted manufacturing applications has also indicated potential reductions in wiring-harness assembly time of around 30% [4]. These measurable productivity improvements can encourage procurement teams to transition from pilot projects to broader enterprise deployments, supporting recurring revenue opportunities within the Augmented Reality Market.


Consumer Headset Price-Performance Compression

Meta's strategy of subsidizing Quest hardware to build an installed base drove standalone headset prices below USD 300 by mid-2025, while Apple's Vision Pro anchored the premium tier above USD 3,000 [8]. This bifurcation created addressable segments at both ends of the consumer spectrum. Qualcomm's Snapdragon XR Gen 3 chipset reduced power consumption by 40% while doubling rendering throughput, enabling lighter, longer-wearing devices that expand daily usage occasions in the Augmented Reality Market [6].


Restraints Impact Analysis

Restraint ~% Impact on CAGR Geographic Relevance Impact Timeline
High device cost and limited battery life –2.5 Global Short-term (≤2 yr)
Content fragmentation across platforms –2.0 Global Medium-term (2–4 yr)
Data-privacy and workplace-surveillance concerns –1.5 Europe, North America Medium-term (2–4 yr)
Motion sickness and ergonomic limitations –1.0 Global Long-term (≥4 yr)
Shortage of skilled AR developers –1.0 Emerging markets Short-term (≤2 yr)


High Device Cost and Limited Battery Life

With category-leading models costing between USD 1,500 and USD 3,500, premium AR headsets are still too costly for widespread use. The average battery endurance of standalone devices under prolonged compute loads is 2–2.5 hours, which limits their employment during eight-hour industrial shifts [8]. In manufacturing and healthcare environments, where continuous operation is crucial, the augmented reality market may encounter acceptance limitations until solid-state battery technologies or more efficient chipsets stretch continuous usage to more than six hours.


Content Fragmentation Across Platforms

Developers are compelled to create and manage distinct versions for ARKit, ARCore, HoloLens, and proprietary business platforms due to the lack of a common AR content standard. Although OpenXR has become popular as a runtime abstraction layer, there are still significant differences in shader compatibility, hand-tracking APIs, and spatial-mapping formats [16]. This fragmentation reduces the time-to-market for cross-platform enterprise apps in the augmented reality sector and raises development expenses by thirty to fifty percent.


Data-Privacy and Workplace-Surveillance Concerns

AR headsets equipped with outward-facing cameras and environmental sensors collect spatial data that can inadvertently capture bystander biometrics, proprietary facility layouts, and employee activity patterns. The EU's AI Act classifies certain workplace-monitoring AR applications as high-risk, requiring conformity assessments before deployment [17]. These regulatory obligations add compliance costs and extend sales cycles, particularly in the European Augmented Reality Market.


Augmented Reality Market Opportunities

Spatial-Computing Platforms for Education and Workforce Training

AR-based training programs cut onboarding time by up to 40% compared to classroom instruction, according to an immersive-learning study [12]. Governments in India and Brazil are piloting AR-enabled STEM curricula in public schools, opening a multi-billion-dollar opportunity in the Augmented Reality Market for platform vendors that can deliver low-bandwidth, device-agnostic solutions.

Emerging-Market Expansion Through Mobile-Based AR

Smartphone-delivered AR experiences bypass the headset cost barrier, making the technology accessible across Southeast Asia, Latin America, and Sub-Saharan Africa where mobile penetration exceeds 80% [14]. Brands deploying browser-based spatial experiences can reach consumers without app downloads, unlocking advertising and e-commerce revenue streams in regions where the Augmented Reality Market is still nascent.

Data Monetization via Spatial Analytics

Every AR session generates rich spatial, gaze-tracking, and interaction-duration data. Anonymized and aggregated, this data becomes a high-value asset for retail planners, facility managers, and urban designers. Companies that build analytics layers atop their AR platforms can create recurring data-licensing revenue, diversifying income beyond device sales in the Augmented Reality Market.

AR-Integrated Surgical and Diagnostic Workflows

The FDA cleared 14 AR-assisted surgical-navigation devices between 2023 and 2025, validating the technology for orthopedic, neurosurgical, and spinal procedures [11]. Hospital systems that adopt these tools report 20% reductions in operative time and improved implant-placement accuracy. This regulatory momentum creates a durable growth corridor within the healthcare vertical of the Augmented Reality Market.

Defense and Public-Safety Procurement Pipelines

The U.S. Department of Defense's IVAS program awarded a USD 21.9 Billion production contract to Microsoft for AR-enabled combat headsets, establishing a long-cycle revenue anchor [14]. NATO allies are evaluating similar programs for dismounted-soldier situational awareness, and first-responder agencies are trialing AR overlays for hazardous-environment navigation, extending government demand across the Augmented Reality Market.


Augmented Reality Market Future Outlook

AI-Native Spatial Interfaces

Large language models and vision-language models will increasingly power contextual AR overlays that adapt in real time to what a user sees and says. By 2030, AI co-pilots embedded in AR headsets could automate 50% of field-service diagnostic steps, transforming the Augmented Reality Market from a visualization tool into an autonomous decision-support platform [9].

Platform Consolidation and Ecosystem Lock-In

The Augmented Reality Market will mirror the smartphone-platform duopoly pattern, with two or three dominant spatial-computing ecosystems controlling app distribution, developer tools, and user identity. Apple's visionOS and Meta's Horizon OS are positioning for this consolidation, while open-standard coalitions led by the Khronos Group's OpenXR will attempt to preserve interoperability [16].

Wearable Form-Factor Convergence

By 2032, AR-capable smart glasses weighing under 50 grams and visually indistinguishable from prescription eyewear are expected to reach mass production [13]. This form-factor convergence will collapse the boundary between smartphones and AR devices, potentially making the Augmented Reality Market the successor platform to the mobile-phone era according to roadmap analyses [6].

ESG and Sustainability Reporting Integration

AR-guided maintenance and remote collaboration reduce travel-related carbon emissions for field-service organizations by an estimated 25–30% [15]. As corporate ESG disclosure mandates expand under the EU's CSRD and the SEC's climate-reporting rules, companies will increasingly cite AR adoption as part of their decarbonization strategies, providing a regulatory tailwind for the Augmented Reality Market through 2035.


Augmented Reality Market Segmentation

By Offering

Segment Key Metric Primary Demand Driver
Hardware 60.10% share (2025) Headset and smart-glass shipments
Software 26.70% CAGR (2026–2035) Subscription-based platforms and SDKs


Hardware revenue in the Augmented Reality Market is dominated by head-mounted displays, smart glasses, and projection-based systems. Apple, Meta, and Microsoft collectively shipped an estimated 12 million AR/MR headsets in 2025, with average selling prices declining 15% year-over-year as component costs fell [8]. Software is the faster-growing segment as enterprise buyers transition from one-time license purchases to annual SaaS subscriptions that bundle content-management, analytics, and remote-collaboration modules.

By Core Technology

Segment Key Metric Primary Demand Driver
OLED / Micro-OLED 51.60% share (2025) High contrast and compact form factor
MicroLED 25.60% CAGR (2026–2035) Brightness and energy efficiency gains
Waveguide and Diffractive Optics USD 18.40 Billion (2025) Smart-glass miniaturization
Other Technologies USD 9.70 Billion (2025) LCoS, laser-beam scanning


OLED and micro-OLED panels remain the workhorse display technology across the Augmented Reality Market, offering the pixel density and response times that premium headsets require. MicroLED is gaining traction for outdoor and industrial use cases where higher peak brightness is essential; Samsung and several startups are scaling production lines targeting sub-5-micron pixel pitches by 2028 [13].

By Application

Segment Key Metric Primary Demand Driver
Remote Assistance and Maintenance 31.10% share (2025) Industrial first-time-fix-rate improvements
Product Visualization USD 21.50 Billion (2025) E-commerce and retail engagement
Industrial Digital-Twin Overlays 24.30% CAGR (2026–2035) Real-time IoT data integration
Other Applications USD 16.80 Billion (2025) Navigation, training, marketing


Remote assistance remains the largest single application in the Augmented Reality Market, driven by measurable ROI in aerospace, energy, and heavy-equipment maintenance. Industrial digital-twin overlays represent the fastest-growing application as manufacturers integrate real-time sensor feeds into spatially anchored dashboards that production supervisors access via headsets on the factory floor.

By End-User Vertical

Segment Key Metric Primary Demand Driver
Gaming and Entertainment 33.70% share (2025) Consumer headset installed base
Healthcare 28.60% CAGR (2026–2035) Surgical-navigation regulatory approvals
Education USD 12.90 Billion (2025) Immersive STEM and vocational training
Automotive and Transportation USD 10.80 Billion (2025) HUD integration and design review
Other Verticals 18.20% share (2025) Retail, defense, real estate


Gaming and entertainment remains the largest end-user vertical in the Augmented Reality Market, sustained by a growing library of spatial-computing titles and social-VR crossover experiences. Healthcare is the standout growth vertical: the FDA's expanding clearance pipeline for AR-guided surgical tools and diagnostic systems is converting clinical skepticism into institutional procurement budgets [11].


Regional Market Share Analysis

Region Key Metric Primary Investment Themes
North America 41.30% share (2025) Defense procurement, big-tech R&D, healthcare clearances
Europe 25.70% share (2025) Automotive HUDs, EU digital-industry policy, privacy regulation
Asia-Pacific 27.80% CAGR (2026–2035) Smart manufacturing, mobile AR commerce, government digitization
South America USD 4.83 Billion (2025) Mobile-first consumer AR, e-commerce visualization
Middle East & Africa USD 4.50 Billion (2025) Oil & gas field service, smart-city initiatives
Total USD 107.30 Billion (2025)

The Augmented Reality Market exhibits a concentrated regional profile, with North America and Asia-Pacific together accounting for more than two-thirds of global revenue. Enterprise procurement maturity, 5G infrastructure density, and consumer headset adoption rates are the primary differentiators across regions.


North America

Country Key Metric Key Driver
US 78.50% of regional share DoD IVAS program and Silicon Valley R&D
Canada 12.30% of regional share Mining and energy field-service adoption
Mexico 9.20% of regional share Automotive-manufacturing AR training


The United States dominates the North American Augmented Reality Market through a combination of defense-sector anchor contracts, venture-capital density, and the concentration of leading hardware OEMs. Canada's extractive industries are increasingly deploying AR overlays for remote-site maintenance, while Mexico's automotive-assembly corridor benefits from AR-guided quality-inspection programs rolled out by multinational manufacturers [4].

Europe

Country Key Metric Key Driver
Germany 26.40% of regional share Automotive OEM production-line AR
UK 19.80% of regional share Fintech and retail visualization
France 15.10% of regional share Aerospace and defense AR programs
Italy 10.20% of regional share Luxury-goods and design visualization
Spain 7.50% of regional share Tourism and cultural-heritage AR
Nordic Countries 8.30% CAGR premium vs. region Telecom-led 5G AR pilots
Russia USD 1.20 Billion (2025) Industrial and energy-sector applications
Rest of Europe 9.70% of regional share Varied enterprise pilots


Germany's automotive giants are embedding AR into production workflows across more than 30 plants, while the UK's retail and financial-services sectors are adopting AR-powered customer-engagement tools. France's Dassault Aviation and Airbus have multi-year AR maintenance programs. The EU's Horizon Europe framework allocated EUR 1.3 Billion to immersive-technology research between 2023 and 2027, reinforcing the Augmented Reality Market infrastructure across the continent [17].

Asia-Pacific

Country Key Metric Key Driver
China 38.50% of regional share Government smart-manufacturing policy
India 28.90% CAGR (2026–2035) Mobile AR commerce and EdTech
Japan USD 4.10 Billion (2025) Robotics integration and gaming
South Korea 13.20% of regional share 5G-first telecom AR services
ASEAN 24.80% CAGR (2026–2035) E-commerce and tourism
Rest of Asia-Pacific 7.60% of regional share Government digitization programs


China's "Made in China 2025" successor initiatives and generous provincial subsidies for smart-factory equipment have made the country the largest single-nation contributor to the Asia-Pacific Augmented Reality Market. India's massive smartphone user base — exceeding 900 million by 2025 — positions it as the fastest-growing country market, with mobile-delivered AR experiences in e-commerce and education driving adoption [14].

South America

Country Key Metric Key Driver
Brazil 58.40% of regional share Retail AR and agritech pilots
Argentina 21.30% of regional share Education-sector AR trials
Rest of South America 20.30% of regional share Mining and resource-sector applications


Brazil's large consumer-goods market and expanding 5G footprint position it as the regional leader. Retailers in São Paulo and Rio de Janeiro are piloting AR try-on experiences for fashion and cosmetics, while agritech companies are testing AR-guided crop-monitoring overlays for precision farming in the Cerrado region [14].

Middle East & Africa

Country Key Metric Key Driver
Saudi Arabia 31.20% of regional share NEOM and Vision 2030 smart-city projects
UAE 28.50% of regional share Tourism, real estate, and retail AR
South Africa 16.70% of regional share Mining and industrial safety overlays
Egypt 10.80% of regional share Cultural-heritage and tourism AR
Rest of MEA 12.80% of regional share Oil & gas remote-assistance programs


Saudi Arabia's Vision 2030 megaprojects, particularly NEOM, have allocated billions to immersive-technology infrastructure, creating anchor demand for the Augmented Reality Market in the region. The UAE's tourism and luxury-real-estate sectors are early adopters of AR-powered property visualization and destination experiences [14].


Augmented Reality Market By Region, 2025-2035

Competitive Benchmarking

The Augmented Reality Market exhibits medium concentration, with the top five companies controlling an estimated 48–55% of global revenue. The Herfindahl-Hirschman Index sits in the moderately concentrated range (~1,200–1,500), reflecting a mix of vertically integrated big-tech players and specialized AR-platform vendors. Competition intensifies as consumer-electronics giants leverage ecosystem advantages while startups differentiate on vertical-specific solutions.

Company Est. Revenue Share Range Key Offerings Strategic Positioning
Microsoft Corporation ~12–15% HoloLens 2, Mesh, Dynamics 365 Remote Assist Enterprise-first; defense anchor (IVAS)
Apple Inc. ~10–13% Vision Pro, ARKit, RealityKit Premium spatial computing; ecosystem lock-in
Meta Platforms Inc. ~9–12% Quest headsets, Spark AR, Horizon OS Volume consumer play; subsidized hardware
Google LLC ~7–10% ARCore, Google Lens, Project Starline Mobile AR platform; advertising integration
Qualcomm Technologies ~5–8% Snapdragon XR Gen 3, AR Smart Viewer reference Chipset and reference-design enabler
PTC Inc. ~4–6% Vuforia Suite, Vuforia Expert Capture Industrial AR software leader
Magic Leap Inc. ~3–5% Magic Leap 2 Enterprise headset; healthcare and defense
Snap Inc. ~2–4% Spectacles, Lens Studio, AR Enterprise Services Consumer social AR; developer community
Seiko Epson Corporation ~2–3% Moverio smart glasses Lightweight industrial and drone-piloting AR
Niantic Inc. ~1–3% Lightship platform, 8th Wall Location-based AR; developer tools


Recent News & Developments


  • Microsoft (January 2025): Delivered initial IVAS 1.2 headsets to U.S. Army units following design revisions addressing field-reliability concerns raised during operational testing [14].


  • Qualcomm (September 2024): Released Snapdragon XR Gen 3 reference design enabling OEMs to produce sub-100-gram AR smart glasses with six-hour battery life [6].
  • Google (June 2024): Integrated ARCore Geospatial API with Google Maps for indoor-navigation overlays across 5,000 commercial venues globally [3].
  • Magic Leap (February 2024): Secured a USD 500 Million Series F round led by a sovereign-wealth fund, earmarked for healthcare and defense vertical expansion [11].
  • Snap Inc. (October 2023): Opened its fifth-generation AR Spectacles developer program to enterprise clients, targeting field-service and retail use cases in the Augmented Reality Market [16].


Augmented Reality Market Report Scope

Parameter Detail
Market Scope Global Augmented Reality Market covering hardware, software, core display technologies, applications, end-user verticals, and 42 country-level models
Study Period 2021–2035
CAGR 23.40% (2026–2035)
Base Year Market Size USD 107.30 Billion (2025)
Forecast Endpoint USD 889.90 Billion (2035)
Fastest Growing Segment Healthcare end-user vertical (28.60% CAGR)
Companies Profiled Microsoft, Apple, Meta, Google, Qualcomm, PTC, Magic Leap, Snap, Epson, Niantic
Valuation Currency USD Billion

FAQs

What minimum bandwidth does an enterprise AR deployment require for reliable performance?
Most enterprise AR headsets need a sustained 50–100 Mbps downlink with sub-20 ms latency for real-time spatial anchoring. Wi-Fi 6E or private 5G networks are the preferred connectivity layers in factory and hospital settings [6].
How do procurement teams typically structure AR pilot-to-production contracts?
Buyers usually begin with a 90-day paid pilot covering 20–50 devices, then negotiate three-year SaaS licenses tied to per-seat or per-site pricing. Hardware refresh clauses every 24 months are increasingly standard [7].
Which display technology offers the best outdoor visibility for industrial AR glasses?
MicroLED delivers peak brightness above 10,000 nits, far exceeding OLED's 1,500-nit ceiling, making it the preferred choice for outdoor field-service and construction applications [13].
What cybersecurity standards apply to AR headsets used in classified government environments?
Devices must meet FIPS 140-3 encryption and achieve Authority to Operate under NIST RMF. The IVAS program's security architecture serves as the current benchmark [14].
How are AR software vendors differentiating beyond basic overlay features?
Leading platforms now embed spatial analytics, gaze-heat-mapping, and workflow-compliance scoring, turning passive overlays into active process-optimization engines that justify premium subscription tiers [7].
What intellectual-property risks should enterprises evaluate before deploying AR in shared facilities?
Outward-facing cameras can inadvertently capture third-party trade secrets or biometric data. Enterprises should implement geofenced camera-disable zones and conduct data-protection impact assessments under GDPR Article 35 [17].
How does the Augmented Reality Market total cost of ownership compare to traditional training methods over five years?
AR-based training typically breaks even within 18 months and delivers 30–40% lower total cost over five years versus classroom instruction, driven by reduced travel, faster onboarding, and lower error rates [12].    
Author
Author
Author Profile
Ankit Gupta LinkedIn
Team Lead - Research
Ankit Gupta is a seasoned market intelligence and strategic research professional with over six plus years of experience in the ICT and Semiconductor industries. With academic roots in Telecom, Marketing, and Electronics, he blends technical insight with business strategy. Ankit has led 200+ projects, including work for Fortune 500 clients like Microsoft and Rio Tinto, covering market sizing, tech forecasting, and go-to-market strategies. Known for bridging engineering and enterprise decision-making, his insights support growth, innovation, and investment planning across diverse technology markets.

Research Approach


Secondary Research

The secondary research process involved comprehensive analysis of technology regulatory databases, peer-reviewed engineering journals, patent repositories, and authoritative technology research organizations. Key sources included the US Federal Communications Commission (FCC), National Institute of Standards and Technology (NIST), European Telecommunications Standards Institute (ETSI), International Organization for Standardization (ISO), Institute of Electrical and Electronics Engineers (IEEE) Xplore Digital Library, Association for Computing Machinery (ACM) Digital Library, National Science Foundation (NSF) Technology Reports, US Patent and Trademark Office (USPTO), European Patent Office (EPO), World Intellectual Property Organization (WIPO) Patent Database, International Data Corporation (IDC) Technology Reports, Gartner Research, Counterpoint Research, Organisation for Economic Co-operation and Development (OECD) Digital Economy Outlook, and national digital transformation initiatives from key markets. These sources were used to collect technology adoption statistics, regulatory compliance data, patent filing trends, hardware shipment volumes, software development frameworks analysis, and competitive landscape assessment for head-mounted displays, head-up displays, marker-based systems, and marker-less AR technologies across consumer electronics, commercial, aerospace & defense, and medical verticals.


Primary Research

In order to gather both qualitative and quantitative insights, supply-side and demand-side stakeholders were interviewed during the primary research process. CEOs, CTOs, VPs of Hardware Engineering, heads of AR/VR product divisions, software architects, and commercial directors from AR device manufacturers, optical component suppliers, semiconductor companies, and software platform developers were examples of supply-side sources. Chief innovation officers, directors of training simulations from aerospace and defense contractors, medical technology officers from healthcare organizations, retail experience designers, and procurement leads from enterprise end-users in the manufacturing, automotive, and educational sectors were among the demand-side sources. Primary research verified product development roadmaps, validated market segmentation across device kinds and sectors, and gathered information on pricing structures, ecosystem collaborations, enterprise deployment strategies, and obstacles to technology uptake.

Primary Respondent Breakdown:

By Designation: C-level Primaries (28%), Director Level (35%), Others (37%)

By Region: North America (40%), Europe (25%), Asia-Pacific (28%), Rest of World (7%)


Market Size Estimation

Global market valuation was derived through revenue mapping, device shipment analysis, and software licensing value assessment. The methodology included:

Identification of 55+ key technology providers across North America, Europe, Asia-Pacific, and Latin America

Product mapping across head-mounted displays (tethered, standalone, mobile-dependent), head-up displays (automotive, aerospace, industrial), marker-based AR (image recognition, QR code-based), and marker-less AR (SLAM-based, location-based, projection-based) technologies

Analysis of reported and modeled annual revenues specific to AR hardware portfolios, software platforms, and content development tools

Coverage of technology providers representing 75-80% of global market share in 2024

Extrapolation using bottom-up (device shipment volumes × ASP by category and region plus software/services attach rates) and top-down (ecosystem revenue validation across semiconductor, display, sensor, and software layers) approaches to derive segment-specific valuations for consumer electronics, commercial enterprise, aerospace & defense, and medical verticals

Download Free Sample

Kindly complete the form below to receive a free sample of this Report

* Please use a valid business email

Download PDF ×

We do not share your information with anyone. However, we may send you emails based on your report interest from time to time. You may contact us at any time to opt-out.
















