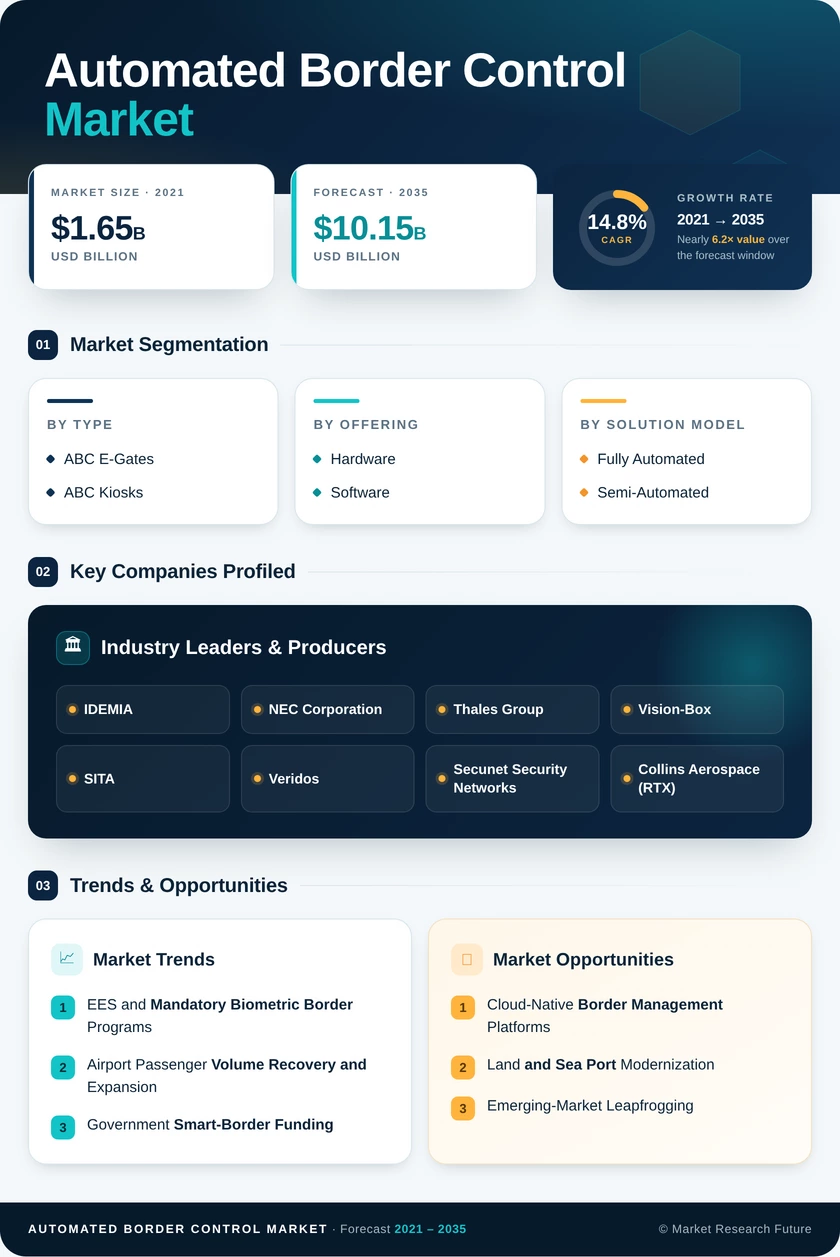
Automated Border Control Market (2026 - 2035)

ID: MRFR/AD/3241-CR
134 Pages
Shubham Munde
Last Updated: June 26, 2026
Automated Border Control Market Size, Share, Industry Trend & Analysis Research Report Information By Type (ABC E-Gates, ABC Kiosks), By Offering (Hardware, Software), By Solution Model (Fully Automated, Semi-Automated), By Mode of Operation (One-Step Process, Two-Step Process), By End-Use Application (Airports, Land Ports, Seaports), By Deployment (On-Premises, Cloud-Based), By Throughput Capacity (<200 Passengers/Hour, 200–400 Passengers/Hour, >400 Passengers/Hour) – Forecast Till 2035
Automated Border Control Market
Market Size
Forecast Period2026-2035
CAGR (2026-2035)14.8%
2025 Market SizeUSD 2.52 Billion
2035 Market SizeUSD 10.15 Billion
Key Players
IDEMIA
NEC Corporation
Thales Group
Vision-Box
SITA
Veridos
Opportunities
  • Cloud-Native Border Management Platforms
  • Land and Sea Port Modernization
  • Emerging-Market Leapfrogging
  1. 1 Market Overview |
    1. 1.1 Study Assumptions & Market Definition |
    2. 1.2 Scope of the Study |
    3. 1.3 Research Methodology
  2. 2 Market Summary & Key Takeaways
  3. 3 Market Dynamics |
    1. 3.1 Market Drivers Analysis | |
      1. 3.1.1 EES & Mandatory Biometric Border Programs | |
      2. 3.1.2 Airport Passenger Volume Recovery and Expansion | |
      3. 3.1.3 Government Smart-Border Funding | |
      4. 3.1.4 AI & Facial Recognition Advances | |
      5. 3.1.5 Geopolitical Threat Escalation | |
      6. 3.1.6 Cloud Migration of Border IT Systems | |
      7. 3.1.7 ICAO & ISO Interoperability Standards |
    2. 3.2 Market Restraints Analysis | |
      1. 3.2.1 Data Privacy Regulations (GDPR, BIPA) | |
      2. 3.2.2 High Upfront Infrastructure Cost | |
      3. 3.2.3 Interoperability Gaps Across Systems | |
      4. 3.2.4 Biometric Spoofing & Cybersecurity Risks | |
      5. 3.2.5 Public Resistance to Facial Recognition |
    3. 3.3 Market Opportunity Analysis | |
      1. 3.3.1 Cloud-Native Border Management Platforms | |
      2. 3.3.2 Land and Sea Port Modernization | |
      3. 3.3.3 Emerging-Market Leapfrogging | |
      4. 3.3.4 Data Monetization and Traveler-Experience Analytics | |
      5. 3.3.5 Multi-Modal Biometric Fusion |
    4. 3.4 Industry Value Chain Analysis |
    5. 3.5 Porter's Five Forces Analysis
  4. 4 Global Automated Border Control Market Size & Forecast (2021–2035) |
    1. 4.1 Historical Market Size (2021–2025) |
    2. 4.2 Current & Forecast Market Size (2026–2035) |
    3. 4.3 Market Size by Revenue (USD Billion) |
    4. 4.4 Year-over-Year Growth Analysis
  5. 5 Segmentation Analysis |
    1. 5.1 By Type | |
      1. 5.1.1 ABC E-Gates | |
      2. 5.1.2 ABC Kiosks |
    2. 5.2 By Offering | |
      1. 5.2.1 Hardware | |
      2. 5.2.2 Software |
    3. 5.3 By Solution Model | |
      1. 5.3.1 Fully Automated | |
      2. 5.3.2 Semi-Automated |
    4. 5.4 By Mode of Operation | |
      1. 5.4.1 One-Step Process | |
      2. 5.4.2 Two-Step Process |
    5. 5.5 By End-Use Application | |
      1. 5.5.1 Airports | |
      2. 5.5.2 Land Ports | |
      3. 5.5.3 Seaports |
    6. 5.6 By Deployment | |
      1. 5.6.1 On-Premises | |
      2. 5.6.2 Cloud-Based |
    7. 5.7 By Throughput Capacity | |
      1. 5.7.1 Less Than 200 Passengers/Hour | |
      2. 5.7.2 200–400 Passengers/Hour | |
      3. 5.7.3 More Than 400 Passengers/Hour
  6. 6 Regional Analysis |
    1. 6.1 North America | |
      1. 6.1.1 United States | |
      2. 6.1.2 Canada | |
      3. 6.1.3 Mexico |
    2. 6.2 Europe | |
      1. 6.2.1 Germany | |
      2. 6.2.2 United Kingdom | |
      3. 6.2.3 France | |
      4. 6.2.4 Italy | |
      5. 6.2.5 Spain | |
      6. 6.2.6 Nordic Countries | |
      7. 6.2.7 Russia | |
      8. 6.2.8 Rest of Europe |
    3. 6.3 Asia-Pacific | |
      1. 6.3.1 China | |
      2. 6.3.2 India | |
      3. 6.3.3 Japan | |
      4. 6.3.4 South Korea | |
      5. 6.3.5 ASEAN | |
      6. 6.3.6 Rest of Asia-Pacific |
    4. 6.4 South America | |
      1. 6.4.1 Brazil | |
      2. 6.4.2 Argentina | |
      3. 6.4.3 Rest of South America |
    5. 6.5 Middle East & Africa | |
      1. 6.5.1 Saudi Arabia | |
      2. 6.5.2 UAE | |
      3. 6.5.3 South Africa | |
      4. 6.5.4 Egypt | |
      5. 6.5.5 Rest of MEA
  7. 7 Competitive Landscape |
    1. 7.1 Market Share Analysis (2025) |
    2. 7.2 Competitive Benchmarking Matrix |
    3. 7.3 Company Profiles | |
      1. 7.3.1 IDEMIA | |
      2. 7.3.2 NEC Corporation | |
      3. 7.3.3 Thales Group | |
      4. 7.3.4 Vision-Box | |
      5. 7.3.5 SITA | |
      6. 7.3.6 Veridos | |
      7. 7.3.7 Secunet Security Networks | |
      8. 7.3.8 Collins Aerospace (RTX) | |
      9. 7.3.9 Leidos | |
      10. 7.3.10 Smiths Detection
  8. 8 Future Outlook & Strategic Recommendations (2026–2035) |
    1. 8.1 AI-Autonomous Border Operations |
    2. 8.2 Platform Economics and Border-as-a-Service |
    3. 8.3 Digital Travel Credentials and Decentralized Identity |
    4. 8.4 Inclusive Design and Accessibility Mandates
  9. 9 Recent Developments & News
  10. 10 Frequently Asked Questions (FAQs)
  11. 11 Report Scope & Methodology |
    1. 11.1 Study Period & Base Year |
    2. 11.2 Data Sources & Citations |
    3. 11.3 Abbreviations
  12. 12 LIST OF TABLES |
  13. TABLE 1 Global Automated Border Control Market Size & Forecast, by Revenue (USD Billion), 2021–2035 |
  14. TABLE 2 Global Automated Border Control Market — Year-over-Year Growth Analysis, 2021–2035 |
  15. TABLE 3 Global Automated Border Control Market — Driver Impact Analysis |
  16. TABLE 4 Global Automated Border Control Market — Restraint Impact Analysis |
  17. TABLE 5 Global Automated Border Control Market Size, by Type, 2021–2035 (USD Billion) |
  18. TABLE 6 Global Automated Border Control Market Size, by Offering, 2021–2035 (USD Billion) |
  19. TABLE 7 Global Automated Border Control Market Size, by Solution Model, 2021–2035 (USD Billion) |
  20. TABLE 8 Global Automated Border Control Market Size, by Mode of Operation, 2021–2035 (USD Billion) |
  21. TABLE 9 Global Automated Border Control Market Size, by End-Use Application, 2021–2035 (USD Billion) |
  22. TABLE 10 Global Automated Border Control Market Size, by Deployment, 2021–2035 (USD Billion) |
  23. TABLE 11 Global Automated Border Control Market Size, by Throughput Capacity, 2021–2035 (USD Billion) |
  24. TABLE 12 Global Automated Border Control Market Size, by Region, 2021–2035 (USD Billion) |
  25. TABLE 13 North America Automated Border Control Market Size, by Country, 2021–2035 (USD Billion) |
  26. TABLE 14 Europe Automated Border Control Market Size, by Country, 2021–2035 (USD Billion) |
  27. TABLE 15 Asia-Pacific Automated Border Control Market Size, by Country, 2021–2035 (USD Billion) |
  28. TABLE 16 South America Automated Border Control Market Size, by Country, 2021–2035 (USD Billion) |
  29. TABLE 17 Middle East & Africa Automated Border Control Market Size, by Country, 2021–2035 (USD Billion) |
  30. TABLE 18 Competitive Benchmarking Matrix — Global Automated Border Control Market, 2025 |
  31. TABLE 19 Company Profiles — Key Players, Global Automated Border Control Market |
  32. TABLE 20 Recent Developments & Strategic Announcements, 2023–2025 |
  33. TABLE 21 Report Scope & Methodology Summary |
  34. TABLE 22 Detailed Sources and Citations |
  35. TABLE 23 North America Automated Border Control Market Size, by Type, 2021–2035 (USD Billion) |
  36. TABLE 24 North America Automated Border Control Market Size, by Offering, 2021–2035 (USD Billion) |
  37. TABLE 25 North America Automated Border Control Market Size, by Solution Model, 2021–2035 (USD Billion) |
  38. TABLE 26 North America Automated Border Control Market Size, by Mode of Operation, 2021–2035 (USD Billion) |
  39. TABLE 27 North America Automated Border Control Market Size, by End-Use Application, 2021–2035 (USD Billion) |
  40. TABLE 28 North America Automated Border Control Market Size, by Deployment, 2021–2035 (USD Billion) |
  41. TABLE 29 North America Automated Border Control Market Size, by Throughput Capacity, 2021–2035 (USD Billion) |
  42. TABLE 30 Europe Automated Border Control Market Size, by Type, 2021–2035 (USD Billion) |
  43. TABLE 31 Europe Automated Border Control Market Size, by Offering, 2021–2035 (USD Billion) |
  44. TABLE 32 Europe Automated Border Control Market Size, by Solution Model, 2021–2035 (USD Billion) |
  45. TABLE 33 Europe Automated Border Control Market Size, by Mode of Operation, 2021–2035 (USD Billion) |
  46. TABLE 34 Europe Automated Border Control Market Size, by End-Use Application, 2021–2035 (USD Billion) |
  47. TABLE 35 Europe Automated Border Control Market Size, by Deployment, 2021–2035 (USD Billion) |
  48. TABLE 36 Europe Automated Border Control Market Size, by Throughput Capacity, 2021–2035 (USD Billion) |
  49. TABLE 37 Asia-Pacific Automated Border Control Market Size, by Type, 2021–2035 (USD Billion) |
  50. TABLE 38 Asia-Pacific Automated Border Control Market Size, by Offering, 2021–2035 (USD Billion) |
  51. TABLE 39 Asia-Pacific Automated Border Control Market Size, by Solution Model, 2021–2035 (USD Billion) |
  52. TABLE 40 Asia-Pacific Automated Border Control Market Size, by Mode of Operation, 2021–2035 (USD Billion) |
  53. TABLE 41 Asia-Pacific Automated Border Control Market Size, by End-Use Application, 2021–2035 (USD Billion) |
  54. TABLE 42 Asia-Pacific Automated Border Control Market Size, by Deployment, 2021–2035 (USD Billion) |
  55. TABLE 43 Asia-Pacific Automated Border Control Market Size, by Throughput Capacity, 2021–2035 (USD Billion) |
  56. TABLE 44 South America Automated Border Control Market Size, by Type, 2021–2035 (USD Billion) |
  57. TABLE 45 South America Automated Border Control Market Size, by Offering, 2021–2035 (USD Billion) |
  58. TABLE 46 South America Automated Border Control Market Size, by Solution Model, 2021–2035 (USD Billion) |
  59. TABLE 47 South America Automated Border Control Market Size, by Mode of Operation, 2021–2035 (USD Billion) |
  60. TABLE 48 South America Automated Border Control Market Size, by End-Use Application, 2021–2035 (USD Billion) |
  61. TABLE 49 South America Automated Border Control Market Size, by Deployment, 2021–2035 (USD Billion) |
  62. TABLE 50 South America Automated Border Control Market Size, by Throughput Capacity, 2021–2035 (USD Billion) |
  63. TABLE 51 Middle East & Africa Automated Border Control Market Size, by Type, 2021–2035 (USD Billion) |
  64. TABLE 52 Middle East & Africa Automated Border Control Market Size, by Offering, 2021–2035 (USD Billion) |
  65. TABLE 53 Middle East & Africa Automated Border Control Market Size, by Solution Model, 2021–2035 (USD Billion) |
  66. TABLE 54 Middle East & Africa Automated Border Control Market Size, by Mode of Operation, 2021–2035 (USD Billion) |
  67. TABLE 55 Middle East & Africa Automated Border Control Market Size, by End-Use Application, 2021–2035 (USD Billion) |
  68. TABLE 56 Middle East & Africa Automated Border Control Market Size, by Deployment, 2021–2035 (USD Billion) |
  69. TABLE 57 Middle East & Africa Automated Border Control Market Size, by Throughput Capacity, 2021–2035 (USD Billion) |
  70. TABLE 58 United States Automated Border Control Market Size, by Type, 2021–2035 (USD Billion) |
  71. TABLE 59 United States Automated Border Control Market Size, by Offering, 2021–2035 (USD Billion) |
  72. TABLE 60 United States Automated Border Control Market Size, by Solution Model, 2021–2035 (USD Billion) |
  73. TABLE 61 United States Automated Border Control Market Size, by End-Use Application, 2021–2035 (USD Billion) |
  74. TABLE 62 Canada Automated Border Control Market Size, by Type, 2021–2035 (USD Billion) |
  75. TABLE 63 Canada Automated Border Control Market Size, by Offering, 2021–2035 (USD Billion) |
  76. TABLE 64 Mexico Automated Border Control Market Size, by Type, 2021–2035 (USD Billion) |
  77. TABLE 65 Germany Automated Border Control Market Size, by Type, 2021–2035 (USD Billion) |
  78. TABLE 66 United Kingdom Automated Border Control Market Size, by Type, 2021–2035 (USD Billion) |
  79. TABLE 67 France Automated Border Control Market Size, by Type, 2021–2035 (USD Billion) |
  80. TABLE 68 China Automated Border Control Market Size, by Type, 2021–2035 (USD Billion) |
  81. TABLE 69 India Automated Border Control Market Size, by Type, 2021–2035 (USD Billion) |
  82. TABLE 70 Japan Automated Border Control Market Size, by Type, 2021–2035 (USD Billion) |
  83. TABLE 71 South Korea Automated Border Control Market Size, by Type, 2021–2035 (USD Billion) |
  84. TABLE 72 Brazil Automated Border Control Market Size, by Type, 2021–2035 (USD Billion) |
  85. TABLE 73 Saudi Arabia Automated Border Control Market Size, by Type, 2021–2035 (USD Billion) |
  86. TABLE 74 UAE Automated Border Control Market Size, by Type, 2021–2035 (USD Billion)
  87. 13 LIST OF FIGURES |
  88. FIGURE 1 Global Automated Border Control Market Dynamics — Drivers, Restraints, and Opportunities |
  89. FIGURE 2 Industry Value Chain Analysis — Automated Border Control Market |
  90. FIGURE 3 Porter's Five Forces Analysis — Automated Border Control Market |
  91. FIGURE 4 Global Automated Border Control Market Size Trend (USD Billion), 2021–2035 |
  92. FIGURE 5 Global Automated Border Control Market Share, by Type, 2025 |
  93. FIGURE 6 Global Automated Border Control Market Share, by Offering, 2025 |
  94. FIGURE 7 Global Automated Border Control Market Share, by Solution Model, 2025 |
  95. FIGURE 8 Global Automated Border Control Market Share, by Mode of Operation, 2025 |
  96. FIGURE 9 Global Automated Border Control Market Share, by End-Use Application, 2025 |
  97. FIGURE 10 Global Automated Border Control Market Share, by Deployment, 2025 |
  98. FIGURE 11 Global Automated Border Control Market Share, by Throughput Capacity, 2025 |
  99. FIGURE 12 Global Automated Border Control Market Share, by Region, 2025 |
  100. FIGURE 13 North America Automated Border Control Market Share, by Country, 2025 |
  101. FIGURE 14 Europe Automated Border Control Market Share, by Country, 2025 |
  102. FIGURE 15 Asia-Pacific Automated Border Control Market Share, by Country, 2025 |
  103. FIGURE 16 South America Automated Border Control Market Share, by Country, 2025 |
  104. FIGURE 17 Middle East & Africa Automated Border Control Market Share, by Country, 2025 |
  105. FIGURE 18 Competitive Landscape — Market Share of Key Players, 2025 |
  106. FIGURE 19 Competitive Positioning Matrix — Automated Border Control Market, 2025

SEGMENTATION QUICK REFERENCE

DimensionSub-SegmentsDominant SegmentFastest Growing Segment
By TypeABC E-Gates, ABC KiosksABC E-GatesABC Kiosks
By OfferingHardware, Automated Border Control MarketHardwareAutomated Border Control Market
By Solution ModelFully Automated, Semi-AutomatedFully AutomatedSemi-Automated
By Mode of OperationOne-Step Process, Two-Step ProcessOne-Step ProcessTwo-Step Process
By End-Use ApplicationAirports, Land Ports, SeaportsAirportsLand Ports
By DeploymentOn-Premises, Cloud-BasedOn-PremisesCloud-Based
By Throughput Capacity<200 Passengers/Hour, 200–400 Passengers/Hour, >400 Passengers/Hour200–400 Passengers/Hour>400 Passengers/Hour


MARKET SEGMENTATION OVERVIEW

By Type

Sub-SegmentKey Trend
ABC E-GatesFull-height lane systems with integrated document readers dominate airport terminals globally
ABC KiosksCompact, relocatable units gaining share at land borders, cruise terminals, and space-constrained facilities


E-gates remain the backbone of airport-based automated border processing due to their high throughput and supervised-lane architecture. Kiosks offer flexibility for non-traditional deployment environments and are increasingly selected for emerging-market rollouts where civil-works budgets are limited.

By Offering

Sub-SegmentKey Trend
HardwareCameras, biometric sensors, document readers, and physical enclosures still dominate initial procurement spend
Automated Border Control MarketCloud-hosted identity platforms, AI analytics, and predictive risk-scoring engines are the fastest-growing revenue stream


The hardware-to-software revenue ratio is gradually shifting as agencies transition from first-time installations to lifecycle management and continuous algorithm upgrades under multiyear service agreements.

By Solution Model

Sub-SegmentKey Trend
Fully AutomatedEnd-to-end identity verification without officer intervention, preferred for high-volume airports
Semi-AutomatedHuman-in-the-loop oversight retained for regulatory compliance in high-security or emerging markets


Fully automated systems deliver the lowest cost-per-transaction and highest throughput, while semi-automated configurations serve as a transitional architecture for agencies building operational confidence in unsupervised processing.

By Mode of Operation

Sub-SegmentKey Trend
One-Step ProcessSimultaneous document and biometric verification in a single interaction, maximizing speed
Two-Step ProcessSequential verification stages adding security depth, preferred at land borders and high-threat environments


One-step architectures dominate airport deployments where throughput efficiency is paramount. Two-step systems are gaining traction in scenarios requiring vehicle-to-pedestrian transitions or multi-layered identity checks.

By End-Use Application

Sub-SegmentKey Trend
AirportsLargest revenue contributor, driven by international passenger volumes and terminal modernization programs
Land PortsFastest-growing segment as EES and CBP mandates extend automated processing to terrestrial border crossings
SeaportsEmerging niche driven by cruise terminal expansion and port security upgrades


Airport deployments will continue to represent the majority of spending, but land port modernization represents the largest incremental growth opportunity over the forecast period.

By Deployment

Sub-SegmentKey Trend
On-PremisesDominant model due to national-security data sovereignty requirements for biometric information
Cloud-BasedGrowing as hybrid architectures enable centralized management of distributed border installations


The shift toward cloud will be gradual and architecture-specific — biometric processing will likely remain on-premises while analytics, reporting, and watch-list synchronization migrate to cloud environments.

By Throughput Capacity

Sub-SegmentKey Trend
<200 Passengers/HourSuited for secondary inspection lanes, small regional airports, and low-volume land crossings
200–400 Passengers/HourStandard specification for international airport terminals, representing the largest installed base
>400 Passengers/HourHigh-speed systems deployed at mega-hubs processing peak volumes exceeding 50 million annual passengers


Mega-hub airports with growing transit traffic are driving demand for ultra-high-throughput systems that integrate parallel processing lanes and predictive queue management.


 

Download PDF ×

We do not share your information with anyone. However, we may send you emails based on your report interest from time to time. You may contact us at any time to opt-out.