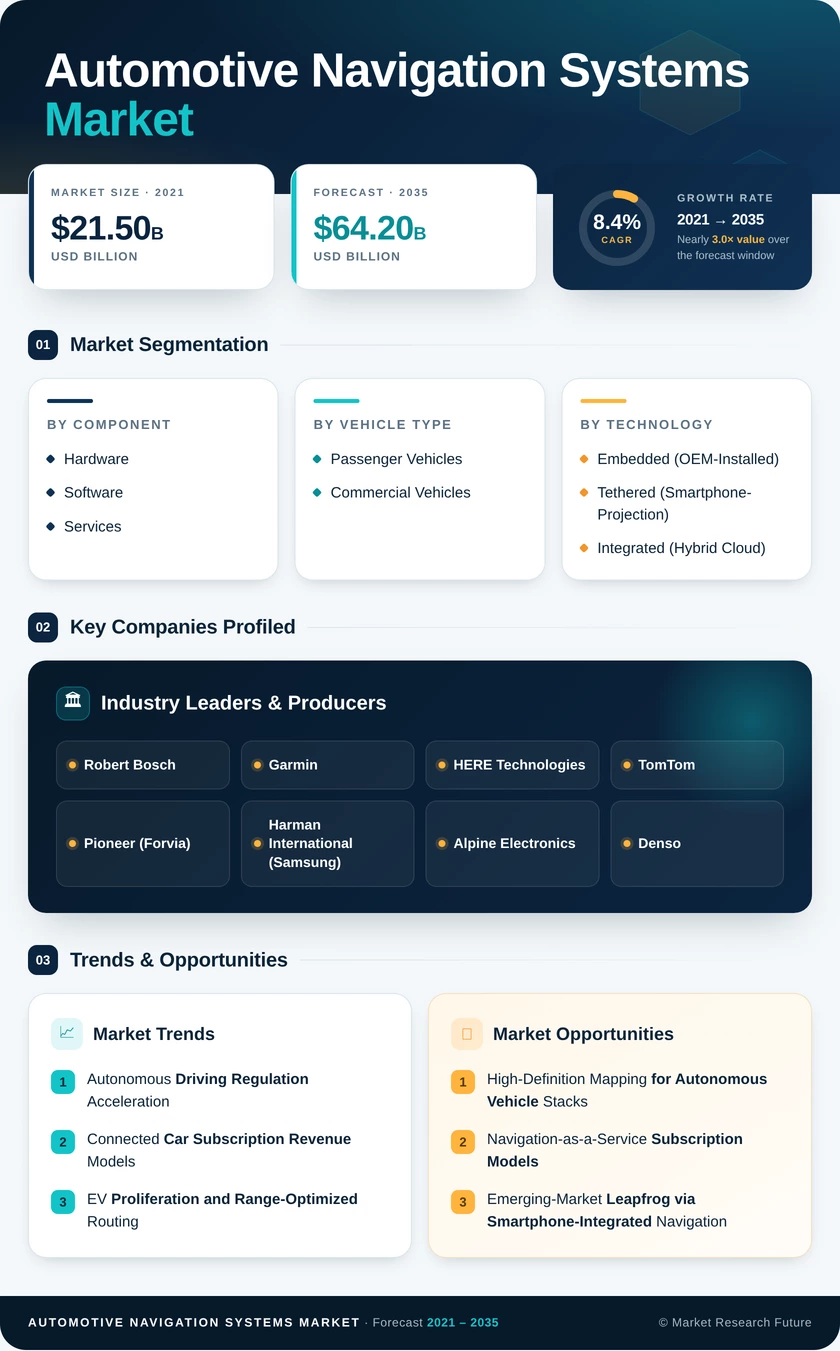
Automotive Navigation Systems Market (2025 - 2035)

ID: MRFR/AT/6393-CR
100 Pages
Shubham Munde
Last Updated: August 04, 2026
Automotive Navigation Systems Market Research Report By Component (Hardware, Software, Services), By Vehicle Type (Passenger Vehicles, Commercial Vehicles), By Technology (Embedded (OEM-Installed), Tethered (Smartphone-Projection), Integrated (Hybrid Cloud)) and By Regional (North America, Europe, South America, Asia Pacific, Middle East and Africa) - Industry Forecast to 2035
Automotive Navigation Systems Market
Market Size
Forecast Period2025-2035
CAGR (2025-2035)8.4%
2025 Market SizeUSD 28.7 Billion
2035 Market SizeUSD 64.2 Billion
Key Players
Robert Bosch
Garmin
HERE Technologies
TomTom
Pioneer
Harman International
Opportunities
  • High-Definition Mapping for Autonomous Vehicle Stacks
  • Navigation-as-a-Service Subscription Models
  • Emerging-Market Leapfrog via Smartphone-Integrated Navigation
  1. 1 Market Overview |
    1. 1.1 Study Assumptions & Market Definition |
    2. 1.2 Scope of the Study |
    3. 1.3 Research Methodology
  2. 2 Market Summary & Key Takeaways
  3. 3 Market Dynamics |
    1. 3.1 Market Drivers Analysis | |
      1. 3.1.1 Autonomous Driving Regulation Acceleration | |
      2. 3.1.2 Connected Car Subscription Revenue Models | |
      3. 3.1.3 EV Proliferation and Range-Optimized Routing | |
      4. 3.1.4 Smart-City and V2X Infrastructure Investment | |
      5. 3.1.5 Smartphone Mirroring Platform Mandates | |
      6. 3.1.6 OTA Software Update Ecosystem Maturation | |
      7. 3.1.7 Fleet Management and Commercial Telematics Growth |
    2. 3.2 Market Restraints Analysis | |
      1. 3.2.1 Smartphone Substitution Effect | |
      2. 3.2.2 High Embedded System Cost Burden for OEMs | |
      3. 3.2.3 Data Privacy and Localization Regulations | |
      4. 3.2.4 Map Data Freshness and Accuracy Gaps | |
      5. 3.2.5 Cybersecurity Vulnerabilities in Connected Navigation |
    3. 3.3 Market Opportunity Analysis | |
      1. 3.3.1 High-Definition Mapping for Autonomous Vehicle Stacks | |
      2. 3.3.2 Navigation-as-a-Service Subscription Models | |
      3. 3.3.3 Emerging-Market Leapfrog via Smartphone-Integrated Navigation | |
      4. 3.3.4 EV Charging Network Integration and Data Monetization | |
      5. 3.3.5 Fleet and Commercial Vehicle Navigation Optimization |
    4. 3.4 Industry Value Chain Analysis |
    5. 3.5 Porter's Five Forces Analysis
  4. 4 Global Automotive Navigation Systems Market Size & Forecast (2021–2035) |
    1. 4.1 Historical Market Size (2021–2025) |
    2. 4.2 Current & Forecast Market Size (2026–2035) |
    3. 4.3 Market Size by Revenue (USD Billion) |
    4. 4.4 Year-over-Year Growth Analysis
  5. 5 Segmentation Analysis |
    1. 5.1 By Component | |
      1. 5.1.1 Hardware | |
      2. 5.1.2 Software | |
      3. 5.1.3 Services |
    2. 5.2 By Vehicle Type | |
      1. 5.2.1 Passenger Vehicles | |
      2. 5.2.2 Commercial Vehicles |
    3. 5.3 By Technology | |
      1. 5.3.1 Embedded (OEM-Installed) | |
      2. 5.3.2 Tethered (Smartphone-Projection) | |
      3. 5.3.3 Integrated (Hybrid Cloud)
  6. 6 Regional Analysis |
    1. 6.1 North America | |
      1. 6.1.1 United States | |
      2. 6.1.2 Canada | |
      3. 6.1.3 Mexico |
    2. 6.2 Europe | |
      1. 6.2.1 Germany | |
      2. 6.2.2 United Kingdom | |
      3. 6.2.3 France | |
      4. 6.2.4 Rest of Europe |
    3. 6.3 Asia-Pacific | |
      1. 6.3.1 China | |
      2. 6.3.2 Japan | |
      3. 6.3.3 India | |
      4. 6.3.4 South Korea | |
      5. 6.3.5 Rest of Asia-Pacific |
    4. 6.4 South America | |
      1. 6.4.1 Brazil | |
      2. 6.4.2 Argentina | |
      3. 6.4.3 Rest of South America |
    5. 6.5 Middle East & Africa | |
      1. 6.5.1 UAE | |
      2. 6.5.2 Saudi Arabia | |
      3. 6.5.3 Rest of Middle East & Africa
  7. 7 Competitive Landscape |
    1. 7.1 Market Share Analysis (2025) |
    2. 7.2 Competitive Benchmarking Matrix |
    3. 7.3 Company Profiles | |
      1. 7.3.1 Robert Bosch | |
      2. 7.3.2 Garmin | |
      3. 7.3.3 HERE Technologies | |
      4. 7.3.4 TomTom | |
      5. 7.3.5 Pioneer (Forvia) | |
      6. 7.3.6 Harman International (Samsung) | |
      7. 7.3.7 Alpine Electronics | |
      8. 7.3.8 Denso | |
      9. 7.3.9 Continental AG | |
      10. 7.3.10 Mitsubishi Electric
  8. 8 Future Outlook & Strategic Recommendations (2026–2035) |
    1. 8.1 AI-Powered Predictive Navigation |
    2. 8.2 Autonomous Vehicle Navigation Architecture |
    3. 8.3 Electrification and Energy-Aware Routing |
    4. 8.4 Data Sovereignty and Localized Navigation Ecosystems
  9. 9 Recent Developments & News
  10. 10 Frequently Asked Questions (FAQs)
  11. 11 Report Scope & Methodology |
    1. 11.1 Study Period & Base Year |
    2. 11.2 Data Sources & Citations |
    3. 11.3 Abbreviations
  12. 12 LIST OF TABLES |
  13. TABLE 1 Global Automotive Navigation Systems Market Size & Forecast, by Revenue (USD Billion), 2021–2035 |
  14. TABLE 2 Global Automotive Navigation Systems Market — Year-over-Year Growth Analysis, 2021–2035 |
  15. TABLE 3 Driver Impact Analysis — Automotive Navigation Systems Market, 2026–2035 |
  16. TABLE 4 Restraints Impact Analysis — Automotive Navigation Systems Market, 2026–2035 |
  17. TABLE 5 Regional Market Summary — Automotive Navigation Systems Market, 2025 |
  18. TABLE 6 North America Automotive Navigation Systems Market, by Country, 2021–2035 (USD Billion) |
  19. TABLE 7 Europe Automotive Navigation Systems Market, by Country, 2021–2035 (USD Billion) |
  20. TABLE 8 Asia-Pacific Automotive Navigation Systems Market, by Country, 2021–2035 (USD Billion) |
  21. TABLE 9 South America Automotive Navigation Systems Market, by Country, 2021–2035 (USD Billion) |
  22. TABLE 10 Middle East & Africa Automotive Navigation Systems Market, by Country, 2021–2035 (USD Billion) |
  23. TABLE 11 Global Automotive Navigation Systems Market, by Component, 2021–2035 (USD Billion) |
  24. TABLE 12 Global Automotive Navigation Systems Market, by Vehicle Type, 2021–2035 (USD Billion) |
  25. TABLE 13 Global Automotive Navigation Systems Market, by Technology, 2021–2035 (USD Billion) |
  26. TABLE 14 Competitive Benchmarking Matrix — Automotive Navigation Systems Market, 2025 |
  27. TABLE 15 Company Profiles — Key Players, Automotive Navigation Systems Market |
  28. TABLE 16 Recent Developments & Strategic Announcements, 2023–2025 |
  29. TABLE 17 Report Scope & Methodology Summary |
  30. TABLE 18 Detailed Sources and Citations
  31. 13 LIST OF FIGURES |
  32. FIGURE 1 Automotive Navigation Systems Market Dynamics — Drivers, Restraints, and Opportunities |
  33. FIGURE 2 Industry Value Chain Analysis — Automotive Navigation Systems Market |
  34. FIGURE 3 Porter's Five Forces Analysis — Automotive Navigation Systems Market |
  35. FIGURE 4 Global Automotive Navigation Systems Market Size Trend (USD Billion), 2021–2035 |
  36. FIGURE 5 Market Share by Component, 2025 (%) |
  37. FIGURE 6 Market Share by Vehicle Type, 2025 (%) |
  38. FIGURE 7 Market Share by Technology, 2025 (%) |
  39. FIGURE 8 Regional Market Share — Automotive Navigation Systems Market, 2025 (%) |
  40. FIGURE 9 North America Market Size Trend (USD Billion), 2021–2035 |
  41. FIGURE 10 Europe Market Size Trend (USD Billion), 2021–2035 |
  42. FIGURE 11 Asia-Pacific Market Size Trend (USD Billion), 2021–2035 |
  43. FIGURE 12 South America Market Size Trend (USD Billion), 2021–2035 |
  44. FIGURE 13 Middle East & Africa Market Size Trend (USD Billion), 2021–2035 |
  45. FIGURE 14 Competitive Landscape — Market Share Distribution, 2025

Segmentation Quick Reference

DimensionSub-SegmentsDominant SegmentFastest Growing Segment
By ComponentHardware, Software, ServicesHardware (~42% share)Software (10.6% CAGR)
By Vehicle TypePassenger Vehicles, Commercial VehiclesPassenger Vehicles (~74% share)Commercial Vehicles (9.6% CAGR)
By TechnologyEmbedded (OEM-Installed), Tethered (Smartphone-Projection), Integrated (Hybrid Cloud)Embedded (USD 16.6B)Integrated Hybrid Cloud (12.3% CAGR)


Market Segmentation Overview

By Component

Sub-SegmentKey Trend
HardwareDisplay size migration from 8-inch to 12+ inches; AR-HUD integration driving per-unit value increases
SoftwareRecurring subscription models replacing one-time license fees; AI-powered predictive routing gaining adoption
ServicesOTA map update delivery expanding; real-time traffic data-as-a-service becoming standard tier for OEMs


Navigation hardware continues to command the largest revenue share, though margins are compressing as chipset commoditization accelerates. Software and services together are expected to surpass hardware revenue contribution by 2031, reflecting the industry's structural shift toward recurring digital revenue streams.

By Vehicle Type

Sub-SegmentKey Trend
Passenger VehiclesConnected-car subscription penetration rising; premium segment approaching 100% navigation embed rates
Commercial VehiclesRegulatory-driven adoption through digital tachograph mandates; multi-stop route optimization as key differentiator


Passenger vehicles anchor total market volume, but commercial vehicles represent higher per-unit software value due to fleet operators' willingness to pay for fuel-saving and compliance-oriented routing features.

By Technology

Sub-SegmentKey Trend
Embedded (OEM-Installed)Deepening vehicle integration including ADAS data sharing; subscription monetization expanding
Tethered (Smartphone-Projection)Cost-effective entry point for mass-market vehicles; wireless projection protocols improving latency
Integrated (Hybrid Cloud)Combines local processing with cloud intelligence; best-fit architecture for autonomous driving support


Integrated hybrid cloud navigation architectures are emerging as the consensus architecture for next-generation vehicles, offering the reliability of embedded processing with the intelligence and freshness of cloud-connected data services.


Download PDF ×

We do not share your information with anyone. However, we may send you emails based on your report interest from time to time. You may contact us at any time to opt-out.