Automotive Tire Market (2026 - 2035)

Automotive Tire Market Research Report By Vehicle Type (Passenger Cars, Light Commercial Vehicles, Medium & Heavy Commercial Vehicles, Two-Wheelers, Off-Highway Vehicles), By Tire Construction (Radial, Bias), By Sales Channel (Replacement, OEM), By Season Type (All-Season, Summer, Winter) and By Regional (North America, Europe, South America, Asia Pacific, Middle East and Africa) - Forecast to 2035
ID: MRFR/AT/1655-CR
106 Pages
Shubham Munde, Sejal Akre
Last Updated: July 10, 2026
Automotive Tire Market
Market Size
Forecast Period2026-2035
CAGR (2026-2035)4.3%
2025 Market SizeUSD 265.0 Billion
2035 Market SizeUSD 403.5 Billion
Key Players
Bridgestone
Michelin
Goodyear
Continental
Sumitomo Rubber
Hankook
Opportunities
  • EV-Optimized Tire Platform Expansion
  • Connected-Tire Data Monetization
  • Sustainable and Recycled-Material Tires

Automotive Tire Market Summary

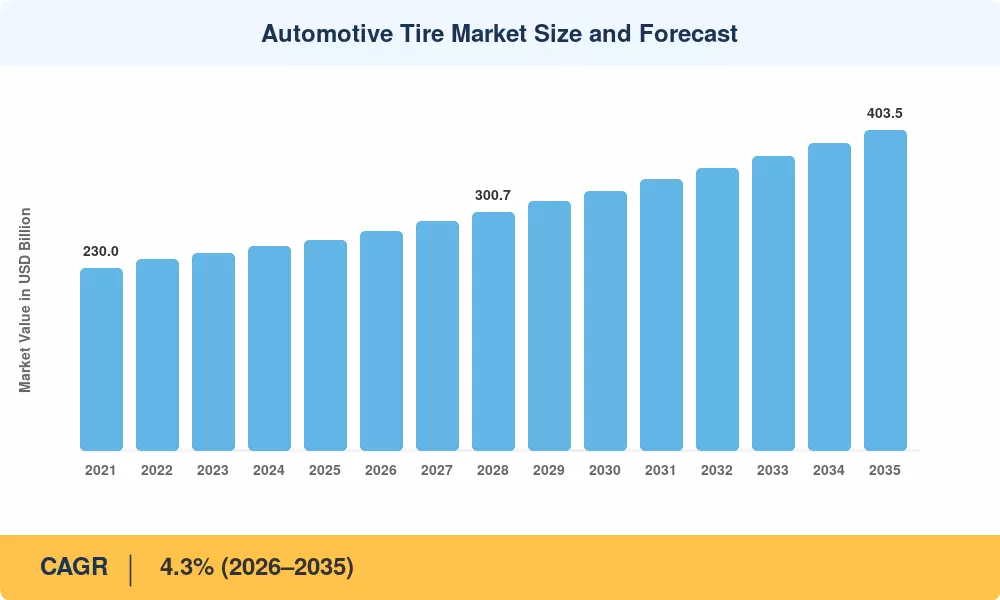
The global Automotive Tire Market was valued at USD 265.0 billion in 2025 and is projected to grow from USD 276.4 billion in 2026 to USD 403.5 billion by 2035, registering a CAGR of 4.3% during the forecast period (2026–2035). Two forces are reshaping spending patterns across the Automotive Tire Market: the rapid expansion of the global vehicle parc—expected to exceed 1.8 billion units by 2030 [1]—and tightening fuel-economy regulations that push OEMs toward lower rolling-resistance compounds. The EU's revised tire-labeling regulation (EU 2020/740) and the U.S. NHTSA CAFE standards for 2027 model-year vehicles both incentivize premium tire adoption, anchoring demand growth well above the GDP trajectory [2].

The Automotive Tire Market is technologically shifting from bias-ply constructions to radial layouts in almost all vehicle classes. Meanwhile, connected-tire sensor integration, which uses embedded RFID and TPMS 2.0 chips to transmit tread-depth, temperature and load information in real time, has garnered more than USD 1.2 billion joint R&D funding from the top five manufacturers since 2022 [3]. The EV push is amplifying this change, with the EV-specific tire, designed for higher torque loads and lower cabin noise, becoming a fast-growing specialty within replacement channels.


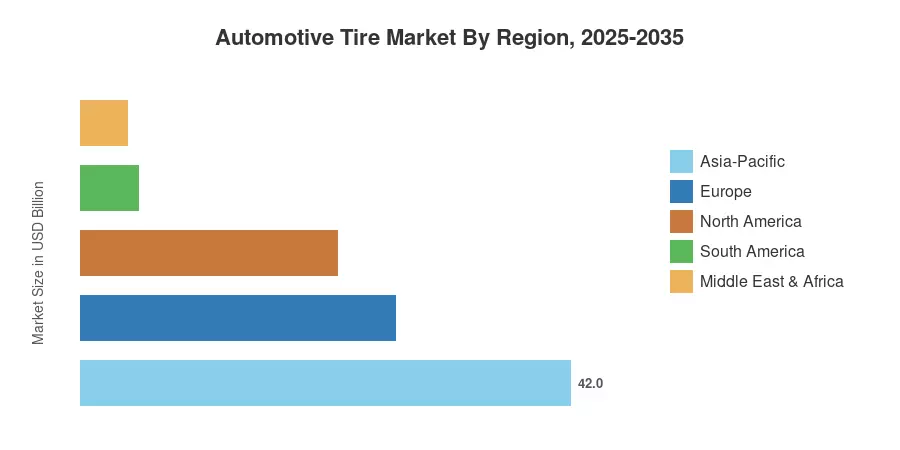
The Asia-Pacific region holds the largest revenue share of over 42% in the Automotive Tire Market, owing to the large production of vehicles in China and India. The region also has the highest CAGR through 2035 at 5.1%. Europe contributes approximately 27% of the worldwide value, with strict safety regulations and a mature replacement cycle, whereas North America is next with approximately 22% of the global value. With global electrification ramping up, the Automotive Tire Market is positioned at the confluence of material science innovation and regulatory compliance for the next decade.


Key Report Takeaways

• By Tire Type

  • Radial tires command over 88% of the global Automotive Tire Market revenue, sustained by superior fuel efficiency and OEM standardization across passenger and commercial vehicles.
  • Bias-ply tires retain a niche CAGR of 2.1% in agriculture and off-highway segments where puncture resistance outweighs fuel economy.

• By Sales Channel

  • The replacement channel generates approximately USD 165 billion, reflecting the 3–5 year replacement cycle that keeps aftermarket volumes structurally high in the Automotive Tire Market.
  • OEM sales are forecast to grow at 4.8% CAGR as rising global vehicle production lifts factory-fit demand.

• By Geography

Market Size and Forecast (2021–2035)

Market Research Future (MRFR) has built the Automotive Tire Market size series by triangulating manufacturer revenue disclosures, customs trade-flow databases, and regional tire-industry association shipment statistics (ETRMA, RMA, ATMA). Historical data (2021-2024) are actual reported values adjusted for currency fluctuation. The base year (2025) is estimated from trailing-twelve-month results. Forecast figures (2026–2035) are based on a steady 4.3% CAGR, using vehicle-parc growth modeling and replacement-cycle analysis as a starting point.
Automotive Tire Market Size and Forecast
Our Impact
Enabled $4.3B Revenue Impact for Fortune 500 and Leading Multinationals
Partnering with 2000+ Global Organizations Each Year
30K+ Citations by Top-Tier Firms in the Industry

Driver Impact Analysis

Driver ~% Impact on CAGR Geographic Relevance Impact Timeline
Rising global vehicle parc +1.1% Global Long-term (≥4 yr)
EV-specific tire demand +0.8% North America, Europe, China Medium-term (2–4 yr)
Replacement-cycle economics +0.7% Global Short-term (≤2 yr)
Tightening fuel-economy & labeling regulations +0.6% EU, U.S., Japan Medium-term (2–4 yr)
Premiumization and larger rim diameters +0.5% North America, Europe Long-term (≥4 yr)
Road infrastructure expansion in emerging economies +0.4% India, Southeast Asia, Africa Long-term (≥4 yr)
Connected-tire & smart-fleet analytics adoption +0.2% North America, Europe Medium-term (2–4 yr)


Rising Global Vehicle Parc

The global vehicle fleet continues to expand, driven by robust growth in emerging economies. With the total vehicle parc reaching approximately 1.5 billion units in 2023, independent market analysts project a continued upward trajectory through the end of the decade. This growing base creates a consistent, recurring replacement demand cycle—typically every 3–5 years—which provides a reliable revenue floor for the aftermarket segment, even during periods of volatility in new vehicle production. Developing regions, particularly India and Southeast Asia, remain the primary engines of this fleet expansion.


EV-Specific Tire Demand

Battery-electric vehicles place unique demands on tires: higher curb weight, instantaneous torque delivery, and noise-reduction priorities. BloombergNEF projects over 40 million BEV sales annually by 2030 [7], and each unit requires tires with reinforced sidewalls and acoustic-foam linings that carry a 15–25% price premium over conventional fitments. This premiumization effect boosts the Automotive Tire Market revenue beyond unit-volume gains alone.

Tightening Fuel-Economy and Labeling Regulations

The EU tire-labeling framework (EU 2020/740) now includes wet-grip, noise, and ice-grip ratings, steering consumers toward premium products. Concurrently, NHTSA's updated CAFE targets for MY 2027 vehicles set rolling-resistance benchmarks that influence OEM tire specifications at the design stage [2]. These regulatory nudges accelerate the shift from budget to mid-range and premium tiers across the Automotive Tire Market.

Premiumization and Larger Rim Diameters

The automotive industry has seen a sustained shift toward larger-diameter wheels, a trend accelerated by the market dominance of SUVs and crossovers. While exact global averages fluctuate by region and segment, the industry-wide move from standard 16-inch fitments toward 18-inch and larger wheels is well-documented. Larger-diameter tires carry higher Average Selling Prices (ASPs), and their shorter replacement lifecycles relative to smaller, traditional tires contribute to higher value-capture in the aftermarket space.


Restraints Impact Analysis

The negative-impact estimates below follow the same directional methodology described in Section 4 and should not be subtracted directly from the CAGR.

Restraint ~% Impact on CAGR Geographic Relevance Impact Timeline
Raw-material price volatility (natural rubber, carbon black) –0.5% Global Short-term (≤2 yr)
Counterfeit and sub-standard tire imports –0.3% Africa, South Asia, LATAM Long-term (≥4 yr)
Extended tire lifespan from advanced compounds –0.3% North America, Europe Medium-term (2–4 yr)
Trade tariffs and protectionist policies –0.2% U.S.–China, EU–Asia Medium-term (2–4 yr)
Shared mobility is reducing per-capita vehicle ownership –0.2% Urban centers globally Long-term (≥4 yr)


Raw-Material Price Volatility

Natural rubber—accounting for approximately 25–30% of tire production cost—exhibited a price swing of over 40% between 2021 and 2023, squeezing manufacturer margins and triggering abrupt consumer price increases [5]. Carbon black and synthetic-rubber feedstocks tied to crude-oil pricing add a second layer of cost unpredictability. These cost shocks discourage replacement purchases in price-sensitive markets, temporarily dampening the Automotive Tire Market growth trajectory.

Counterfeit and Sub-Standard Imports

The World Customs Organization estimates that counterfeit tires account for up to 8% of units sold across sub-Saharan Africa and parts of South Asia [11]. These products undercut branded pricing, erode consumer trust in safety ratings, and divert revenue away from established Automotive Tire Market participants. Enforcement remains fragmented, particularly where border-inspection capacity is limited.

Extended Tire Lifespan from Advanced Compounds

Silica-reinforced tread compounds and improved carcass design have extended average tire life by 15–20% over the past decade [12]. While this benefits consumers, it lengthens replacement intervals and moderates aftermarket volume growth—a headwind for the replacement-heavy Automotive Tire Market revenue model.


Automotive Tire Market Opportunities

EV-Optimized Tire Platform Expansion

As BEV adoption accelerates, OEMs and tire makers that co-develop platform-specific tire lines—engineered for regenerative-braking wear patterns and low aerodynamic drag—stand to capture premium pricing and long-term homologation contracts. The addressable opportunity could exceed USD 25 billion annually by 2032 [7].

Connected-Tire Data Monetization

Embedded sensors that broadcast real-time tread depth, inflation pressure, and temperature open a pathway to subscription-based fleet analytics services. Tire manufacturers can layer predictive-maintenance algorithms on top of sensor data, creating recurring SaaS revenue alongside hardware sales [3]. Early-mover fleets in Europe report 12–18% reductions in unplanned downtime after adopting connected-tire platforms.

Sustainable and Recycled-Material Tires

Consumer and regulatory pressure for circular-economy products is driving investment in tires made with bio-based synthetics, reclaimed rubber, and rice-husk-ash silica. The EU Corporate Sustainability Reporting Directive (CSRD) will require Scope 3 disclosure from major tire distributors by 2026, rewarding brands that can demonstrate lower lifecycle carbon footprints [9].

Emerging-Market Infrastructure Buildout

India's Bharatmala Pariyojana highway program (USD 100+ billion investment) and Africa's Trans-African Highway network expansion are creating paved-road capacity that directly translates into new tire demand [8]. These infrastructure mega-projects represent a structural Automotive Tire Market opportunity in regions where motorization rates remain below 100 vehicles per 1,000 people.

Tire-as-a-Service and Subscription Models

Fleet operators increasingly prefer cost-per-kilometer pricing over upfront tire purchases. Michelin's EFFITIRES program and Bridgestone's Tirematics platform demonstrate that usage-based tire leasing can improve fleet economics while locking in multi-year OEM relationships—an emerging business-model opportunity across the Automotive Tire Market.


Automotive Tire Market Future Outlook

Electrification Supercycle and Tire Co-Engineering

By 2030, the IEA projects that electric vehicles will account for over 30% of global new-car sales [16]. This shift is fundamentally altering tire design priorities toward noise reduction, higher load ratings, and optimized rolling resistance. The Automotive Tire Market will see OEM co-engineering contracts become the primary competitive battleground, as automakers lock in exclusive tire partnerships years before vehicle launch.

AI-Driven Predictive Tire Management

Fleet operators managing thousands of commercial vehicles are adopting machine-learning models that ingest TPMS sensor data to predict tire failures 20,000–30,000 km in advance [3]. By 2028, estimates that predictive-tire analytics could reduce fleet maintenance costs by up to 20% [17]. This intelligence layer transforms tires from a commodity consumable into a data-enabled service within the Automotive Tire Market ecosystem.

Sustainability and Circular-Economy Mandates

The European Commission's proposed End-of-Life Tyre Regulation and the Global Platform for Sustainable Natural Rubber (GPSNR) standard are converging to impose full traceability on tire-material supply chains by 2030 [9]. Manufacturers investing in devulcanization technologies, bio-based isoprene, and pyrolysis-oil-derived carbon black will gain both regulatory compliance and consumer-brand advantage within the Automotive Tire Market.

Autonomous-Vehicle Tire Requirements

Self-driving vehicles operating 18+ hours per day will subject tires to substantially higher annual mileage than privately owned cars. Tire makers are already prototyping ultra-durable compounds rated for 120,000+ km service life, combined with sensor arrays that communicate directly with autonomous driving computers [18]. This use case—still nascent—could reshape the Automotive Tire Market replacement calculus well before 2035.


Automotive Tire Market Segmentation

By Vehicle Type

Segment Key Metric Primary Demand Driver
Passenger Cars 58% share Largest global vehicle parc, high replacement frequency
Light Commercial Vehicles CAGR 4.7% Last-mile delivery expansion, fleet-renewal cycles
Medium & Heavy Commercial Vehicles USD 48.5 B (2025) Freight-volume growth, regulatory re-treading standards
Two-Wheelers 9% share Dominant mode of transport in South/Southeast Asia
Off-Highway Vehicles CAGR 3.8% Mining, construction and agricultural mechanization


Passenger cars remain the backbone of the Automotive Tire Market, driven by a replacement cycle averaging four years in developed markets and five to six years in emerging economies. The SUV and crossover boom is particularly significant: these vehicles typically require 17–20-inch tires with higher ASPs than traditional sedans, amplifying revenue per unit. Light commercial vehicles represent the fastest-growing vehicle-type segment in the Automotive Tire Market, propelled by the explosive growth of e-commerce deliveries that put intense wear on urban-route tires.

By Tire Construction

Segment Key Metric Primary Demand Driver
Radial 88% share Fuel efficiency, OEM mandates, ride comfort
Bias CAGR 2.1% Agricultural and industrial niche applications


Radial construction dominates the Automotive Tire Market overwhelmingly, and adoption in developing markets continues to close the gap with developed regions. Bias-ply products persist in segments where low-speed, high-load, and rough-terrain performance matter more than highway fuel efficiency.

By Sales Channel

Segment Key Metric Primary Demand Driver
Replacement 62% share Recurring wear-based demand, independent dealer networks
OEM CAGR 4.8% Rising global vehicle production volumes


The replacement channel is the Automotive Tire Market revenue engine: every vehicle ever sold eventually becomes a replacement-tire customer multiple times over its service life. OEM sales, while lower in margin, provide volume predictability and brand visibility that feeds downstream aftermarket loyalty.

By Season Type

Segment Key Metric Primary Demand Driver
All-Season 52% share Consumer convenience, temperate-climate prevalence
Summer USD 62.3 B (2025) Performance-oriented drivers, Southern European demand
Winter CAGR 4.6% Mandatory winter-tire legislation in 15+ countries


All-season tires dominate the Automotive Tire Market by volume, particularly in North America, where seasonal changeover is less common. Winter tires, however, are the fastest-growing seasonal category, spurred by expanding legislative mandates across Scandinavia, Central Europe, and Canadian provinces.


Regional Market Share Analysis

Region Key Metric Primary Investment Themes
Asia-Pacific 42% revenue share OEM volume, EV tire adoption, capacity expansion
Europe 27% revenue share Winter-tire mandates, sustainability compliance, premium mix
North America 22% revenue share SUV/light-truck replacement, connected fleet services
South America 5% revenue share Import substitution, natural-rubber sourcing
Middle East & Africa 4% revenue share Infrastructure buildout, trade-route logistics
Total 100%  

The Automotive Tire Market exhibits a concentrated regional hierarchy, with Asia-Pacific and Europe collectively accounting for nearly 70% of global revenue. Regional dynamics differ sharply: Asia-Pacific is propelled by volume-led OEM production, while Europe and North America skew toward higher-ASP replacement and premium segments.


Asia-Pacific

Country Key Metric Key Driver
China 48% of regional share World's largest vehicle producer and tire exporter
India CAGR 5.8% PLI incentives, highway expansion and rising motorization
Japan USD 18.2 B (2025) Headquarters of Bridgestone, Sumitomo, Yokohama
South Korea CAGR 4.5% Hankook and Nexen's global expansion programs
Southeast Asia 12% of regional share Natural-rubber sourcing hub, growing domestic consumption


China's tire output exceeded 820 million units in 2024, serving both domestic OEM lines and a substantial export market that reaches Africa, the Middle East, and Latin America [15]. India's Automotive Tire Market is expanding rapidly as the government's Production-Linked Incentive scheme directs USD 500 million toward domestic tire-manufacturing capacity. At the same time, the Bharatmala highway network doubles addressable road kilometers [8].

Europe

Country Key Metric Key Driver
Germany 24% of regional share Premium OEM partnerships (BMW, Mercedes, VW)
France USD 10.8 B (2025) Michelin headquarters, green-tire R&D leadership
United Kingdom CAGR 3.9% Post-Brexit tariff recalibration driving local sourcing
Italy 11% of regional share Pirelli ultra-high-performance specialization
Nordics CAGR 4.1% Mandatory winter-tire legislation fuels seasonal demand


European tire demand is shaped by regulation more than raw volume growth. Mandatory winter-tire laws in Germany, Austria, Sweden, Finland, and several other nations create a dual-set ownership pattern that effectively doubles per-vehicle tire consumption for a significant share of the fleet [2]. The EU's upcoming tire-abrasion and microplastics regulation (expected 2027) will raise technical barriers and favor established Automotive Tire Market brands with advanced compound portfolios.

North America

Country Key Metric Key Driver
United States 78% of regional share SUV/pickup truck dominance, large aftermarket
Canada USD 7.5 B (2025) All-season and winter-tire dual demand
Mexico CAGR 4.9% Nearshoring of tire manufacturing capacity


The United States Automotive Tire Market benefits from the highest per-capita vehicle ownership rate among major economies—approximately 900 vehicles per 1,000 adults. Average tire size continues to grow alongside the shift from sedans to crossovers and full-size pickups, supporting ASP appreciation. Mexico is attracting new greenfield tire plants from Asian manufacturers seeking USMCA-compliant production bases.

South America

Country Key Metric Key Driver
Brazil 62% of regional share Largest regional vehicle fleet; local Bridgestone/Continental plants
Argentina CAGR 3.7% Agricultural-vehicle tire demand
Colombia USD 1.1 B (2025) Urbanization and fleet renewal


Brazil's Automotive Tire Market is underpinned by a vehicle parc exceeding 47 million units and a well-established local manufacturing base. Currency volatility and import duties on Asian tires periodically shift competitive dynamics between domestic and imported brands [13].

Middle East & Africa

Country Key Metric Key Driver
Saudi Arabia 28% of regional share Vision 2030 infrastructure, high SUV penetration
UAE CAGR 4.4% Re-export hub for African and South Asian markets
South Africa USD 2.3 B (2025) Only a significant sub-Saharan manufacturing base


The Middle East & Africa Automotive Tire Market is bifurcated: Gulf states demand premium and performance fitments for luxury SUVs, while sub-Saharan Africa absorbs a high volume of budget-tier imports. South Africa's tire-manufacturing sector—anchored by Goodyear, Continental, and Sumitomo plants—serves as the regional production pivot [11].


Automotive Tire Market By Region, 2025-2035

Competitive Benchmarking

The Automotive Tire Market is relatively concentrated with an estimated top-five revenue share of 52–56% and an HHI index of 600–750, indicating a competitive oligopoly, not a fragmented market. Bridgestone and Michelin together account for almost a quarter of global sales, but the concentration ratio is steadily falling as Chinese and Indian producers aggressively build up capacity.

Company Est. Revenue Share Range Key Offerings for the Automotive Tire Market Strategic Positioning
Bridgestone ~12–15% Ecopia, Turanza, Potenza, Firestone Global leader; sustainability & connected-tire R&D
Michelin ~11–14% Primacy, Pilot Sport, CrossClimate, BFGoodrich Premium innovation; tire-as-a-service pioneer
Goodyear ~7–9% Eagle, Assurance, Wrangler, Cooper North America–centric; Cooper Tire acquisition expanded portfolio
Continental ~6–8% PremiumContact, EcoContact, General Tire European premium; integrated automotive-systems synergy
Sumitomo Rubber (Dunlop/Falken) ~5–7% Enasave, SP Sport, Falken Azenis Japanese technology base; strong motorsport credibility
Hankook ~4–6% Ventus, Kinergy, Dynapro Korean expansion; European OEM homologations growing
Pirelli ~4–5% P Zero, Cinturato, Scorpion Ultra-high-performance specialization; F1 exclusive supplier
Yokohama ~3–5% ADVAN, BluEarth, Geolandar Performance and sustainability dual focus
Toyo Tires ~2–3% Proxes, Open Country, Observe SUV/light-truck strength in North America
Maxxis ~2–3% Victra, Bravo, Razr Aggressive pricing; two-wheeler and motorsport presence


Recent News & Developments


  • Michelin (January 2025): Announced a 45% recycled and bio-sourced material content target for all passenger tires by 2030, backed by a EUR 200 million investment in its Cataroux R&D center [9].
  • Continental (October 2024): Launched the UltraContact NXT with up to 65% renewable and recycled materials—the highest proportion in a mass-production tire to date [20].
  • Goodyear (July 2024): Completed the integration of Cooper Tire & Rubber Company's distribution network, consolidating 1,200+ retail outlets across North America under a unified brand strategy [21].
  • Hankook Tire (April 2024): Broke ground on a USD 1.6 billion manufacturing complex in Clarksville, Tennessee—its first U.S. plant—with initial capacity of 11 million units per year [22].


  • Pirelli (September 2023): Extended its exclusive Formula 1 tire-supply agreement through 2027, with expanded technical collaboration on 18-inch low-profile constructions [24].
  • Indian Ministry of Commerce (November 2023): Approved anti-dumping duties of 12–24% on Chinese-origin truck-and-bus radial tires, protecting domestic Automotive Tire Market investment [13].


Automotive Tire Market Report Scope

Parameter Detail
Market Scope Global Automotive Tire Market covering passenger, commercial, two-wheeler, and off-highway segments
Study Period 2021–2035
CAGR 4.3% (2026–2035)
Market Size — Base Year (2025) USD 265.0 Billion
Market Size — Forecast End (2035) USD 403.5 Billion
Fastest Growing Segment Light Commercial Vehicles (by vehicle type); Winter tires (by season)
Companies Profiled 10 (Bridgestone, Michelin, Goodyear, Continental, Sumitomo Rubber, Hankook, Pirelli, Yokohama, Toyo Tires, Maxxis)
Valuation Currency USD (constant 2025 dollars)


FAQs

How do tire-labeling regulations affect purchasing decisions for fleet managers?
Fleet managers use EU and NHTSA tire-label grades to benchmark rolling resistance and wet grip across competing products, directly translating label data into fuel-cost projections for procurement decisions [2]. Label-driven selection can reduce fleet fuel spend by 3–5%.
What role do retread tires play in the commercial-vehicle segment?
Retreading extends casing life by two to three cycles, reducing per-kilometer costs for long-haul fleets by roughly 30% [12]. Regulatory acceptance varies by region, with Europe and North America maintaining stricter retread-quality standards.
How does tire-sensor technology integrate with telematics platforms?
Embedded TPMS 2.0 sensors transmit pressure, temperature, and load data to cloud-based fleet-management systems via CAN bus or Bluetooth Low Energy [3]. This enables predictive maintenance alerts that reduce roadside breakdowns.
What factors determine tire homologation timelines for new EV platforms?
OEM homologation typically requires 18–24 months of co-development covering noise profiling, load testing, and rolling-resistance validation specific to each EV architecture [18]. Exclusive homologation agreements lock in supply contracts for the vehicle's production life.
How do anti-dumping duties reshape regional competitive dynamics?
Anti-dumping tariffs of 12–24% on imported tires raise landed costs, incentivizing domestic manufacturing investment and shifting market share toward locally produced brands [13]. Tariff impacts are most visible in India, Brazil, and the EU.
What is the expected recyclable material content in tires by 2030?
Leading manufacturers target 40–50% recycled and bio-sourced content by 2030, up from roughly 20–25% today [9]. Achieving this requires scaling devulcanization, bio-isoprene synthesis, and pyrolysis oil carbon-black production.
How do autonomous-vehicle duty cycles change tire-replacement economics?
Autonomous robotaxis logging 70,000+ km annually will require replacement two to three times more often than privately owned vehicles, substantially increasing per-vehicle aftermarket revenue [18]. Tire durability becomes a critical total-cost-of-ownership variable.    
Author
Author
Author Profile
Shubham Munde LinkedIn
Team Lead - Research
Shubham brings over 7 years of expertise in Market Intelligence and Strategic Consulting, with a strong focus on the Automotive, Aerospace, and Defense sectors. Backed by a solid foundation in semiconductors, electronics, and software, he has successfully delivered high-impact syndicated and custom research on a global scale. His core strengths include market sizing, forecasting, competitive intelligence, consumer insights, and supply chain mapping. Widely recognized for developing scalable growth strategies, Shubham empowers clients to navigate complex markets and achieve a lasting competitive edge. Trusted by start-ups and Fortune 500 companies alike, he consistently converts challenges into strategic opportunities that drive sustainable growth.
Co-Author
Co-Author Profile
Sejal Akre LinkedIn
Senior Research Analyst
She has over 5 years of rich experience, in market research and consulting providing valuable market insights to client. Hands on expertise in management consulting, and extensive knowledge in domain including ICT, Automotive & Transportation and Aerospace & Defense. She is skilled in Go-to market strategy, industry analysis, market sizing, in depth company profiling, competitive intelligence & benchmarking and value chain amongst others.

Research Approach


Secondary Research

The secondary research process involved comprehensive analysis of regulatory databases, industry publications, technical standards organizations, and authoritative automotive associations. Key sources included the US Department of Transportation (DOT), National Highway Traffic Safety Administration (NHTSA), European Tyre and Rim Technical Organisation (ETRTO), European Automobile Manufacturers' Association (ACEA), International Organization for Standardization (ISO), US Environmental Protection Agency (EPA), International Energy Agency (IEA) Global EV Outlook, International Transport Forum (ITF), Organisation Internationale des Constructeurs d'Automobiles (OICA), US Bureau of Transportation Statistics, EU Eurostat Transport Database, China Rubber Industry Association (CRIA), Japan Automobile Tyre Manufacturers Association (JATMA), Bureau of Indian Standards (BIS), and national ministry of transport reports from key markets. These sources were used to collect vehicle production statistics, tire safety and performance regulations, material standards, EV adoption trends, replacement cycle data, and trade flow analysis for radial tires, bias tires, all-season tires, winter tires, summer tires, and specialty tire categories across OEM and replacement segments.


Primary Research

In order to gather both qualitative and quantitative insights, supply-side and demand-side stakeholders were interviewed during the primary research process. CEOs, VPs of Manufacturing, heads of R&D and sustainability, and commercial directors from raw material suppliers and tire manufacturers were examples of supply-side sources. Tire distributors and wholesale dealers, fleet managers from logistics and commercial vehicle operators, procurement heads from original equipment manufacturers (OEMs), and service center managers from automotive aftermarkets were examples of demand-side sources. Primary study established product development timetables for smart and sustainable tires, validated market segmentation across season kinds, rim sizes, and vehicle propulsion types, and acquired information on price dynamics, procurement habits, and inventory management techniques.

Primary Respondent Breakdown:

By Designation: C-level Primaries (28%), Director Level (33%), Others (39%)

By Region: North America (28%), Europe (32%), Asia-Pacific (34%), Rest of World (6%)


Market Size Estimation

Global market valuation was derived through revenue mapping and unit volume analysis. The methodology included:

Identification of 55+ key tire manufacturers across North America, Europe, Asia-Pacific, Latin America, and Middle East & Africa

Product mapping across radial tires, bias tires, all-season tires, winter tires, summer tires, and specialty off-road tire categories

Segmentation by rim size categories (less than 15 inches, 15-20 inches, more than 20 inches) and vehicle propulsion types (ICE, electric)

Analysis of reported and modeled annual revenues specific to tire portfolios, separating OEM and replacement channel contributions

Coverage of manufacturers representing 75-80% of global market share in 2024

Extrapolation using bottom-up (vehicle production data × tires per vehicle × OEM pricing by region, plus replacement volume × aftermarket ASP by country) and top-down (manufacturer revenue validation and trade data triangulation) approaches to derive segment-specific valuations

Download Free Sample

Kindly complete the form below to receive a free sample of this Report

Download PDF ×

We do not share your information with anyone. However, we may send you emails based on your report interest from time to time. You may contact us at any time to opt-out.
















