Battery Materials Recycling Market (2026 - 2035)

Battery Materials Recycling Market Size, Share & Growth Analysis Report By Battery Chemistry (Lead-Acid, Lithium-Ion, Other (Nickel-Cadmium, Alkaline)), By Source of Scrap (Automotive Batteries, Consumer Electronics Batteries, Industrial & Energy Storage Batteries), By Recycling Technology (Pyrometallurgical, Hydrometallurgical, Direct Recycling), By Process Stage (Collection & Transportation, Dismantling & Pre-processing, Material Refining & Recovery, Black-Mass Production), By Application of Recovered Materials (Cathode Active Materials, Battery-Grade Lithium Compounds, Anode Materials, Electrolyte & Separator Recovery), By End-User Industry (Automotive, Consumer Electronics, Energy Storage Systems, Industrial) and By Regional (North America, Europe, South America, Asia Pacific, Middle East and Africa) – Industry Growth & Forecast to 2035
ID: MRFR/EnP/9942-HCR
100 Pages
Chitranshi Jaiswal
Last Updated: July 23, 2026
Battery Materials Recycling Market
Market Size
Forecast Period2026-2035
CAGR (2026-2035)10.2%
2021 Market Size29.3 USD Billion
2023 Market Size32.15 USD Billion
Key Players
Umicore
GEM Co., Ltd.
Brunp Recycling
Glencore
Li-Cycle Holdings
Redwood Materials
Opportunities
  • Direct Recycling Commercialization
  • Emerging-Market Recycling Infrastructure
  • Battery Passport Data Monetization

Battery Materials Recycling Market Summary

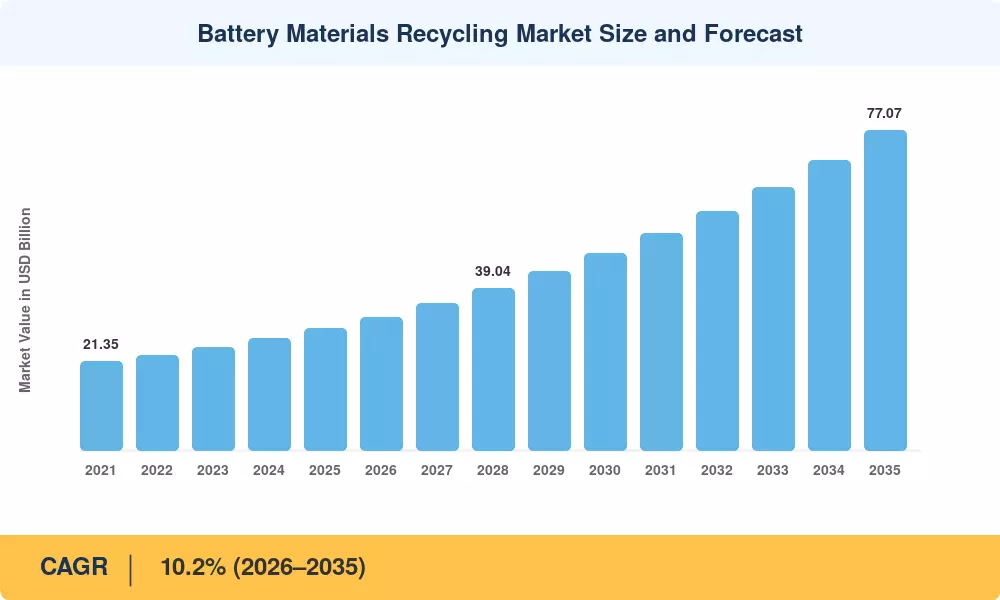
The Battery Materials Recycling Market reached USD 29.30 billion in 2025 and is projected to grow from USD 32.15 billion in 2026 to USD 77.07 billion by 2035, registering a CAGR of 10.2% during the forecast period. Two forces are pulling investment into this space at an unprecedented pace: extended-producer-responsibility mandates that make automakers financially accountable for spent cells, and critical-mineral scarcity that has turned end-of-life batteries from a disposal headache into a strategic feedstock. The EU Battery Regulation (2023/1542) and the U.S. Inflation Reduction Act together created a policy corridor that rewards domestic recycling capacity with tax credits and mandated recycled-content thresholds [2][17].

On the technology front, the Battery Materials Recycling Market is undergoing a generational shift. Pyrometallurgical smelting — long the default for lead-acid chemistries — is yielding ground to hydrometallurgical and direct-recycling routes that recover battery-grade nickel, cobalt, and lithium sulfates at purities exceeding 99.5%. The U.S. Department of Energy's ReCell Center estimates that direct recycling could reduce EV battery pack costs by roughly USD 1,000 per vehicle once scaled, reshaping cost economics across the entire supply chain [13].

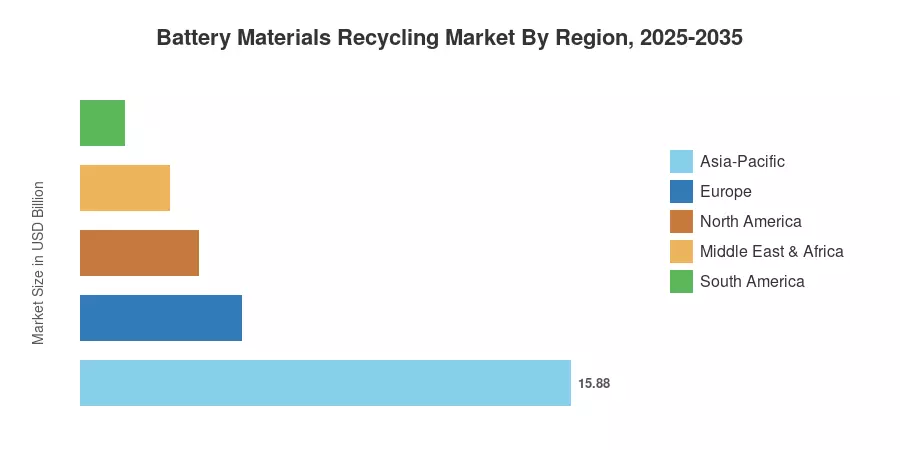
Asia-Pacific commands approximately 54.2% of the global Battery Materials Recycling Market revenue, anchored by China's integrated gigafactory-recycler clusters in Guangdong and Hubei provinces. North America is the fastest-growing region, propelled by IRA-linked incentives for domestic black-mass refining. Europe holds the second-largest share at 17.8%, driven by mandatory collection targets under the new EU regulation. As EV adoption curves steepen worldwide, the Battery Materials Recycling Market is poised to become a cornerstone of circular battery supply chains through 2035 [1][4].


Key Report Takeaways

• By Battery Chemistry

  • Lead-acid batteries accounted for 65.5% of the Battery Materials Recycling Market in 2025, supported by decades-old collection infrastructure and near-universal regulatory frameworks for lead recovery.
  • Lithium-ion battery recycling is projected to expand at a 25.6% CAGR through 2035, driven by accelerating EV retirements and cathode material reclamation demand.

• By Recycling Technology

  • Pyrometallurgy held 57.9% of the Battery Materials Recycling Market share in 2025, though its dominance is eroding as purity requirements tighten.
  • Hydrometallurgical processing is advancing at a 24.3% CAGR, reflecting cathode producers' preference for high-purity sulfate outputs.

• By Region

  • Asia-Pacific retained the largest share of the Battery Materials Recycling Market in 2025 at 54.2%.
  • North America is forecast to post a 13.1% CAGR through 2035 as IRA subsidies spur greenfield recycling plants.


Battery Materials Recycling Market Size and Forecast (2021–2035)

Market Research Future's sizing combines bottom-up revenue tracking from 85+ recycling facilities worldwide with top-down validation against metal-recovery volumes reported by USGS, the International Energy Agency, and Benchmark Minerals Intelligence. Historical figures (2021–2024) reflect audited company revenues and trade data; forecast values (2026–2035) apply a 10.2% CAGR anchored to policy-driven capacity expansion schedules and projected EV battery retirement curves [5][19].
Battery Materials Recycling Market Size and Forecast
Our Impact
Enabled $4.3B Revenue Impact for Fortune 500 and Leading Multinationals
Partnering with 2000+ Global Organizations Each Year
30K+ Citations by Top-Tier Firms in the Industry

Driver Impact Analysis

Driver ~% Impact on CAGR Geographic Relevance Impact Timeline
EV battery retirement wave ~2.8% Global Medium-term (2027–2030)
Extended producer responsibility mandates ~2.1% Europe, Asia-Pacific Short-term (2025–2027)
Critical-mineral supply security policies ~1.8% North America, Europe Long-term (2028–2035)
Hydrometallurgical purity advancements ~1.5% Global Medium-term (2027–2030)
IRA and domestic content incentives ~1.3% North America Short-term (2025–2027)
OEM closed-loop cathode supply agreements ~1.0% Global Long-term (2028–2035)
Battery passport and traceability systems ~0.7% Europe, China Medium-term (2027–2030)


EV Battery Retirement Wave

The IEA estimates that cumulative EV sales surpassed 50 million units globally by late 2024, meaning the first large-scale cohort of lithium-ion packs is approaching end-of-life between 2027 and 2031 [1]. Each retiring 60 kWh NMC pack contains roughly 8 kg of cobalt, 35 kg of nickel, and 6 kg of lithium — materials worth approximately USD 1,200 at 2025 spot prices. This retirement wave transforms the Battery Materials Recycling Market from a niche lead-acid business into a multi-chemistry industrial operation, with annual recoverable lithium volumes projected to exceed 120,000 tonnes by 2030 [12].

Extended Producer Responsibility Mandates

By 2031, new batteries supplied in Europe must use at least 16% recycled cobalt, 6% recycled lithium, and 6% recycled nickel, according to the EU Battery Regulation [2]. These binding targets condense the economics of collection logistics and ensure recyclers' offtake. In order to close an informal-sector loophole that had previously diverted an estimated 40% of retired EV packs from licensed recyclers, China's Ministry of Industry and Information Technology (MIIT) implemented traceability codes in 2024 that required battery manufacturers to track every cell from manufacturing to end-of-life [10].


Critical-Mineral Supply Security Policies

The U.S. Department of Energy allocated USD 3.16 billion under the Bipartisan Infrastructure Law specifically for battery materials processing and recycling, making it the single largest public investment in the Battery Materials Recycling Market in North America [3]. Meanwhile, the USGS classified lithium, cobalt, and graphite as critical minerals, unlocking permitting fast-tracks and loan guarantees for domestic recycling infrastructure [5]. These policies aim to reduce Western dependence on concentrated refining capacity in China, which controlled roughly 70% of global lithium refining and 82% of cobalt refining as of 2024 [18].

OEM Closed-Loop Supply Agreements

To obtain battery-grade materials from their own end-of-life packs, automakers including BMW, Mercedes-Benz, and General Motors have entered into multi-year offtake agreements with recyclers [15]. By lowering the risk associated with raw material procurement for OEMs and ensuring feedstock supply to recyclers, these closed-loop contracts essentially create a vertically integrated material loop. According to BloombergNEF, by 2030, 15–20% of Europe's cathode material needs might be met via closed-loop systems [4].


Restraints Impact Analysis

Restraint ~% Impact on CAGR Geographic Relevance Impact Timeline
Collection logistics and reverse-supply-chain costs ~-1.4% Global Ongoing
LFP chemistry's low recoverable metal value ~-1.1% China, Global Medium-term (2027–2030)
Fragmented recycling regulations across jurisdictions ~-0.9% Global Short-term (2025–2027)
High capital intensity of hydromet facilities ~-0.7% North America, Europe Medium-term (2027–2030)
Volatile metal pricing is undermining recycler margins ~-0.5% Global Ongoing


LFP Chemistry's Low Recoverable Metal Value

Lithium iron phosphate (LFP) batteries contain no cobalt or nickel, meaning the per-kilogram recovery value is roughly 60% lower than for NMC chemistries [4]. As LFP adoption surges — particularly in Chinese EVs and energy-storage systems — recyclers face a growing share of feedstock with thinner margins. Profitable LFP recycling depends on lithium prices remaining above USD 20,000 per tonne, a threshold that was breached to the downside during the 2023–2024 lithium price correction, temporarily rendering some LFP recycling operations uneconomic [12].

Collection Logistics and Reverse-Supply-Chain Costs

Spent batteries are distributed geographically, heavy, and dangerous. According to EPRI, 30–40% of recycling expenses in the battery materials recycling market are related to transportation and sorting, with rural and suburban collecting locations contributing a disproportionate amount of cost [11]. In contrast to lead-acid batteries, which have a 99% collection rate that has been developed over decades, most locations still lack enough infrastructure for lithium-ion collection, which causes a bottleneck between the real throughput of recyclers and the theoretical availability of feedstock.


Battery Materials Recycling Market Opportunities

Direct Recycling Commercialization

Direct recycling preserves the cathode crystal structure, avoiding the energy-intensive dissolution step required by hydrometallurgy. Argonne National Laboratory's ReCell Center has demonstrated cathode relithiation at lab scale with energy savings of up to 90% compared to pyrometallurgical processing [13]. Commercialization of direct recycling could disrupt the Battery Materials Recycling Market's cost structure by 2030, particularly for standardized NMC and LFP cathodes.

Emerging-Market Recycling Infrastructure

India, Brazil, and Southeast Asian nations are in the early stages of EV adoption, and their recycling infrastructure is virtually nonexistent. India's Battery Waste Management Rules (2022) created a regulatory framework, but fewer than ten licensed recycling facilities operated nationally as of 2024 [7]. The gap between projected EV growth and recycling capacity creates a greenfield opportunity for international recyclers and joint ventures.

Battery Passport Data Monetization

By 2027, digital battery passports will be required by the EU Battery Regulation, establishing a data layer that monitors each cell's provenance, chemistry, and state of health [14]. Recyclers can optimize processing routes and extract a premium price for recovered materials with certified provenance by incorporating passport data into sorting algorithms. Pay-per-insight and material-certification-as-a-service income streams are made possible by this data architecture, which offers a new business model for the battery materials recycling market.


Second-Life-to-Recycling Arbitrage

Before being recycled, batteries retired from EVs with 70–80% of their capacity can be used for stationary energy storage for a further 5–8 years [11]. Businesses that manage the steps of recycling and second-life repurposing are able to extract value from the same item twice. Private equity and infrastructure investors are drawn to the battery materials recycling market by this dual-revenue model.


Sodium-Ion Battery Recycling Readiness

Sodium-ion batteries are entering commercial production for grid storage and low-cost EVs, particularly in China. While sodium is abundant and cheap, the cathode materials (Prussian blue analogues, layered oxides) and hard-carbon anodes still require recovery to meet environmental regulations [19]. Early movers in sodium-ion recycling will establish process IP and regulatory relationships ahead of the wave.


Battery Materials Recycling Market Future Outlook

AI-Optimized Sorting and Process Control

Machine-vision and AI-based sorting systems are poised to transform the front end of recycling operations. Automated identification of cell chemistry, state-of-health, and defect type at intake can cut manual sorting labor by 70% and improve downstream recovery yields by directing each cell to its optimal processing route [13]. By 2030, AI-controlled hydrometallurgical reactors are expected to dynamically adjust leaching parameters in real time, maximizing metal recovery rates while minimizing reagent consumption across the Battery Materials Recycling Market.

Electrification Supercycle and Feedstock Abundance

IEA projects that global EV sales will reach 40 million units annually by 2030, implying that 15–20 million battery packs will reach end-of-life annually by 2035 [1]. This feedstock abundance will shift the Battery Materials Recycling Market from a supply-constrained to a capacity-constrained industry, favoring operators that invest early in scalable modular processing plants. IRENA estimates that the volume of lithium-ion batteries available for recycling will exceed 8 million tonnes per year globally by the mid-2030s [7].

ESG Reporting and Circular-Economy Metrics

Institutional investors are increasingly pricing circularity into battery-sector valuations. The EU's Corporate Sustainability Reporting Directive (CSRD) requires automakers and battery producers to disclose recycled-content percentages and end-of-life recovery rates starting in 2026 [14]. Companies that can demonstrate auditable closed-loop material flows will command valuation premiums, creating a financial flywheel that channels capital toward the Battery Materials Recycling Market and penalizes linear supply-chain models.

Next-Generation Chemistry Preparedness

Solid-state, sodium-ion, and lithium-sulfur batteries are expected to enter commercial EV production between 2028 and 2032. Each chemistry presents distinct recycling challenges — solid-state electrolytes require specialized separation, while sodium-ion cells demand process reconfigurations that current hydrometallurgical lines cannot handle without retrofit [19]. Recyclers that invest in flexible, chemistry-agnostic processing platforms during the current capacity buildout will be best positioned to capture value as the Battery Materials Recycling Market diversifies beyond NMC and LFP feedstock.


Battery Materials Recycling Market Segmentation

By Battery Chemistry

Segment Key Metric Primary Demand Driver
Lead-Acid 65.5% share (2025) Mature collection networks, regulatory mandates
Lithium-Ion 25.6% CAGR (2026–2035) EV retirement wave, cathode material value
Other (Nickel-Cadmium, Alkaline) USD 1.03 Billion (2025) Industrial and consumer device turnover


Lead-acid recycling remains the volumetric backbone of the Battery Materials Recycling Market, with collection rates exceeding 99% in most developed economies. The infrastructure is mature, margins are stable, and regulatory clarity keeps the segment profitable. Lithium-ion recycling, by contrast, is the growth engine. As first-generation EV batteries approach end-of-life, the volume of NMC and LFP packs entering the waste stream is scaling exponentially, carrying high-value cobalt, nickel, and lithium that cathode producers urgently need [1][12].

By Source of Scrap

Segment Key Metric Primary Demand Driver
Automotive Batteries 63.2% share (2025) Fleet retirements, OEM take-back programs
Consumer Electronics Batteries 22.1% CAGR (2026–2035) Smartphone and laptop upgrade cycles
Industrial & Energy Storage Batteries USD 2.64 Billion (2025) Grid-storage decommissioning


Automotive batteries dominate the Battery Materials Recycling Market by scrap source due to their sheer mass per unit — a single EV pack weighs 300–600 kg, compared to under 100 grams for a smartphone cell. Consumer electronics scrap grows fastest by CAGR as shorter device lifecycles generate a steady, high-frequency waste stream that municipal collection systems are increasingly equipped to handle [11].

By Recycling Technology

Segment Key Metric Primary Demand Driver
Pyrometallurgical 57.9% share (2025) Low capex, proven lead-acid compatibility
Hydrometallurgical 24.3% CAGR (2026–2035) High-purity output for cathode reuse
Direct Recycling 27.8% CAGR (2026–2035) Energy savings, cathode structure preservation


Pyrometallurgy's high-temperature smelting process handles mixed-chemistry feedstock with minimal pre-sorting, making it the default for legacy lead-acid operations. Hydrometallurgy is gaining share rapidly because it produces battery-grade nickel and cobalt sulfates at purities above 99.5%, which cathode producers require for direct reuse in new cells. The Battery Materials Recycling Market is watching direct recycling closely — if relithiation scales successfully, it could bypass both smelting and leaching entirely [13][3].

By Process Stage

Segment Key Metric Primary Demand Driver
Collection & Transportation USD 4.98 Billion (2025) Reverse logistics infrastructure
Dismantling & Pre-processing 10.8% CAGR (2026–2035) Automation and safe discharge protocols
Material Refining & Recovery 30.9% share (2025) Metal purification to battery-grade spec
Black-Mass Production 27.0% CAGR (2026–2035) Intermediate concentrate demand from refiners


Material refining and recovery captures the largest revenue share because it encompasses the high-value chemical separation and purification steps that determine output pricing. Black-mass production — the process of shredding and concentrating spent cells into a mixed metal powder — is the fastest-growing stage within the Battery Materials Recycling Market as integrated recyclers increasingly trade black mass as a commodity on spot and contract markets [19].

By Application of Recovered Materials

Segment Key Metric Primary Demand Driver
Cathode Active Materials 41.1% share (2025) NMC/NCA precursor demand from cell makers
Battery-Grade Lithium Compounds 26.5% CAGR (2026–2035) Lithium carbonate/hydroxide supply tightness
Anode Materials USD 1.47 Billion (2025) Recycled graphite for synthetic anode blending
Electrolyte & Separator Recovery 8.4% share (2025) Fluorine recovery and solvent reclamation


Cathode active materials command the largest revenue share in the Battery Materials Recycling Market by application because cathode precursors (NMC 811, NMC 622) carry the highest per-kilogram value among recovered outputs. Battery-grade lithium compounds are the fastest-growing application as supply tightness persists despite new mining capacity, making recycled lithium an increasingly cost-competitive alternative [12][5].

By End-User Industry

Segment Key Metric Primary Demand Driver
Automotive 64.7% share (2025) OEM closed-loop contracts
Consumer Electronics 19.8% CAGR (2026–2035) E-waste regulations, urban collection
Energy Storage Systems 21.3% CAGR (2026–2035) Grid-storage retirement cycles
Industrial USD 1.12 Billion (2025) Forklift and UPS battery turnover


The automotive end-user segment drives the Battery Materials Recycling Market because vehicle manufacturers are both the largest source of scrap and the most motivated buyers of recovered materials. Closed-loop supply agreements between automakers and recyclers are tightening this feedback loop, with several OEMs targeting 50% recycled cathode content in new vehicles by 2035 [4][15].


Regional Market Share Analysis

Region Key Metric Primary Investment Themes
Asia-Pacific 54.2% share (2025) Gigafactory-recycler integration, LFP scale
North America 13.1% CAGR (2026–2035) IRA incentives, black-mass refining
Europe USD 5.22 Billion (2025) EU Battery Regulation compliance
South America 4.8% share (2025) Lithium mining-adjacent recycling
Middle East & Africa 9.8% CAGR (2026–2035) Energy-storage deployments, nascent collection
Total USD 29.30 Billion (2025)

The Battery Materials Recycling Market exhibits a pronounced geographic tilt toward Asia-Pacific, where integrated battery manufacturing and recycling clusters operate at scale. North America is the fastest-growing region as IRA incentives catalyze greenfield investments, while Europe's growth is driven by regulatory mandates.


North America

Country Key Metric Key Driver
United States 78.3% of regional share IRA tax credits for domestic recycling
Canada 14.5% of regional share Critical-minerals strategy, Ni-Co mining proximity
Mexico 7.2% of regional share Nearshoring of battery manufacturing


The United States dominates the North American Battery Materials Recycling Market, with Li-Cycle, Redwood Materials, and Aqua Metals collectively commissioning over 150,000 tonnes per year of new processing capacity between 2023 and 2025. The DOE's USD 3.16 billion allocation under the Bipartisan Infrastructure Law has funded eight large-scale recycling projects across Nevada, Alabama, and New York, positioning the U.S. as the primary challenger to China's processing dominance [3][17].

Europe

Country Key Metric Key Driver
Germany 11.4% CAGR (2026–2035) Automotive OEM recycling mandates
United Kingdom USD 0.58 Billion (2025) Post-Brexit critical-minerals strategy
France 10.8% CAGR (2026–2035) Gigafactory buildout in northern France
Italy 6.1% of regional share Lead-acid recycling legacy
Spain 5.3% of regional share Energy-storage deployment growth
Nordic Countries 12.0% CAGR (2026–2035) Northvolt recycling integration
Russia 3.8% of regional share Limited, focused on lead-acid
Rest of Europe 9.7% of regional share Mixed regulatory maturity


Germany anchors Europe's Battery Materials Recycling Market, with BASF, Umicore, and Volkswagen's Salzgitter recycling unit scaling hydrometallurgical capacity to meet the EU's 2031 recycled-content targets. The European Battery Alliance has mobilized over EUR 20 billion in public-private investment across the battery value chain, with recycling accounting for an estimated 12% of that total [14][2].

Asia-Pacific

Country Key Metric Key Driver
China 68.4% of regional share MIIT traceability mandates, GEM, and Brunp scale
India 15.2% CAGR (2026–2035) Battery Waste Management Rules, EV growth
Japan USD 1.38 Billion (2025) Sumitomo and JX Metals recycling
South Korea 10.7% CAGR (2026–2035) SungEel HiTech, battery-maker integration
ASEAN 12.9% CAGR (2026–2035) Nickel smelting hubs in Indonesia
Rest of Asia-Pacific 3.5% of regional share Early-stage development


China's dominance in the Battery Materials Recycling Market reflects its vertically integrated battery ecosystem. GEM Co. and Brunp Recycling (a CATL subsidiary) together process over 300,000 tonnes of spent batteries annually, feeding recovered sulfates directly into cathode precursor production lines. MIIT's 2024 traceability mandate is expected to boost licensed collection rates from an estimated 55% to over 80% by 2028 [10][4].

South America

Country Key Metric Key Driver
Brazil 62.1% of regional share Lead-acid fleet, nascent Li-ion collection
Argentina 22.5% of regional share Lithium mining synergy
Rest of South America 15.4% of regional share Limited infrastructure


South America's Battery Materials Recycling Market is concentrated in Brazil's mature lead-acid recycling network, which processes over 400,000 tonnes of batteries annually. Argentina and Chile are exploring pilot projects that integrate lithium recycling with their existing mining operations, potentially creating a closed-loop model from mine to cell to recovery [7].

Middle East & Africa

Country Key Metric Key Driver
Saudi Arabia 28.7% of regional share NEOM and Vision 2030 circular-economy goals
UAE 24.3% of regional share Free-zone recycling facilities
South Africa 21.5% of regional share Lead-acid recycling legacy, mining sector
Egypt 12.8% of regional share Growing solar-storage deployments
Rest of MEA 12.7% of regional share Nascent formal collection


The Middle East & Africa region represents the smallest share of the Battery Materials Recycling Market, but is recording above-average growth driven by energy-storage deployments in the Gulf states and South Africa's established lead-acid recycling operations. Saudi Arabia's National Industrial Development and Logistics Program has earmarked recycling infrastructure as a strategic priority under Vision 2030 [7].


Battery Materials Recycling Market By Region, 2025-2035

Competitive Benchmarking

The Battery Materials Recycling Market exhibits medium concentration, with the top five companies accounting for an estimated 38–44% of global revenue. The competitive landscape is fragmenting as venture-backed startups enter alongside established mining and chemical companies, creating a multi-tier ecosystem of integrated processors, specialist black-mass producers, and collection-network operators.

Company Est. Revenue Share Range Key Offerings Strategic Positioning
Umicore ~8–11% Hydromet NMC recovery, cathode precursors Integrated refiner-to-cathode player in Europe
GEM Co., Ltd. ~7–10% Full-cycle Li-ion and cobalt recycling China's largest recycler by volume
Brunp Recycling (CATL) ~6–9% Closed-loop cathode material supply Vertically integrated with parent CATL
Glencore ~5–8% Lead-acid smelting, Li-ion black mass Global commodity trader with recycling assets
Li-Cycle Holdings ~4–7% Spoke-and-hub hydromet model North America's largest pure-play Li-ion recycler
Redwood Materials ~4–6% Anode copper foil, cathode precursors Founded by an ex-Tesla CTO, Nevada operations
SungEel HiTech ~3–5% Hydromet Li-ion processing South Korea's leading recycler, global expansion
Ecobat Technologies ~3–5% Lead-acid recycling, collection logistics Largest lead-acid recycler in Europe
Aqua Metals ~2–4% AquaRefining electrochemical process Clean lead recycling, expanding to Li-ion
Retriev Technologies ~2–3% Multi-chemistry battery recycling Oldest North American Li-ion recycler


Recent News & Developments

  • Li-Cycle Holdings (October 2024): Secured USD 475 million in DOE loan guarantees for its Rochester Hub hydrometallurgical facility, the largest single recycling investment in North America [3].
  • Redwood Materials (August 2024): Broke ground on a USD 3.5 billion battery materials campus in South Carolina, targeting 100 GWh of annual recycling and re-manufacturing capacity by 2028 [16].
  • European Commission (February 2024): Published implementing rules for the EU Battery Regulation's digital battery passport, mandating chemistry and recycled-content disclosures from February 2027 [2].


  • Umicore (March 2024): Opened a EUR 400 million battery recycling plant in Hoboken, Belgium, doubling its European hydromet processing capacity to 150,000 tonnes per year [8].
  • Brunp Recycling (November 2023): Commissioned a 100,000-tonne-per-year LFP recycling line in Changsha, addressing the growing volume of iron-phosphate chemistry entering China's waste stream [10].
  • U.S. Department of Energy (September 2023): Awarded USD 192 million across 17 projects through the ReCell Center's second funding round, targeting direct recycling and lithium recovery process innovations [13].


Battery Materials Recycling Market Report Scope

Parameter Details
Market Scope Global Battery Materials Recycling Market covering all major battery chemistries, recycling technologies, process stages, recovered-material applications, end-user industries, and five geographic regions
Study Period 2021–2035
CAGR (Forecast) 10.2% (2026–2035)
Base Year 2025 — USD 29.30 Billion
Forecast Endpoint 2035 — USD 77.07 Billion
Fastest Growing Segments Lithium-ion (by chemistry), Hydrometallurgical (by technology), North America (by region)
Companies Profiled Umicore, GEM Co., Brunp Recycling, Glencore, Li-Cycle, Redwood Materials, SungEel HiTech, Ecobat Technologies, Aqua Metals, Retriev Technologies
Valuation Currency USD Billion


FAQs

What minimum throughput makes a lithium-ion recycling plant economically viable?
Most hydrometallurgical plants require 10,000–15,000 tonnes per year of feedstock to break even, assuming NMC-dominant input and 2025 metal prices [19]. Modular spoke-and-hub designs can lower that threshold by centralizing refining.
How do battery passport requirements affect recycler procurement strategies?
Digital passports let recyclers pre-sort feedstock by chemistry before physical intake, cutting processing costs by an estimated 15–20% [14]. Early adopters gain preferred-supplier status with OEMs mandating passport compliance.
Which recovered material carries the highest margin for recyclers in the Battery Materials Recycling Market?
Battery-grade cobalt sulfate commands the highest per-kilogram margin due to supply concentration in the DRC and strong cathode demand [5]. Margins compress when cobalt spot prices fall below USD 30,000 per tonne.
How does the Battery Materials Recycling Market handle mixed-chemistry feedstock contamination?
Automated X-ray fluorescence sorting at intake identifies cell chemistry with over 95% accuracy [13]. Misidentified cells can contaminate leaching solutions, so most plants add manual verification for high-value NMC streams.
What role do tariffs play in cross-border black-mass trade within the Battery Materials Recycling Market?
The U.S. classified black mass as a processed intermediate in 2024, subjecting imports to Section 301 tariffs of up to 25% [17]. This tariff wall incentivizes domestic refining over exporting concentrate to Asian smelters.
Are recyclers exposed to stranded-asset risk from battery chemistry shifts?
Facilities designed solely for NMC processing face retrofit costs if LFP or sodium-ion volumes dominate future feedstock [19]. Chemistry-agnostic modular platforms mitigate this risk.
How do second-life battery economics interact with the Battery Materials Recycling Market?
Repurposing delays final recycling by 5–8 years, reducing near-term feedstock but increasing long-term volumes [11]. Recyclers partnering with second-life operators secure future feedstock commitments today.    
Author
Author
Author Profile
Chitranshi Jaiswal LinkedIn
Team Lead - Research
Chitranshi is a Team Leader in the Chemicals & Materials (CnM) and Energy & Power (EnP) domains, with 6+ years of experience in market research. She leads and mentors teams to deliver cross-domain projects that equip clients with actionable insights and growth strategies. She is skilled in market estimation, forecasting, competitive benchmarking, and both primary & secondary research, enabling her to turn complex data into decision-ready insights. An engineer and MBA professional, she combines technical expertise with strategic acumen to solve dynamic market challenges. Chitranshi has successfully managed projects that support market entry, investment planning, and competitive positioning, while building strong client relationships. Certified in Advanced Excel & Power BI she leverages data-driven approaches to ensure accuracy, clarity, and impactful outcomes.

Research Approach


Secondary Research

The secondary research process involved comprehensive analysis of regulatory databases, industry publications, technical journals, government reports, and authoritative energy organizations. Key sources included the US Environmental Protection Agency (EPA), Department of Energy (DOE) Office of Energy Efficiency & Renewable Energy, European Commission Directorate-General for Environment, European Battery Alliance, International Energy Agency (IEA) Global EV Outlook, International Renewable Energy Agency (IRENA), US Geological Survey (USGS) Mineral Commodity Summaries, National Renewable Energy Laboratory (NREL), China Ministry of Industry and Information Technology (MIIT), Japan Ministry of Economy Trade and Industry (METI), Korea Institute of Geoscience and Mineral Resources (KIGAM), India Ministry of Environment Forest and Climate Change (MoEFCC), Basel Convention Regional Centres for Hazardous Waste Management, International Battery Association, Society for Mining Metallurgy & Exploration (SME), and national environmental agency reports from key markets.

Statistics on battery waste generation, developments in regulatory frameworks, evaluations of recycling technologies, information on critical mineral supply chains, and an analysis of circular economy policies for recycling technologies for lithium-ion, lead-acid, nickel-cadmium, and nickel-metal hydride batteries were gathered from these sources.


Primary Research

In order to gather both qualitative and quantitative insights, supply-side and demand-side stakeholders were interviewed during the primary research process. CEOs, CTOs of Recycling Technology, heads of Sustainability & ESG, regulatory compliance officials, and commercial directors from material recovery firms, OEMs, and battery recycling operators were among the supply-side sources. Procurement heads from EV and conventional automakers, sustainability executives for consumer electronics brands, energy storage system integrators, industrial battery users, and waste management facility operators were examples of demand-side sources. Market segmentation, technology implementation schedules, and information on feedstock availability trends, recovered material pricing volatility, and regulatory compliance expenses were all verified by primary research.

Primary Respondent Breakdown:

By Designation: C-level Primaries (32%), Director Level (31%), Others (37%)

By Region: North America (32%), Europe (30%), Asia-Pacific (33%), Rest of World (5%)


Market Size Estimation

Revenue mapping and recycling capacity analysis were used to get the global market valuation. The methodology comprised:

Finding more than fifty major recycling companies in North America, Europe, Asia-Pacific, and Latin America

Technology mapping for mechanical, hydrometallurgical, and pyrometallurgical recycling processes

Examination of reported and projected yearly income for battery recycling portfolios

coverage of businesses that account for 75–80% of the world's recycling capacity in 2024

Extrapolation to obtain segment-specific valuations utilizing top-down (operator revenue validation) and bottom-up (recycling volume × recovery yield × material price by region) methods

Download Free Sample

Kindly complete the form below to receive a free sample of this Report

Download PDF ×

We do not share your information with anyone. However, we may send you emails based on your report interest from time to time. You may contact us at any time to opt-out.

















