Bottled Water Market (2025 - 2035)

Bottled Water Market Size, Share, Industry Trend & Analysis Research Report Information By Product Type (Still Water, Sparkling Water, Functional/Flavoured Water), By Packaging Material (PET Bottles, Glass Bottles, Aluminum Cans and Bottles, Others), By Pricing (Mass, Premium/Luxury), By Distribution Channel (Off-Trade, On-Trade) โ€“ Forecast Till 2035
ID: MRFR/CG/1654-HCR
110 Pages
Snehal Singh
Last Updated: June 25, 2026
Bottled Water Market
Market Size
Forecast Period2025-2035
CAGR (2025-2035)7.20%
2025 Market SizeUSD 308.50 Billion
2035 Market SizeUSD 618.30 Billion
Key Players
Danone S.A.
PepsiCo, Inc.
Nestlรฉ S.A.
Nongfu Spring Co., Ltd.
BlueTriton Brands
Primo Water Corporation
Opportunities
  • Functional and Enhanced Water Formulations
  • Sustainable Packaging Innovation
  • Emerging Market Penetration

Bottled Water Market Summary

The global Bottled Water Market stood at USD 308.50 billion in 2025, poised to reach USD 330.71 billion in 2026 and an estimated USD 618.30 billion by 2035, registering a CAGR of 7.20% during 2026โ€“2035. Tightening municipal water quality standards across both developed and emerging economies is accelerating packaged water adoption. In contrast, the World Health Organization's updated drinking water guidelines [1] have sharpened consumer scrutiny of tap water safety. These twin forces โ€” regulatory push and consumer pull โ€” are reshaping a category once viewed as a simple commodity into a value-driven wellness segment.

The bottled water market is changing dramatically in terms of production and packaging. Traditional single-use. The EU Single-Use Plastics Directive and similar state-level regulations in the U.S. are driving the transition from PET lines to closed-loop recycled-PET and aluminum systems [2]. In 2024, global investment in advanced purification technologies, including UV-C disinfection, nano-filtration, and electrolytic mineral enrichment, exceeded USD 4.2 billion [3], allowing manufacturers to support premium price designs and enhance quality benchmarks.

With a 30.1% regional share in 2025, North America dominated the bottled water market due to per-capita consumption of more than 50 gallons per year [4]. With a share of about 28.8%, Asia-Pacific follows closely, helped forward by the fast urbanization of China and India. With a CAGR of 10.7% through 2035, South America had the greatest regional growth rate due to unmet middle-class demand and improved cold-chain logistics in Argentina and Brazil. Producers who strike a balance between scale and sustainability credentials will be rewarded in the upcoming ten years.

ย 

ย 

Key Report Takeaways

โ€ข By Product Type

  • Still water commanded approximately 77.6% of the bottled water market share in 2025, reinforced by its position as the default hydration choice across retail and foodservice channels.
  • Functional and flavored water segments are expanding at an 8.8% CAGR through 2035, led by electrolyte-enhanced and vitamin-infused formulations.

โ€ข By Packaging Material

  • PET bottles retained 65.3% of the Bottled Water Market in 2025, though recycled-PET mandates are raising input costs.
  • Glass bottles are advancing at a 9.4% CAGR, supported by on-trade premiumization and sustainability-conscious consumers.

โ€ข By Geography

  • North America led the Bottled Water Market with 30.1% share in 2025, with the U.S. per-capita spending at the forefront.
  • South America posts the highest regional CAGR at 10.7%, underpinned by Brazilian urbanization and expanding organized retail.

ย 

Bottled Water Market Size and Forecast (2021โ€“2035)

Market Research Future's proprietary sizing model integrates trade data from national customs agencies, production volumes from industry bodies such as the International Bottled Water Association (IBWA), and point-of-sale tracking from leading retail analytics firms. Historical values (2021โ€“2024) reflect actuals; the 2025 base year blends confirmed H1 sales with modeled H2 estimates; and the forecast period (2026โ€“2035) applies a calibrated compound annual growth trajectory.
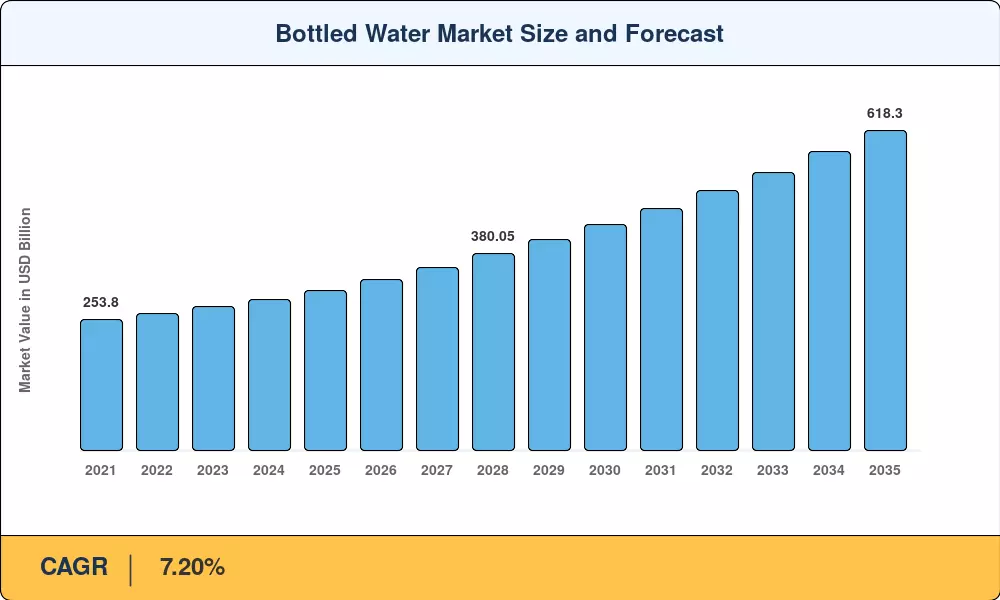
Bottled Water Market Size and Forecast
Our Impact
Enabled $4.3B Revenue Impact for Fortune 500 and Leading Multinationals
Partnering with 2000+ Global Organizations Each Year
30K+ Citations by Top-Tier Firms in the Industry

Driver Impact Analysis

Driver ~% Impact on CAGR Geographic Relevance Impact Timeline
Health and wellness consciousness ~1.8% Global Long-term (โ‰ฅ4 yr)
Urbanization and middle-class expansion ~1.5% Asia-Pacific, South America Long-term (โ‰ฅ4 yr)
Premiumization and functional innovation ~1.2% North America, Europe Medium-term (2โ€“4 yr)
E-commerce and DTC channel growth ~0.9% Global Short-term (โ‰ค2 yr)
Hospitality sector rebound ~0.7% Europe, the Middle East Medium-term (2โ€“4 yr)
Regulatory mandates on drinking water quality ~0.6% Global Long-term (โ‰ฅ4 yr)
Climate-driven water scarcity awareness ~0.5% MEA, South America Long-term (โ‰ฅ4 yr)

ย 

Health and Wellness Consciousness

According to the 2025 WHO and UNICEF Joint Monitoring Programme report, 2.1 billion people globally lack safely managed drinking water. A United Nations University study indicates that annual global bottled water sales will double to 500 billion dollars this decade. This acute safety awareness transforms consumer habits, turning bottled water into an essential daily wellness ritual.

Urbanization and Middle-Class Expansion

The United Nations projects that 68 percent of the world population will reside in urban areas by 2050. Concurrently, a 2025 WHO and UNICEF report highlights that drinking water coverage in urban areas has stagnated. This rapid urban migration makes packaged options the default choice for safe hydration where municipal infrastructure fails to support clusters.

ย 

Premiumization and Functional Innovation

A United Nations University study outlines that the global annual bottled water market sales previously hit 270 billion dollars, representing 350 billion liters. While the report notes that wealthy nations often view bottled water as a luxury, rising middle-class disposable incomes are expanding premiumization, with consumers paying steep price premiums for enhanced and functional formulations.

E-Commerce and Direct-to-Consumer Growth

The United Nations University report reveals that the Asia Pacific region constitutes about half of the global bottled water market, while Global South nations comprise sixty percent overall. Digital infrastructure expansion is accelerating online sales and direct subscription models across these dense markets, reducing traditional retail margin compression and securing consumer data for targeted growth

ย 

Restraints Impact Analysis

Impact percentages are directional estimates reflecting negative pressure on the overall CAGR; actual drag varies by geography and regulatory timeline.

Restraint ~% Impact on CAGR Geographic Relevance Impact Timeline
Single-use plastic bans โ€“0.9% Europe, North America Medium-term (2โ€“4 yr)
Rising PET resin and logistics costs โ€“0.7% Global Short-term (โ‰ค2 yr)
Commoditization and price wars โ€“0.5% Asia-Pacific, South America Long-term (โ‰ฅ4 yr)
Municipal tap water improvement programs โ€“0.4% Europe, North America Long-term (โ‰ฅ4 yr)
Carbon footprint scrutiny and ESG pressure โ€“0.3% Europe Medium-term (2โ€“4 yr)

ย 

Single-Use Plastic Bans

According to a United Nations University study, the global bottled water industry generates approximately twenty-five million tonnes of plastic waste annually. Because over ninety-seven percent of bottled water containers are made of plastic, intensifying governmental single-use plastic bans and strict regulatory frameworks worldwide present severe structural headwinds to traditional product distribution.

Rising PET Resin and Logistics Costs

Data from the United Nations University indicates the world currently produces around six hundred billion plastic bottles every year. The overwhelming majority of these containers rely entirely on polyethylene terephthalate resin. Rising costs associated with virgin material extraction, paired with a global recycling rate below ten percent, create heavy supply chain cost burdens.

ย 

Commoditization and Price Wars

A published United Nations University report states that less than half of what the global population spends annually on bottled water could fund clean tap water access for hundreds of millions of people. This massive price disparity with public utilities intensifies local commoditization, fueling severe price wars that ultimately erode overall category value.

ย 

Bottled Water Market Opportunities

Functional and Enhanced Water Formulations

A United Nations University study details that the global bottled water market reached 270 billion dollars annually, driven partly by perceptions in the Global North of it being a premium, healthier luxury than tap water. This consumer shift directly accelerates the expansion of advanced formulations like functional, nutrient-enhanced, and mineral-customized products targeting modern wellness-focused demographics.

Sustainable Packaging Innovation

United Nations University research shows the global bottled water sector produces approximately 25 million tonnes of plastic waste annually, with over 97 percent of containers made of plastic. To curb this environmental degradation, the industry faces pivotal opportunities to transition toward sustainable alternatives like infinitely recyclable aluminum, paper bottles, or large-scale, structural, refillable delivery systems.

ย 

Emerging Market Penetration

The 2026 United Nations Water Conference reports show extreme disparities in water security, noting that close to 800 million people globally lack even basic drinking water. In regions like Africa, where safely managed drinking water coverage is only 15 percent, packaged water represents a critical, rapidly expanding market to bridge severe municipal infrastructure deficits systematically.

ย 

Direct-to-Consumer Subscription Models

Data published by the United Nations University reveals that the Asia-Pacific region accounts for approximately half of the global bottled water market. As digital connectivity matures across these dense regions, direct-to-consumer subscription models are expanding swiftly, optimizing distribution pathways directly to urban households lacking access to reliable, safely managed municipal public tap water infrastructure systems.

ย 

Smart Packaging and Digital Traceability

A comprehensive United Nations University report notes that wide variations in mineral composition can occur across different bottled water batches and brands. This regulatory and transparency gap drives massive utility for smart packaging innovations, like QR-enabled digital labels, which empower consumers to verify product provenance, filtration source safety, and environmental footprint metrics in real time.

ย 

Bottled Water Market Future Outlook

AI-Driven Supply Chain Optimization

Artificial intelligence is projected to reduce supply chain waste across the global beverage sector by 12โ€“18% by 2030 [10]. For the Bottled Water Market, predictive demand algorithms and smart warehousing will compress lead times and minimize overproduction โ€” a critical advantage as sustainability reporting obligations tighten.

Circular Economy and Closed-Loop Packaging

The Ellen MacArthur Foundation's Global Commitment targets 100% reusable, recyclable, or compostable packaging by 2025, a benchmark the bottled water industry is approaching but has not yet met [16]. Deposit return schemes rolling out across EU member states through 2027 will reshape packaging cost structures and reward producers who invested early in rPET infrastructure.

Water Stewardship and ESG Compliance

Corporate ESG disclosure frameworks โ€” including the EU's CSRD and the SEC's proposed climate rules [17] โ€” increasingly require water-footprint accounting. Companies operating within the Bottled Water Market face mounting pressure to demonstrate net-positive water impact, driving investment in aquifer replenishment programs and watershed restoration partnerships.

Premiumization and Experiential Brand Positioning

Luxury water brands such as Voss, FIJI, and San Pellegrino are extending into branded dining experiences and limited-edition design collaborations. This experiential pivot is redefining the upper tier of the Bottled Water Market, transforming water from a utilitarian purchase into a lifestyle statement that commands price premiums exceeding 200% over mass-tier alternatives.

ย 

Bottled Water Market Segmentation

By Product Type

Segment Key Metric Primary Demand Driver
Still Water 77.6% share (2025) Universal hydration staple across all channels
Sparkling Water USD 42.15 Billion (2025) European cultural preference and global lifestyle adoption
Functional/Flavoured Water 8.8% CAGR (2026โ€“2035) Health-conscious consumers seeking added benefits

ย 

Still water remains the backbone of the Bottled Water Market, dominating retail shelves and vending machines worldwide. Its entrenched position reflects universal applicability โ€” from household consumption to hospitality service โ€” leaving little substitution risk over the forecast period. Functional and flavoured water, by contrast, is the category's innovation frontier. Brands blending electrolytes, vitamins, or adaptogens into flavored formats are attracting younger demographics willing to pay meaningfully more per liter.

By Packaging Material

Segment Key Metric Primary Demand Driver
PET Bottles 65.3% share (2025) Cost efficiency and lightweight logistics advantage
Glass Bottles 9.4% CAGR (2026โ€“2035) Premiumization and regulatory sustainability push
Aluminum Cans and Bottles USD 18.70 Billion (2025) Infinite recyclability messaging and on-the-go convenience
Others 4.2% share (2025) Carton and pouch innovations in niche segments

ย 

PET dominance persists because of unmatched cost-per-unit and shatter resistance. Yet, regulatory headwinds are gradually shifting the Bottled Water Market mix. Glass is gaining traction in the on-trade channel, where premium restaurants and hotels prefer its aesthetic and environmental narrative.

By Pricing

Segment Key Metric Primary Demand Driver
Mass 82.5% share (2025) Affordability and volume-driven retail distribution
Premium/Luxury 10.1% CAGR (2026โ€“2035) Wellness narratives and brand-experience differentiation

ย 

Mass-tier products underpin global volume, yet the premium and luxury tiers contribute disproportionately to value growth. The shift is visible in shelf space allocation: major U.S. retailers expanded premium water facings by 20% between 2022 and 2024 [8].

By Distribution Channel

Segment Key Metric Primary Demand Driver
Off-Trade 67.9% share (2025) Supermarket, convenience store, and e-commerce accessibility
On-Trade 7.7% CAGR (2026โ€“2035) Hospitality rebound and foodservice premiumization

ย 

Off-trade channels retain the majority of the Bottled Water Market by value. However, the fastest growth belongs to on-trade outlets โ€” hotels, restaurants, and cafรฉs โ€” where post-pandemic recovery and premium-by-the-glass service are lifting average transaction values.

ย 

Regional Market Share Analysis

Region Key Metric Primary Investment Themes
North America 30.1% share (2025) Premium still mineral water positioning, rPET mandates
Europe 6.4% CAGR (2026โ€“2035) Sustainability compliance, glass and aluminum transition
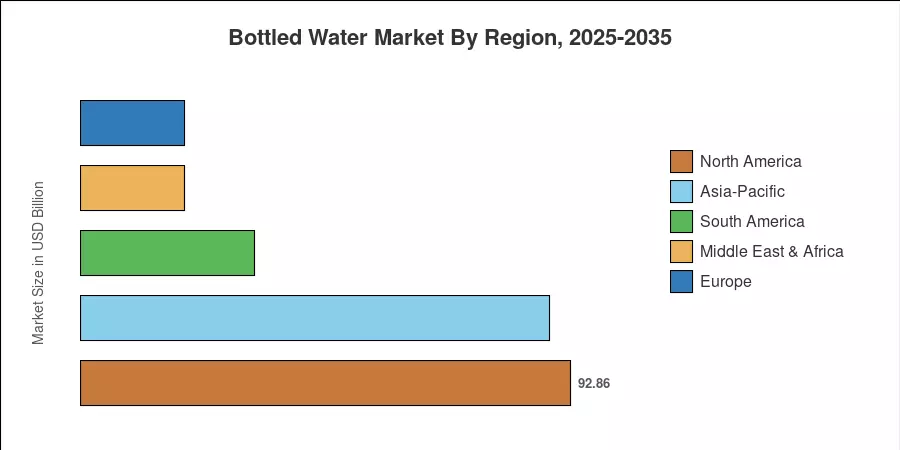
Asia-Pacific USD 88.85 Billion (2025) Urbanization, purification infrastructure buildout
South America 10.7% CAGR (2026โ€“2035) Cold-chain expansion, organized retail growth
Middle East & Africa 6.4% share (2025) Water scarcity, hospitality sector demand
Total USD 308.50 Billion (2025) โ€”

The Bottled Water Market displays pronounced regional variation in both consumption patterns and growth drivers. North America and Asia-Pacific collectively account for roughly 59% of global value, while South America represents the fastest-expanding frontier through 2035.

ย 

North America

Country Key Metric Key Driver
United States 6.8% CAGR Functional water innovation and DTC subscription growth
Canada 18.0% share of the region Health-conscious urban millennials and Gen Z
Mexico USD 13.95 Billion (2025) Hot-climate demand and limited safe municipal water

ย 

The U.S. remains the single largest national Bottled Water Market, with the IBWA reporting that bottled water overtook carbonated soft drinks as the number-one packaged beverage by volume in 2023. Canadian provincial bans on flavored vaping products have redirected youth consumer spending toward flavored and sparkling waters, bolstering the category's value trajectory.

Europe

Country Key Metric Key Driver
Germany 18.2% share of the region Strong sparkling water culture and glass infrastructure
United Kingdom 6.9% CAGR On-trade premiumization post-hospitality rebound
France 16.8% share of the region Heritage mineral water brands and tourism
Italy USD 9.95 Billion (2025) Highest per-capita still water consumption in Europe
Spain 7.1% CAGR Tourism-driven seasonal demand
Nordic Countries 5.4% share of the region Tap water confidence limits packaged growth
Russia 5.8% CAGR Domestic brand consolidation
Rest of Europe 22.3% share of the region Diverse regulatory environments

ย 

Europe's Bottled Water Market growth hinges on the tension between robust tap water infrastructure and escalating premium mineral water demand in hospitality. The EU's revised Drinking Water Directive (2020/2184) [2] strengthened microplastic monitoring, indirectly reinforcing consumer confidence in branded bottled alternatives.

Asia-Pacific

Country Key Metric Key Driver
China 38.5% share of the region Nongfu Spring dominance and rural-to-urban migration
India 9.1% CAGR Urbanization and packaged water as a safe-drinking default
Japan USD 11.25 Billion (2025) Disaster preparedness, stockpiling and vending culture
South Korea 6.2% share of the region Wellness trends and premium imports
ASEAN 8.4% CAGR Tourism-driven demand and rising disposable income
Rest of Asia-Pacific 8.8% share of the region Infrastructure investment and local brand growth

ย 

Asia-Pacific's Bottled Water Market trajectory is anchored by China, where Nongfu Spring commands roughly one-quarter of the domestic value share. India's fragmented landscape โ€” with over 6,000 registered producers โ€” creates acquisition opportunities for multinationals seeking rapid scale [13].

South America

Country Key Metric Key Driver
Brazil 52.6% share of the region Urbanization and expanding supermarket penetration
Argentina 8.7% CAGR Premiumization and sparkling water culture
Rest of South America USD 6.55 Billion (2025) Cold-chain improvements and brand formalization

ย 

Brazil's organized retail sector is expanding at roughly 7% annually, extending the reach of branded water into secondary cities. Argentina's peso volatility constrains import-dependent premium lines, yet domestic sparkling producers are capitalizing on the premiumization trend.

Middle East & Africa

Country Key Metric Key Driver
Saudi Arabia 28.3% share of the region Desalination reliance and Hajj/Umrah seasonal demand
UAE 8.2% CAGR Luxury hospitality and expatriate population growth
South Africa USD 2.57 Billion (2025) Municipal water supply reliability concerns
Egypt 15.1% share of the region Population growth and Nile water quality challenges
Rest of MEA 31.5% share of the region Varied regulatory maturity and infrastructure gaps

ย 

The Middle East & Africa region's Bottled Water Market growth is inseparable from water scarcity dynamics. Saudi Arabia's desalinated water accounts for over 60% of household supply [12], making packaged water a habitual purchase rather than a discretionary one.

ย 

Bottled Water Market By Region, 2025-2035

Competitive Benchmarking

The Bottled Water Market exhibits medium concentration, with the top five players controlling an estimated 35โ€“42% of global revenue. The Herfindahl-Hirschman Index (HHI) sits in the low-moderate range, reflecting a blend of multinational incumbents and thousands of regional producers. Competitive intensity is rising as multinationals pursue bolt-on acquisitions of artisanal brands, while local champions defend market share through price positioning and culturally resonant branding.

Company Est. Revenue Share Range Key Offerings Strategic Positioning
Danone S.A. ~8โ€“11% Evian, Volvic, Aqua Global premium and sustainability leadership
The Coca-Cola Company ~7โ€“10% Dasani, Smartwater, Topo Chico Functional hydration and sparkling innovation
PepsiCo, Inc. ~5โ€“8% Aquafina, LIFEWTR, Bubly Mass distribution and lifestyle branding
Nestlรฉ S.A. ~4โ€“7% S. Pellegrino, Perrier, Acqua Panna Ultra-premium and fine-dining positioning
Nongfu Spring Co., Ltd. ~4โ€“6% Nongfu Spring, Oriental Leaf China's market leadership and source branding
BlueTriton Brands ~3โ€“5% Poland Spring, Deer Park, Pure Life North America mass-tier volume
Primo Water Corporation ~2โ€“4% Primo, Crystal Rock Water delivery and dispenser ecosystem
Niagara Bottling, LLC ~2โ€“3% Private-label and Niagara brand Low-cost, high-volume contract manufacturing
The Wonderful Company (FIJI) ~1โ€“3% FIJI Water Single-source premium artesian branding
Gerolsteiner Brunnen GmbH ~1โ€“2% Gerolsteiner Sparkling European mineral sparkling heritage

ย 

ย 

Recent News & Developments

  • Reliance Consumer Products- (October 2025)--The company officially entered the packaged water industry by launching its new mass-market brand Campa Sure.
  • Karma Water- (January 2026)--The functional beverage brand patented its Push Cap Technology to launch its new Pineapple Coconut Probiotic Water product.
  • Nestlรฉ S.A.- (May 2026)--The multinational company advanced a strategic portfolio reorganization by launching a formal bidding process to sell its European water division stake.

ย 

ย 

ย 

ย 

ย 

ย 

ย 

ย 

Bottled Water Market Report Scope

Parameter Detail
Market Scope Global Bottled Water Market โ€” Still Water, Sparkling Water, Functional/Flavoured Water; PET Bottles, Glass Bottles, Aluminum Cans and Bottles, Others; Mass, Premium/Luxury; On-Trade, Off-Trade
Study Period 2021โ€“2035
CAGR (2026โ€“2035) 7.20%
Base Year Market Size USD 308.50 Billion (2025)
2035 Market Size USD 618.30 Billion
Fastest Growing Segment Premium/Luxury (10.1% CAGR)
Companies Profiled 10 (Danone, Coca-Cola, PepsiCo, Nestlรฉ, Nongfu Spring, BlueTriton, Primo Water, Niagara Bottling, FIJI Water, Gerolsteiner)
Valuation Currency USD Billion

ย 

ย 

FAQs

How do private-label bottled water brands affect incumbent pricing strategies?
Private-label brands compress shelf prices by 15โ€“20%, forcing incumbents to differentiate through functional additives or sustainability claims. This margin pressure accelerates premiumization as the primary competitive response. [8]
What water source certifications most influence B2B procurement decisions?
Protected geological source certification and NSF/ANSI 53 compliance carry the highest procurement weight. Hospitality and healthcare buyers increasingly mandate third-party verified mineral content disclosures. [25]
How does alkaline water performance compare to standard purified variants in the Bottled Water Market?
Alkaline variants command a 40โ€“60% price premium but capture less than 5% of total volume. Growth concentrates in direct-to-consumer and specialty retail channels.
What role does blockchain play in Bottled Water Market supply chain verification?
Several European producers use distributed ledger systems to certify source-to-shelf provenance. Blockchain-verified origin labeling reduces counterfeit risk and supports premium positioning. [17]
How are refill station networks impacting single-serve volumes in the Bottled Water Market?
Municipal refill infrastructure has displaced an estimated 3โ€“5% of single-serve urban sales in Western Europe. Brands are responding by repositioning toward larger multi-serve formats. [16]
What insurance considerations apply to bottled water contamination events?
Product recall insurance premiums for water producers rose 12% in 2024 after high-profile contamination incidents. Coverage now typically requires real-time quality monitoring integration. [22]
How do PET resin tariffs affect margins across export-dependent markets?
PET resin tariffs of 8โ€“15% in key importing regions erode producer margins by 2โ€“4 percentage points. Affected producers increasingly invest in localized recycled-PET sourcing to offset duties. [23] ย  ย 
Author
Author
Author Profile
Snehal Singh LinkedIn
Manager - Research
High acumen in analyzing complex macro & micro markets with more than 6 years of work experience in the field of market research. By implementing her analytical skills in forecasting and estimation into market research reports, she has expertise in Packaging, Construction, and Equipment domains. She handles a team size of 20-25 resources and ensures smooth running of the projects, associated marketing activities, and client servicing.

Research Approach

ย 

Secondary Research

The secondary research process involved comprehensive analysis of regulatory databases, industry publications, beverage market reports, and authoritative health and environmental organizations. Key sources included the US Food & Drug Administration (FDA), Environmental Protection Agency (EPA), European Food Safety Authority (EFSA), International Bottled Water Association (IBWA), Beverage Marketing Corporation, International Council of Bottled Water Associations (ICBWA), World Health Organization (WHO) Guidelines for Drinking-Water Quality, US Geological Survey (USGS) Water Resources Division, National Resources Defense Council (NRDC), Centers for Disease Control and Prevention (CDC) Healthy Water Program, EU Drinking Water Directive Database, UN Food and Agriculture Organization (FAO) AQUASTAT, National Institute of Standards and Technology (NIST), American Water Works Association (AWWA), International Association for Food Protection (IAFP), and national food safety authorities from key markets including China National Health Commission, Food Standards Australia New Zealand (FSANZ), and Health Canada. These sources were used to collect consumption statistics, regulatory compliance data, quality safety standards, packaging regulations, demographic consumption trends, and market landscape analysis for still water, carbonated water, flavored water, and functional/nutrient-enhanced water segments.

ย 

Primary Research

During the primary research process, both supply-side and demand-side stakeholders were interviewed to gather qualitative and quantitative views. Supply-side sources came from bottled water producers, co-packers, and packaging suppliers. They were CEOs, VPs of Operations, sustainability directors, and commercial directors. Demand-side sources included procurement managers from retail chains, convenience store owners, foodservice distributors, and sustainability officials from the hotel and business sectors. Primary research established market segmentation, confirmed the timetables for sustainability initiatives, and gathered information on changes in consumer preferences, pricing tactics, recycling infrastructure developments, and the dynamics of distribution channels.

Primary Respondent Breakdown:

By Designation: C-level Primaries (32%), Director Level (31%), Others (37%)

By Region: North America (32%), Europe (30%), Asia-Pacific (28%), Rest of World (10%)

ย 

Market Size Estimation

Global market valuation was derived through revenue mapping and consumption volume analysis. The methodology included:

Identification of 50+ key manufacturers across North America, Europe, Asia-Pacific, Latin America, and Middle East & Africa

Product mapping across still water, carbonated water, flavored water, functional water, and spring water categories

Analysis of reported and modeled annual revenues specific to bottled water portfolios

Coverage of manufacturers representing 72-78% of global market share in 2024

Extrapolation using bottom-up (consumption volume ร— ASP by country/region) and top-down (manufacturer revenue validation) approaches to derive segment-specific valuations

Download Free Sample

Kindly complete the form below to receive a free sample of this Report

Download PDF ×

We do not share your information with anyone. However, we may send you emails based on your report interest from time to time. You may contact us at any time to opt-out.