Chlor Alkali Market (2026 - 2035)

Chlor-Alkali Market Research Report Information By Application (Chlorine {Water Treatment, Paper & Pulp, Inorganics, Intermediates, Organics, Vinyl, and Others} and Caustic Soda {Textile, Alumina, Soap & Detergents, Organics, Inorganics, Pulp & Paper, Water Treatment, and others}), And By Region (North America, Europe, Asia-Pacific, And Rest Of The World) – Market Forecast Till 2035
ID: MRFR/CnM/1434-HCR
111 Pages
Chitranshi Jaiswal
Last Updated: June 25, 2026
Chlor Alkali Market
Market Size
Forecast Period2026-2035
CAGR (2026-2035)3.40%
2025 Market SizeUSD 78,500 Million
2035 Market SizeUSD 109,650 Million
Key Players
Olin Corporation
Westlake Chemical Corporation
Dow Inc.
Formosa Plastics Corporation
Tosoh Corporation
INEOS Group
Opportunities
  • Green Hydrogen Co-Product Revenue Streams
  • Zero-Liquid-Discharge Compliance Solutions
  • Emerging Market Capacity Development

Chlor Alkali Market Summary

The Chlor-Alkali Market reached USD 78,500 million in 2025 and is projected to grow from USD 81,170 million in 2026 to USD 109,650 million by 2035, registering a CAGR of 3.40% during the forecast period. This expansion is anchored to rising demand from water treatment infrastructure programs worldwide and tightening environmental mandates that are forcing plant operators to modernize aging capacity. The European Union's Industrial Emissions Directive, which mandated the retirement of all mercury-based chlor-alkali cells by December 2023 [1], has triggered a capital cycle that continues to reshape global supply balances through 2035.

The trend of the chlor-alkali market is centered on technological transformation. Membrane cell technology is gradually replacing legacy diaphragm and mercury cell installations, which used to account for more than half of Western capacity. Currently, membrane cells use less than 2,100 kWh per ton of caustic soda produced, which is around 30% less than diaphragm substitutes [2]. Industrial decarbonization schemes that directly support membrane conversions and hydrogen by-product capture have received incentives totaling more than USD 1.8 billion from the governments of North America and Europe [3].

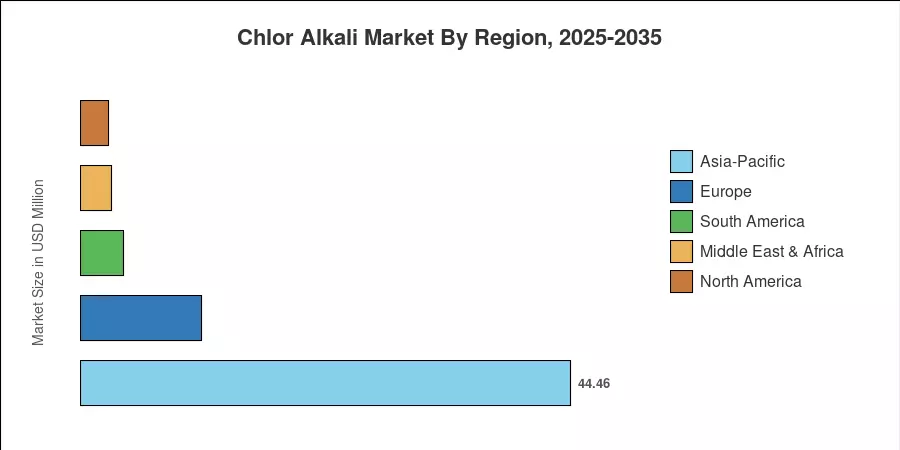
Asia-Pacific is by far the leading region, holding around 57.0% of the Chlor-Alkali Market. With capacity additions in China and India linked to downstream PVC, alumina, and textile demand, the area is also the fastest-growing, with a 3.50% CAGR through 2035. Thanks to integrated chemical complexes along the US Gulf Coast and shale-gas cost advantages, North America commands around 18.5% of the worldwide market. Europe makes up about 15% of the total, where carbon pricing mechanisms and zero-liquid-discharge laws are accelerating capacity migration toward more efficient units.


Key Report Takeaways

• By Product

  • Chlorine held a 37.5% share of the Chlor-Alkali Market in 2025, driven by downstream vinyl chloride monomer and water disinfection demand.
  • Caustic soda is expanding at the fastest pace among product segments, underpinned by alumina refining and pulp bleaching applications globally.

• By Production Process

  • Membrane cell technology accounted for a 57.5% share of the Chlor-Alkali Market in 2025, reflecting ongoing conversions from legacy cell types.
  • Diaphragm cell installations continue to contract as operators face rising energy costs and stricter emission standards.

• By Application

  • Pulp and paper represented a 33.5% share of the Chlor-Alkali Market in 2025, anchored by bleaching chemical requirements in integrated paper mills.
  • Organic chemicals and alumina refining are emerging as high-growth application verticals through 2035.

• By Region

  • Asia-Pacific captured 57.0% of the Chlor-Alkali Market in 2025 and leads all regions in absolute capacity additions.
  • North America is advancing at a 3.30% CAGR, supported by integrated petrochemical complexes and favorable energy pricing.

Chlor-Alkali Market Size and Forecast (2021–2035)

Market Research Future employs a triangulated research methodology combining bottom-up capacity utilization analysis, trade flow modeling, and top-down demand estimation from downstream consumption sectors. Historical figures (2021–2024) reflect verified production and trade data, while the forecast period (2026–2035) is constructed using proprietary regression models calibrated to energy pricing, regulatory timelines, and downstream GDP elasticity.
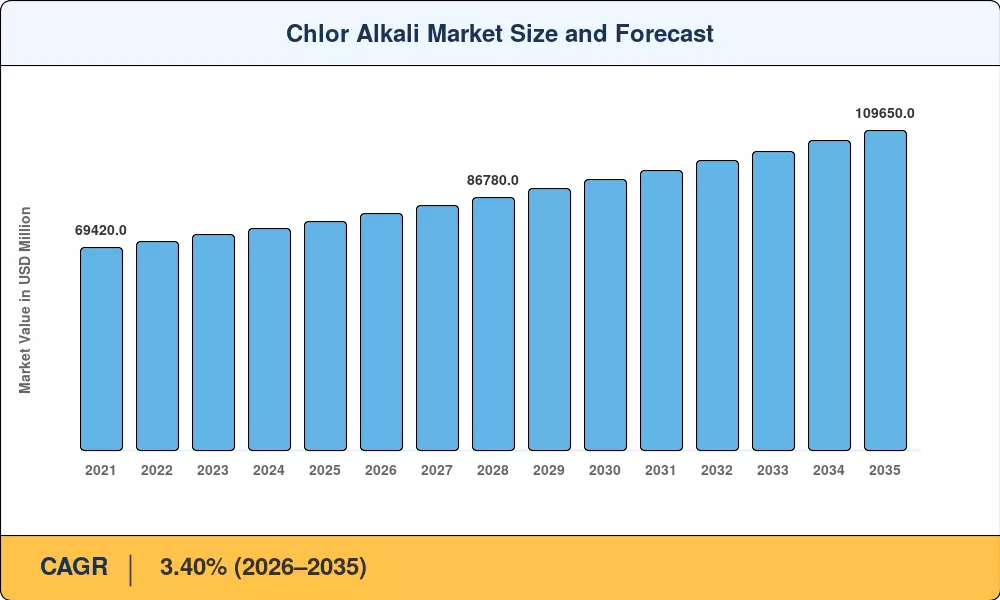
Chlor Alkali Market Size and Forecast
Our Impact
Enabled $4.3B Revenue Impact for Fortune 500 and Leading Multinationals
Partnering with 2000+ Global Organizations Each Year
30K+ Citations by Top-Tier Firms in the Industry

Driver Impact Analysis

Driver ~% Impact on CAGR Geographic Relevance Impact Timeline
Water treatment infrastructure expansion +0.65% Global Long-term (≥4 yr)
Membrane cell conversion mandates +0.55% Europe, North America Short-term (≤2 yr)
PVC and vinyl downstream demand +0.50% Asia-Pacific Medium-term (2–4 yr)
Alumina refining capacity growth +0.40% Asia-Pacific, Oceania Medium-term (2–4 yr)
Hydrogen by-product monetization +0.35% North America, Europe Long-term (≥4 yr)
Industrial decarbonization incentives +0.30% North America, Europe Short-term (≤2 yr)
Textile and detergent sector growth +0.20% South Asia, Africa Long-term (≥4 yr)


Water Treatment Infrastructure Expansion

Global spending on municipal and industrial water treatment is projected to exceed USD 130 billion annually by 2030, according to the World Bank's Water Global Practice estimates [9]. Chlorine remains the dominant disinfection chemical in over 85% of centralized water treatment facilities, and this demand floor provides a structural baseline for the Chlor-Alkali Market. Countries across Sub-Saharan Africa and South Asia are deploying chlorine-based treatment at unprecedented scale, with India's Jal Jeevan Mission alone targeting 190 million rural household tap connections by 2026 [7].

Membrane Cell Conversion Mandates

The European Commission's Best Available Techniques Reference Document for chlor-alkali production effectively mandated that all remaining mercury cell operations cease by December 2023 [1]. This regulatory deadline triggered over USD 4.2 billion in membrane cell retrofit investments across Germany, France, and the Nordic countries between 2018 and 2024. The resulting efficiency gains — energy consumption dropping from roughly 3,400 kWh/ton to below 2,100 kWh/ton — are lowering marginal production costs and reinforcing the economic case for further conversions in North America.

PVC and Vinyl Downstream Demand

Polyvinyl chloride manufacturing consumes approximately 35% of global chlorine output, making vinyl chain economics a primary demand driver for the Chlor-Alkali Market [10]. China's construction and infrastructure pipeline, while moderating from peak growth, still absorbs over 22 million tons of PVC annually. Southeast Asian nations — Vietnam, Indonesia, and the Philippines — are adding combined PVC capacity exceeding 3 million tons through 2030, pulling chlorine demand eastward and tightening regional supply-demand balances.

Alumina Refining Capacity Growth

Caustic soda consumption in the Bayer process for alumina extraction accounts for roughly 8% of global caustic demand [11]. Australia's alumina refineries and China's expanding smelter network are locking in long-term caustic offtake agreements spanning 5–10 years to hedge against spot price volatility. Indonesia's downstream mineral processing mandate, which restricts raw bauxite exports, is expected to add 6 million tons of alumina refining capacity by 2032, directly increasing regional caustic soda pull.

Restraints Impact Analysis

The restraint estimates below represent directional headwinds to baseline growth. These percentages reflect scenario-weighted impacts and are not directly subtracted from the headline CAGR.

Restraint ~% Impact on CAGR Geographic Relevance Impact Timeline
High energy intensity and electricity costs −0.40% Europe, Japan Short-term (≤2 yr)
Environmental and mercury disposal liabilities −0.30% Europe, North America Medium-term (2–4 yr)
Chlorine transport safety regulations −0.20% Global Long-term (≥4 yr)
Overcapacity risk in the Chinese market −0.25% Asia-Pacific Medium-term (2–4 yr)
Substitution pressure from alternative disinfectants −0.15% North America, Europe Long-term (≥4 yr)


High Energy Intensity and Electricity Costs

Electricity represents 50–60% of total chlor-alkali production costs, making this industry one of the most energy-sensitive segments in commodity chemicals [14]. European producers operating under wholesale power prices exceeding EUR 80/MWh face margin compression that has already triggered temporary curtailments at facilities in Germany and Belgium. Japan's post-Fukushima energy mix continues to burden domestic producers with electricity costs 40% above the global median, eroding competitive positioning against Middle Eastern rivals.

Overcapacity Risk in the Chinese Market

China's massive buildout of combined caustic soda and chlorine facilities has consistently outpaced domestic requirements, occasionally suppressing operating rates during real estate and property sector demand troughs. This structural surplus routinely impacts regional pricing and creates global trade friction, as excess Chinese caustic soda volumes flow heavily into Southeast Asian merchant markets. For the broader Chlor-Alkali Market, this capacity imbalance introduces pricing volatility that discourages greenfield capital investment in neighboring economies.


Chlorine Transport Safety Regulations

Bulk chlorine gas transport by rail and road faces stringent safety and handling requirements under UN Globally Harmonized System (GHS) classifications and national hazardous materials frameworks. Regulatory compliance standards enforced by the US Department of Transportation's Pipeline and Hazardous Materials Safety Administration (PHMSA) continually elevate logistics and insurance liabilities for chlorine container shipments. These transportation constraints strongly incentivize localized, on-site chlorine generation—particularly electrochlorination systems for water utilities—which allows consumers to bypass the merchant chlorine transport market entirely.


Chlor Alkali Market Opportunities

Green Hydrogen Co-Product Revenue Streams

Membrane cell electrolysis inherently produces hydrogen at a purity of 99.9%, positioning chlor-alkali plants as potential nodes in regional hydrogen supply chains. The US Department of Energy's Hydrogen Shot initiative targets USD 1/kg clean hydrogen by 2031 [3], and several Gulf Coast chlor-alkali operators are already piping hydrogen by-product into nearby refinery networks. This secondary revenue stream could offset 8–12% of operating costs for integrated facilities.

Zero-Liquid-Discharge Compliance Solutions

Tightening industrial wastewater regulations across the EU, China, and India are creating demand for integrated chlor-alkali solutions that embed closed-loop brine recycling and waste minimization. Producers who can offer turnkey ZLD-compliant plant designs gain a differentiation advantage over commodity suppliers. The EU's updated Industrial Emissions Directive requires BAT-associated emission levels for new permits starting in 2026.

Emerging Market Capacity Development

Sub-Saharan Africa and Central Asia represent significant white space for the Chlor-Alkali Market, with per-capita caustic soda consumption at less than one-fifth of the global average [13]. Ethiopia, Nigeria, and Kenya are pursuing domestic chlor-alkali capacity to reduce import dependence for water treatment chemicals. International development finance institutions have earmarked over USD 600 million for industrial chemical self-sufficiency programs in these regions through 2030.

Digital Twin and Predictive Operations Platforms

Advanced process control systems integrating real-time electrode monitoring, brine quality analytics, and predictive maintenance algorithms are reducing unplanned downtime by 15–20% at early-adopter facilities [18]. Producers investing in digital twin platforms can optimize current density across membrane stacks, reducing specific energy consumption by an additional 3–5% beyond baseline membrane cell efficiency. This operational advantage scales with plant size, favoring large integrated operators.

Specialty Caustic Grades and High-Purity Applications

Growing demand from semiconductor fabrication, pharmaceutical synthesis, and lithium-ion battery electrolyte production is opening premium pricing channels for high-purity caustic soda (≥99.5% NaOH). These niche applications command pricing premiums of 25–40% over standard-grade caustic, offering margin expansion for producers willing to invest in polishing and filtration infrastructure.

Chlor Alkali Market Future Outlook

Electrification and Energy Transition Integration

The Chlor-Alkali Market sits at a unique intersection of the global energy transition—simultaneously benefiting from and being challenged by widespread industrial electrification. The International Energy Agency (IEA) highlights that rising global electricity demand is intensifying competition for low-cost power among electrochemical industries. Within this framework, chlor-alkali producers that successfully secure long-term renewable power purchase agreements (PPAs) will gain a decisive structural cost advantage. At the same time, facilities reliant on unhedged fossil-fueled grids face escalating operational volatility and indirect emissions liabilities.


Circular Economy and Brine Recycling

Evolving circular economy frameworks are increasingly pushing chemical manufacturers toward closed-loop brine management systems designed to minimize waste salt discharge and industrial water consumption. Compliance with best available environmental practices requires heightened technical focus on effluent quality and wastewater reduction. Producers who invest proactively in advanced ion-exchange brine polishing, high-tier purification efficiency, and membrane longevity optimization will capture strong operational advantages in an increasingly regulated global market.


AI-Driven Process Optimization

Artificial intelligence and advanced automation are progressively entering the Chlor-Alkali Market through real-time electrode health monitoring, demand-side forecasting, and integrated energy management systems. Early deployments demonstrate that dynamic current density adjustments—based on real-time grid electricity price signals and membrane degradation curves—can lower specific power consumption. Over the coming decade, autonomous process control systems are expected to expand across large-scale manufacturing sites to maximize electrolysis efficiency.


Sustainability Reporting and ESG Compliance

The Chlor-Alkali Market faces intensifying scrutiny under corporate sustainability reporting frameworks, such as the EU Corporate Sustainability Reporting Directive (CSRD). Large-scale producers must accurately quantify and disclose direct and indirect carbon footprints across their operations, alongside remediation liabilities and environmental impacts. Companies that proactively adopt third-party verified sustainability metrics—such as EcoVadis or CDP benchmarks—will distinguish themselves in corporate procurement processes, where rigorous environmental, social, and governance (ESG) scoring heavily influences supplier selection.


Chlor Alkali Market Segmentation

By Product

Segment Key Metric Primary Demand Driver
Caustic Soda 3.65% CAGR (2026–2035) Alumina, pulp/paper, textile processing
Chlorine 37.5% share (2025) Water treatment, PVC and organic chemicals
Soda Ash USD 6,280 Million (2025) Glass manufacturing, detergents


Chlorine remains the largest product segment in the Chlor-Alkali Market by volume share, driven by its irreplaceable role in water disinfection and vinyl chloride monomer synthesis. Roughly 35% of global chlorine output feeds into PVC production chains, while another 20% serves water treatment applications. The electrochemical co-production relationship between chlorine and caustic soda creates a unique market dynamic: demand surges for one product inevitably generate surplus supply of the other, leading to periodic pricing imbalances that producers manage through downstream integration and storage infrastructure.

Caustic soda is growing at the fastest rate among products, propelled by alumina refining expansions across Asia-Pacific and rising demand from kraft pulping operations. The Bayer process alone consumes over 60 kg of caustic soda per ton of alumina produced [11], and Indonesia's downstream processing mandates are creating significant new demand pools.

By Production Process

Segment Key Metric Primary Demand Driver
Membrane Cell 57.5% share (2025) Energy efficiency, regulatory mandates
Diaphragm Cell 3.10% CAGR (2026–2035) Legacy installations, retrofit cycles
Other Processes USD 2,350 Million (2025) Niche applications, emerging technologies


Membrane cell technology dominates the Chlor-Alkali Market and continues to gain share as producers replace aging diaphragm and mercury installations. A modern membrane cell consumes approximately 2,000–2,200 kWh per ton of caustic produced, compared to 2,800–3,200 kWh for diaphragm cells [2]. This 30–35% energy advantage translates into operating cost savings of USD 40–60 per ton at prevailing European electricity prices. The technology also produces chlorine and caustic soda at higher purity levels, reducing downstream processing costs for specialty-grade applications.

By Application

Segment Key Metric Primary Demand Driver
Pulp and Paper 33.5% share (2025) Chlorine dioxide bleaching, kraft pulping
Organic Chemicals 3.55% CAGR (2026–2035) EDC, VCM, epichlorohydrin production
Inorganic Chemicals USD 10,200 Million (2025) Sodium hypochlorite, HCl manufacturing
Soaps and Detergents 3.30% CAGR (2026–2035) Consumer and industrial cleaning
Alumina 8.5% share (2025) Bayer process caustic consumption
Others USD 7,850 Million (2025) Water treatment, food processing


Pulp and paper leads the Chlor-Alkali Market by application share, as integrated paper mills consume both chlorine (as chlorine dioxide for ECF bleaching) and caustic soda (for kraft cooking liquor). The global shift toward elemental chlorine-free bleaching has actually sustained chlor-alkali demand by requiring chlorine dioxide generation on-site, maintaining the link between pulp production and upstream chlor-alkali consumption [22]. Organic chemicals represent the fastest-growing application, driven by ethylene dichloride and vinyl chloride monomer demand in PVC manufacturing chains across the Asia-Pacific.

Regional Market Share Analysis

Region Key Metric Primary Investment Themes
Asia-Pacific 57.0% share (2025) Capacity expansion, downstream integration
North America 3.30% CAGR (2026–2035) Membrane conversions, hydrogen monetization
Europe USD 11,775 Million (2025) Regulatory compliance, energy transition
South America 5.0% share (2025) Pulp/paper demand, import substitution
Middle East & Africa 3.55% CAGR (2026–2035) Feedstock cost advantage, greenfield builds
Total USD 78,500 Million (2025)


North America

Country Key Metric Key Driver
US 78% of regional share Gulf Coast integrated complexes
Canada 3.20% CAGR Pulp/paper and potash processing
Mexico USD 820 Million (2025) Water treatment infrastructure expansion


The North American Chlor-Alkali Market benefits from structurally low natural gas prices — Henry Hub averaging below USD 3.50/MMBtu through 2025 — which translates into competitive electricity costs for electrochemical processes. Olin Corporation and Westlake Chemical dominate US production along the Gulf Coast, where proximity to ethylene crackers and PVC plants creates an integrated demand pull. The Inflation Reduction Act's Section 45V clean hydrogen production tax credit is catalyzing investment in hydrogen capture from existing chlor-alkali operations [12].

Europe

Country Key Metric Key Driver
Germany 28% of the regional share Automotive and chemical manufacturing
UK 3.15% CAGR Water utility demand
France USD 1,520 Million (2025) Nuclear-powered energy cost advantage
Italy 12% of regional share Textile and detergent industries
Spain 3.10% CAGR Growing water treatment needs
Nordic Countries USD 980 Million (2025) Pulp/paper integration
Russia 8% of regional share Alumina and metals processing
Rest of Europe 3.05% CAGR Varied industrial applications


Europe's Chlor-Alkali Market is undergoing a structural transition driven by the EU BAT Reference Document and carbon border adjustment mechanisms. Germany's chemical corridor along the Rhine hosts over 40% of Western European caustic soda capacity, though high electricity prices have prompted several producers to curtail output during peak demand periods [14]. The EUETS carbon price — trading above EUR 55/ton through 2025 — adds approximately EUR 15–20/ton to chlor-alkali production costs, accelerating retirement of older diaphragm units and favoring efficient membrane plants [8].

Asia-Pacific

Country Key Metric Key Driver
China 62% of regional share PVC and alumina downstream demand
India 3.70% CAGR Water treatment and textile sectors
Japan USD 3,200 Million (2025) High-purity chemical manufacturing
South Korea 8% of regional share Petrochemical integration
ASEAN 3.60% CAGR Infrastructure-driven chlorine demand
Rest of Asia-Pacific USD 1,850 Million (2025) Diversified industrial growth


Asia-Pacific dominates the global Chlor-Alkali Market with over half of the installed capacity concentrated in China's Shandong, Jiangsu, and Inner Mongolia provinces. India represents the fastest-growing major country market, with domestic chlor-alkali capacity expanding at over 1 million tons annually to serve water treatment mandates under the Jal Jeevan Mission and rising demand from viscose staple fiber and alumina producers [7]. Japan's market is mature but strategically important, as domestic producers like Tosoh Corporation and AGC Inc. focus on high-purity grades for semiconductor and pharmaceutical applications.

South America

Country Key Metric Key Driver
Brazil 68% of regional share Pulp/paper and petrochemical sectors
Argentina 3.25% CAGR Lithium processing growth
Rest of South America USD 630 Million (2025) Water treatment expansion


Brazil anchors the South American Chlor-Alkali Market through its integrated pulp and paper industry, which consumes significant volumes of chlorine-based bleaching agents and caustic soda for kraft pulping. Unipar Carbocloro operates the region's largest chlor-alkali complex in Santo André, supplying both merchant and captive downstream channels. Argentina's emerging lithium extraction sector in the Lithium Triangle is generating incremental caustic soda demand for brine purification processes.

Middle East & Africa

Country Key Metric Key Driver
Saudi Arabia 35% of regional share Petrochemical downstream integration
UAE USD 480 Million (2025) Water desalination and treatment
South Africa 3.30% CAGR Mining and mineral processing
Egypt 18% of regional share Fertilizer and textile industries
Rest of MEA 3.45% CAGR Infrastructure development


Middle Eastern chlor-alkali producers enjoy structural cost advantages from subsidized natural gas at below USD 2/MMBtu, enabling electricity generation costs roughly 60% below European equivalents [19]. Saudi Arabia's SABIC and its affiliates operate world-scale chlor-alkali units integrated with downstream ethylene dichloride and PVC capacity. In Africa, the Chlor-Alkali Market remains largely import-dependent, though South Africa's Sasol and NCP Chlorchem provide domestic supply for mining, water treatment, and mineral beneficiation applications.

Chlor Alkali Market By Region, 2025-2035

Competitive Benchmarking

The Chlor-Alkali Market exhibits medium concentration, with the top five producers accounting for an estimated 30–38% of global capacity. The Herfindahl-Hirschman Index sits in the 600–900 range, indicating a moderately fragmented structure where regional leaders coexist with global integrated players. Scale advantages in energy procurement and downstream integration create meaningful barriers to entry, though greenfield plants in low-cost energy regions continue to reshape competitive dynamics.

Company Est. Revenue Share Range Key Offerings Strategic Positioning
Olin Corporation ~7–10% Chlorine, caustic soda, VCM, EDC Integrated vinyls leader, US Gulf Coast scale
Westlake Chemical Corporation ~5–8% Chlor-alkali, PVC, chlorinated solvents Vertically integrated resin producer
Dow Inc. ~5–7% Caustic soda, chlorine, ethylene oxide Diversified chemical major with a global footprint
Formosa Plastics Corporation ~4–7% PVC, caustic soda, chlorine Asia-Pacific integrated polymer leader
Tosoh Corporation ~3–5% Specialty caustic, chlorine derivatives High-purity chemical focus, Japan
INEOS Group ~3–5% Chlor-alkali, PVC, hydrogen European scale operator, energy transition
Tata Chemicals Limited ~2–4% Soda ash, caustic soda Indian market leader, diversified chemicals
Hanwha Solutions Corporation ~2–4% Caustic soda, chlorine, PVC South Korean vertically integrated producer
Covestro AG ~2–3% Chlorine for MDI/TDI isocyanates Captive chlorine consumer, specialty materials
Shin-Etsu Chemical Co., Ltd. ~2–3% PVC, chlorine, specialty silicones Global PVC leader, Japan-headquartered


Recent News & Developments

Olin Corporation and Huntsman Corporation- (June 16, 2026)--Announced a transformative merger of equals, creating a highly integrated North American chemicals leader with combined upstream and downstream production capabilities.

Olin Corporation and Braskem- (November 11, 2025)--Formed a strategic partnership aimed at driving value growth, combining upstream chlor-alkali asset portfolios with global downstream vinyls networks.

Vynova- (July 8, 2025)--Announced its strategic intention to cease manufacturing operations at its production site in Beek, the Netherlands, to streamline its European asset footprint.


Chlor Alkali Market Report Scope

Parameter Details
Market Scope Global Chlor-Alkali Market covering production, consumption, and trade flows
Study Period 2021–2035
CAGR 3.40% (2026–2035)
Market Size (2025) USD 78,500 Million
Market Size (2035) USD 109,650 Million
Fastest Growing Segment Caustic Soda (by product); Asia-Pacific (by region)
Companies Profiled 10 (Olin, Westlake, Dow, Formosa Plastics, Tosoh, INEOS, Tata Chemicals, Hanwha Solutions, Covestro, Shin-Etsu Chemical)
Valuation Currency USD Million


FAQs

What is the typical payback period for a membrane cell retrofit in an existing chlor-alkali plant?
Most operators recover membrane cell conversion costs within 4–6 years through energy savings of 30–35% versus diaphragm cells [2]. The payback shortens significantly in high-electricity-price regions like Europe.
How does the chlorine-caustic soda co-production balance affect procurement strategy?
Demand imbalances between chlorine and caustic soda create cyclical pricing swings that buyers can hedge through long-term contracts or dual-sourcing strategies [4]. Integrated producers manage this internally through downstream flexibility.
What quality certifications should buyers require from chlor-alkali suppliers?
Buyers should verify ISO 9001, Responsible Care certification, and product-specific standards like SEMI C8 for semiconductor-grade caustic [25]. Supply chain audits covering mercury-free production are increasingly mandatory.
How does the Chlor-Alkali Market respond to sudden natural gas price spikes?
Gas price volatility passes through electricity costs, raising production expenses by 15–25% in gas-dependent regions [14]. Producers with renewable PPAs or nuclear baseload access maintain stable margins during price shocks.
What role does the Chlor-Alkali Market play in hydrogen economy development?
Chlor-alkali electrolysis generates roughly 1 million tons of by-product hydrogen annually worldwide, increasingly captured for industrial use or fuel cell applications [3]. This positions existing plants as distributed hydrogen supply nodes.
Are there viable chlorine-free alternatives threatening the Chlor-Alkali Market demand?
UV and ozone disinfection serve niche applications but cannot match chlorine's residual protection in distribution networks [17]. Chlorine-based treatment retains over 85% of the global municipal water market.
What minimum plant scale is economically viable for new Chlor-Alkali Market entrants?
Industry consensus places the minimum efficient scale at 150,000–200,000 tons/year of combined caustic-chlorine capacity [4]. Below that threshold, fixed energy and maintenance costs erode operating margins.    
Author
Author
Author Profile
Chitranshi Jaiswal LinkedIn
Team Lead - Research
Chitranshi is a Team Leader in the Chemicals & Materials (CnM) and Energy & Power (EnP) domains, with 6+ years of experience in market research. She leads and mentors teams to deliver cross-domain projects that equip clients with actionable insights and growth strategies. She is skilled in market estimation, forecasting, competitive benchmarking, and both primary & secondary research, enabling her to turn complex data into decision-ready insights. An engineer and MBA professional, she combines technical expertise with strategic acumen to solve dynamic market challenges. Chitranshi has successfully managed projects that support market entry, investment planning, and competitive positioning, while building strong client relationships. Certified in Advanced Excel & Power BI she leverages data-driven approaches to ensure accuracy, clarity, and impactful outcomes.

Research Approach


Secondary Research

The secondary research process involved comprehensive analysis of regulatory chemical databases, peer-reviewed industrial journals, chemical engineering publications, and authoritative chemical industry organizations. Key sources included the US Environmental Protection Agency (EPA), European Chemicals Agency (ECHA), International Council of Chemical Associations (ICCA), American Chemistry Council (ACC), European Chemical Industry Council (Cefic), Chlorine Institute (US), Euro Chlor (European Association of Chlor-Alkali Manufacturers), US Geological Survey (USGS), National Institute of Standards and Technology (NIST), International Energy Agency (IEA), World Chlorine Council, China Chlor-Alkali Industry Association (CCIA), Japan Chemical Industry Association (JCIA), Indian Chemical Council (ICC), OECD Chemical Safety and Biosafety Programme, UN Environment Programme (UNEP) Chemicals and Health Branch, and national chemical industry statistics from key markets. These sources were used to collect production capacity data, regulatory compliance information, environmental safety studies, trade flow analysis, and market landscape assessment for chlorine, caustic soda, and chlor-alkali manufacturing technologies including membrane cell, diaphragm cell, and mercury cell processes.


Primary Research

Qualitative and quantitative insights were obtained by interviewing supply-side and demand-side stakeholders during the primary research process. CEOs, VPs of Operations, plant managers, and regulatory compliance leaders from chlor-alkali manufacturers, chemical producers, and technology providers comprised supply-side sources. Procurement directors from vinyl/PVC manufacturers, alumina refineries, pulp and paper mills, water treatment facilities, textile processors, and soap and detergent manufacturers comprised demand-side sources. Market segmentation was validated, capacity expansion timelines were confirmed, and insights regarding technology adoption patterns, energy consumption trends, environmental compliance costs, and regional trade dynamics were obtained through primary research.

Primary Respondent Breakdown:

By Designation: C-level Primaries (32%), Director Level (31%), Others (37%)

By Region: North America (32%), Europe (30%), Asia-Pacific (30%), Rest of World (8%)


Market Size Estimation

Global market valuation was derived through production capacity mapping and consumption volume analysis. The methodology included:

Identification of over 50 significant chlor-alkali manufacturers in North America, Europe, Asia-Pacific, and Latin America

Product mapping across chlorine (water treatment, paper & pulp, inorganics, intermediates, organics, vinyl) and caustic soda (textile, alumina, soap & detergents, organics, inorganics, pulp & paper, water treatment) applications

Analysis of reported and modeled annual revenues specific to chlor-alkali product portfolios

Coverage of manufacturers representing 75-80% of global production capacity in 2024

Extrapolation using bottom-up (production volume × ASP by region) and top-down (manufacturer revenue validation) approaches to derive segment-specific valuations

Download Free Sample

Kindly complete the form below to receive a free sample of this Report

Download PDF ×

We do not share your information with anyone. However, we may send you emails based on your report interest from time to time. You may contact us at any time to opt-out.

















