Drug Screening Market (2026 - 2035)

Drug Screening Market Research Report: Size, Share, Trend Analysis By Types (Urine Testing, Saliva Testing, Blood Testing, Hair Testing), By Technology (Immunoassay, Chromatography, Mass Spectrometry, PCR Testing), By End Use (Workplace, Drug Rehabilitation Centers, Hospitals and Clinics, Law Enforcement), By Panel Size (Single Panel, Multi-Panel, Expanded Panel) and By Regional (North America, Europe, South America, Asia Pacific, Middle East and Africa) - Growth Outlook & Industry Forecast 2025 To 2035

Forecast Period
2026-2035
CAGR
15.3%
2025 Market Size
USD 8.07 Billion
2035 Market Size
USD 33.49 Billion
Healthcare ● Updated August 24, 2026 Report ID: MRFR/HC/19136-HCR | Pages: 128 | Author: Vikita Thakur, Rahul Gotadki

Drug Screening Market Summary

The Drug Screening Market closed 2025 at USD 8.07 billion and is projected to grow to USD 33.49 billion by 2035, expanding at a compound annual growth rate (CAGR) of 15.3% between 2026 and 2035. Market value is expected to reach USD 9.30 billion in 2026 as the first year of the forecast period. This growth is being driven primarily by new U.S. testing regulations and rising synthetic opioid mortality, alongside a broader technology shift toward laboratory-grade detection platforms capable of identifying newer, more dangerous drug analogues.

The U.S. Department of Transportation's final rule authorizing oral fluid collection for federally regulated testing opened a second specimen collection channel for roughly 8 million safety-sensitive workers, expanding testing options across federally regulated industries. At the same time, sustained synthetic opioid mortality has pushed treatment programs and correctional systems to test more frequently and across wider analyte panels. As a result, demand in the Drug Screening Market is no longer driven by compliance requirements alone, but increasingly by institutional liability exposure.

Laboratories are also retiring single-analyte immunoassay workflows in favor of consolidated LC-MS/MS platforms and connected point-of-collection readers. Legacy cup-and-dipstick formats still move significant volume, but they cannot detect nitazenes, xylazine, or newer fentanyl analogues without confirmatory chemistry. Capital is following this need: instrument vendors serving the Drug Screening Market have concentrated research and development on assay menu breadth rather than throughput, with several launching expanded panels covering more than 20 additional compounds since 2023.

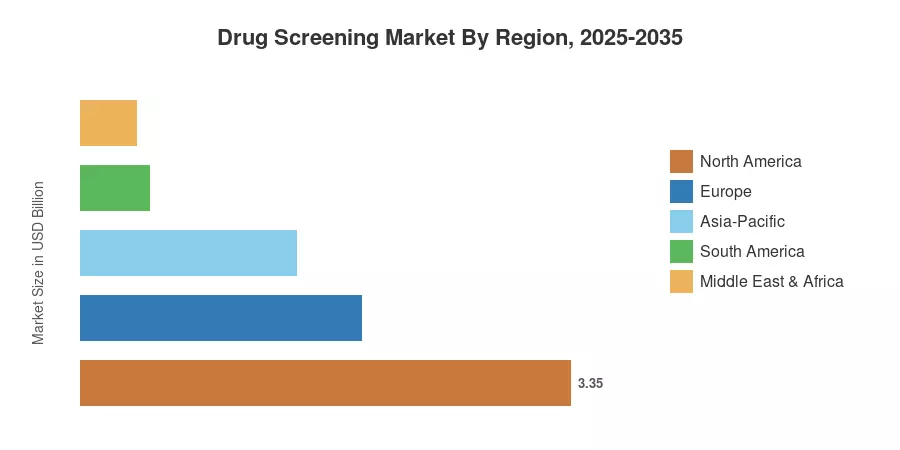
By region, North America holds the largest share of the Drug Screening Market, at 41.5% of global revenue, supported by federally mandated testing programs and a mature laboratory network. Asia-Pacific is the fastest-growing region, with a projected CAGR of 18.4%, as India, China, and ASEAN economies formalize occupational testing rules. Europe holds the second-largest position by revenue, where roadside enforcement statutes and European Workplace Drug Testing Society harmonization sustain steady equipment replacement cycles. Over the next decade, vendors that pair defensible chemistry with software capabilities, rather than competing on device price alone, are expected to be best positioned for growth.


Key Report Takeaways

• By Technology

  • Immunoassay retains 47.3% of global revenue in 2025, still the default first-line screen across the Drug Screening Market
  • Chromatography–mass spectrometry is scaling at a 17.9% CAGR as confirmation volumes rise
  • Breath analysers generate roughly USD 1.00 billion, concentrated in roadside and pre-shift use

• By Sector

  • Workplace testing settings account for 41.8% of demand within the Drug Screening Market
  • Criminal justice applications contribute close to USD 1.81 billion in 2025
  • Drug treatment centres expand at a 16.8% CAGR through 2035

• By Region

  • North America commands 41.5% revenue share
  • Asia-Pacific posts the fastest regional CAGR at 18.4%
  • Europe contributes approximately USD 1.92 billion in 2025


Market Size and Forecast (2021–2035)

Figures below blend laboratory throughput data, instrument shipment tracking, regulated-programme testing volumes published by federal agencies, and bottom-up revenue modelling across 12 vendor cohorts. Historical values are reconciled against reported segment revenues from publicly listed diagnostics firms; forecast values apply calibrated adoption curves by specimen type and region.
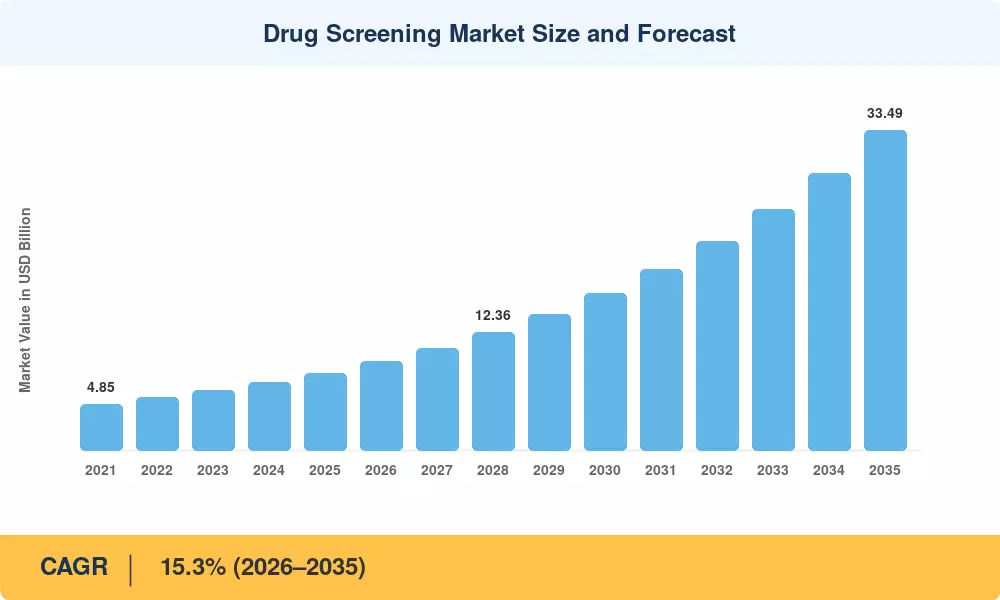
Drug Screening Market Size and Forecast
Our Impact
Enabled $4.3B Revenue Impact for Fortune 500 and Leading Multinationals
Partnering with 2000+ Global Organizations Each Year
30K+ Citations by Top-Tier Firms in the Industry

Driver Impact Analysis

Driver ~% Impact on CAGR Geographic Relevance Impact Timeline
Federal oral fluid authorisation +2.4 North America Short-term (≤2 yr)
Synthetic opioid and stimulant prevalence +3.1 Global Medium-term (2–4 yr)
Employer liability and insurance pressure +2.2 North America, Europe Medium-term (2–4 yr)
Criminal justice diversion programmes +1.8 North America, Europe Long-term (≥4 yr)
Roadside impairment enforcement +1.6 Europe, Asia-Pacific Medium-term (2–4 yr)
Point-of-collection cost decline +2.0 Global Long-term (≥4 yr)
Emerging-market regulatory formalisation +1.4 Asia-Pacific, MEA Long-term (≥4 yr)


Specimen Diversification Under Federal Rulemaking

In 2023, regulators revised the game's rules. Employers now have an observed-collection alternative that significantly lowers the danger of adulteration, according to the Department of Transportation's final rule allowing oral fluid collection under 49 CFR Part 40 [1]. The pipeline is real: workplace drug screening programs covering safety-sensitive transport roles represent an addressable base of approximately 8 million tested individuals annually in the United States alone [2]. However, adoption has been slower than vendors had anticipated because two certified laboratories must be available for each specimen type.


Synthetic Opioid Prevalence and Panel Economics

Overdose surveillance changed procurement behaviour faster than any statute. With synthetic opioids implicated in the majority of U.S. overdose deaths recorded during the mid-2020s, treatment providers moved from five-analyte panels to configurations exceeding 20 compounds [3]. Each added analyte carries incremental reagent and validation cost, lifting average revenue per test by an estimated 18–24% across treatment settings — a structural, not cyclical, shift.

Employer Liability and Insurance Underwriting

Insurers now price substance-related incident exposure explicitly. Fleet and industrial underwriters in North America apply premium differentials of 5–12% for operators without documented testing programmes [6], which converts screening from a discretionary HR expense into a balance-sheet item. That reframing explains why testing volumes held up even during 2024 hiring slowdowns.

Enforcement Modernisation Outside the United States

European roadside programmes have scaled steadily since member states aligned on evidential oral fluid protocols, and several national police services now run six-figure annual device volumes [10]. Asia-Pacific regulators are following a similar sequence — statute first, accreditation infrastructure second — which is why the region's instrument spend is currently outpacing its consumable spend.


Restraints Impact Analysis

Restraint weightings reflect modelled drag on the growth trajectory of the Drug Screening Market and should be read as directional, not additive to the headline CAGR.

Restraint ~% Impact on CAGR Geographic Relevance Impact Timeline
Cannabis legalisation narrowing test scope −1.9 North America, Europe Medium-term (2–4 yr)
Privacy regulation and litigation exposure −1.3 Europe Medium-term (2–4 yr)
Novel psychoactive substances outpacing assays −1.1 Global Short-term (≤2 yr)
Reimbursement scrutiny in pain management −1.5 North America Short-term (≤2 yr)
Toxicologist and certified collector shortages −0.9 Global Long-term (≥4 yr)


Cannabis Policy Fragmentation

Employers have retreated from pre-employment cannabis testing in jurisdictions where recreational use is lawful, and several states now restrict adverse action based solely on metabolite detection [9]. Because tetrahydrocannabinol metabolites historically represented a large share of non-negative results, that retreat removes volume from the base. Vendors are offsetting the loss by repositioning cannabis assays toward post-incident and safety-sensitive-only protocols rather than universal screening.

Reimbursement Pressure in Clinical Toxicology

Payers tightened definitive testing coverage after audits identified reflex-to-confirmation ordering patterns that lacked documented medical necessity [13]. Reimbursement per definitive test has compressed materially in U.S. pain management settings, squeezing independent laboratories with narrow menus. Consolidation follows: smaller laboratories either specialise or sell.

Chemistry Lag Against Emerging Compounds

While clandestine chemists iterate in weeks, assay development cycles take 12–24 months from compound identification to verified commercial availability [4]. This gap pushes volume into more costly confirmatory chemistry and slows the point-of-care replacement story by creating false-negative risk and undermining consumer confidence in screen-only processes.


Drug Screening Market Opportunities

Oral Fluid Conversion in Regulated Programmes

Certification bottlenecks will clear, and when they do, the conversion opportunity is large. Observed collection eliminates the collection-site infrastructure that urine testing demands, cutting per-event logistics cost by an estimated 20–30% for distributed workforces [1]. Vendors holding both collection devices and laboratory capacity capture the full margin stack.

Expanded Panels for Emerging Synthetic Compounds

Fentanyl analogues, nitazenes and xylazine now appear routinely in forensic casework, yet few commercial screens cover them natively [3]. First-movers with validated immunoassay reagents for these classes can command premium pricing before menu parity arrives.

Emerging-Market Infrastructure Build-Out

India's transport and mining sectors, ASEAN manufacturing hubs and Gulf occupational health authorities are all writing testing requirements into licensing frameworks [14][16]. These markets lack accredited laboratory density, which favours ruggedised point-of-collection platforms and franchised collection networks over centralised laboratory models.

Data Monetisation and Analytics-as-a-Service

Aggregated, de-identified positivity data has commercial value to insurers, occupational health providers and public health agencies. Recurring analytics subscriptions carry gross margins well above consumables and lock in the customer relationship far more effectively than reagent contracts.

Home Collection and Telehealth-Supervised Testing

Remote collection kits with video-supervised chain of custody have moved from novelty to accepted practice in several treatment and family-court contexts [17]. The addressable base is smaller than workplace testing, but the gross margin profile is stronger, and distribution runs through pharmacy and e-commerce channels rather than laboratory sales forces.


Drug Screening Market Future Outlook

Algorithmic Result Interpretation

Machine-assisted review of mass spectrometry chromatograms is moving from pilot to production in high-volume laboratories, cutting technologist review time per definitive result by 30–40% [18]. Labour scarcity makes this economically compelling regardless of testing volume growth, and vendors that embed interpretation software will defend margin as reagent pricing commoditises.

Consumable Attach Rates as the Real Business Model

Sales of instruments are becoming less about profit and more about acquiring new customers. A significant percentage of new installations now use placement-based models, in which analyzers are provided at nominal cost in exchange for multi-year reagent commitments, giving players with extensive validated menus a competitive edge [11].


Mass Spectrometry Moving Downmarket

Benchtop LC-MS/MS system prices have fallen materially over the past decade while ease of use has improved, bringing confirmatory capability within reach of mid-sized regional laboratories [19]. Decentralisation of confirmation will erode the volume advantage that national reference laboratories have historically enjoyed.

Integration With Public Health Surveillance

Data from toxicology is increasingly useful in epidemiology. Wastewater analysis is also employed in conjunction with individual testing to map community-level prevalence, and agencies monitoring emerging substance trends are increasingly sourcing signals from clinical and forensic laboratory networks [20]. Formalizing these data links will open up revenue sources for commercial laboratories that are independent of test volume.


Drug Screening Market Segmentation

Segment structure in the Drug Screening Market follows the Mordor-aligned taxonomy of product and service, sample type, technology, testing setting, and end user.

By Product & Service

Segment Metric (2025) Primary Demand Driver
Consumables 54.2% share Recurring assay and collection kit demand
Instruments USD 2.31 Billion Analyser refresh and decentralisation
Services 16.4% CAGR Outsourced programme administration


Consumables carry the revenue because every test consumes reagent, collection media and calibration material. Instruments matter strategically rather than financially — each placement locks in years of downstream consumption, which is why aggressive placement pricing persists despite thin hardware margins.

By Sample Type

Segment Metric (2025) Primary Demand Driver
Urine 62.4% share Established regulatory acceptance
Oral Fluid 19.7% CAGR Observed collection and recent-use detection
Hair USD 0.79 Billion Long detection window for pattern analysis
Breath 7.2% share Roadside and pre-shift alcohol screening
Blood USD 0.29 Billion Evidential and clinical toxicology
Other Sample Types 14.1% CAGR Sweat patch and wastewater applications


Urine remains dominant because the legal precedent supporting it is unmatched, and urine drug test panels are the format most collection sites, laboratories, and arbitrators already understand. Oral fluid is the growth story within the Drug Screening Market, but its expansion is gated by laboratory certification rather than by buyer appetite.

By Technology

Segment Metric (2025) Primary Demand Driver
Immunoassay 47.3% share Low cost per first-line screen
Chromatography–Mass Spectrometry 17.9% CAGR Confirmation and expanded analyte coverage
Breath Analysers USD 1.00 Billion Enforcement and pre-shift fitness checks
Other Technologies 7.2% share Spectroscopy and biosensor platforms


Immunoassay retains the largest 47.3% share driven by a low cost per first-line screen, while Chromatography–Mass Spectrometry surges at a 17.9% CAGR for confirmation and expanded analyte coverage. Meanwhile, Breath Analysers command USD 1.00 billion for enforcement and pre-shift fitness checks, and Other Technologies hold a 7.2% share anchored by spectroscopy and biosensor platforms—collectively balancing high-volume preliminary screening with high-precision analytical confirmation.

By Testing Setting

Segment Metric (2025) Primary Demand Driver
Workplace 41.8% share Safety-sensitive role compliance
Criminal Justice USD 1.81 Billion Probation and diversion monitoring
Drug Treatment Centres 16.8% CAGR Recovery programme adherence
Pain Management 9.7% share Medication adherence verification
Schools & Colleges USD 0.51 Billion Athletic and disciplinary programmes
Individuals / Home 18.9% CAGR Direct-to-consumer collection kits


Workplace retains the largest 41.8% share for safety-sensitive compliance, while Criminal Justice commands USD 1.81 Billion for probation monitoring. Drug Treatment Centres surge at a 16.8% CAGR for recovery adherence, alongside Pain Management at a 9.7% share for medication verification. Meanwhile, Schools & Colleges account for USD 0.51 billion for disciplinary programmes, and Individuals / Home expand at an 18.9% CAGR via direct-to-consumer kits—shifting revenue toward decentralized channels and growing total spend.

By End User

Segment Metric (2025) Primary Demand Driver
Drug Testing Laboratories 45.6% share Confirmation volume concentration
Hospitals USD 1.53 Billion Emergency toxicology and clinical care
Workplaces & Employers 16.1% CAGR In-house rapid screening adoption
Criminal Justice Agencies 12.4% share On-site supervision testing
Home / Individual Users USD 0.56 Billion Privacy-driven self-testing


Laboratories retain the largest end-user share because confirmatory chemistry cannot be decentralised without accreditation. Employers are the fastest-moving cohort, adopting instrumented on-site readers to compress the time between collection and actionable result — a shift that grows total spend even as it moves revenue between channels.


Regional Market Share Analysis

Region Metric (2025) Primary Investment Themes
North America 41.5% share Oral fluid conversion, expanded opioid panels
Europe USD 1.92 Billion Roadside enforcement, cross-border accreditation
Asia-Pacific 18.4% CAGR Occupational mandates, laboratory build-out
South America 5.8% share Transport safety, mining sector compliance
Middle East & Africa USD 0.38 Billion Visa and occupational health screening
Total USD 8.07 Billion

Regional performance in the Drug Screening Market reflects regulatory maturity more than economic size. Mandate density, not GDP, determines testing volume.


North America

Country Metric Key Driver
US 86.4% of region Federally mandated safety-sensitive testing [1]
Canada USD 0.31 Billion Provincial safety-sensitive workplace policy [7]
Mexico 15.9% CAGR Manufacturing and cross-border transport growth


Regulatory density gives North America its lead in the Drug Screening Market. The Federal Motor Carrier Safety Administration's reduction of the random testing rate for commercial drivers to 25% for 2025 trimmed unit volume, yet revenue held because expanded panels and confirmation testing lifted average selling price [2]. Canada's picture is shaped by arbitration precedent rather than statute, which keeps testing concentrated in resource extraction and rail.

Europe

Country Metric Key Driver
Germany 21.8% of region Occupational health integration [10]
UK 18.4% of region Transport and construction safety programmes
France 13.2% of the region Roadside enforcement expansion
Italy 9.6% of the region Licensing-linked medical examinations
Spain 8.1% of the region Road safety enforcement volumes
Nordic Countries 7.4% of the region Treatment monitoring programmes
Russia 6.9% of region State occupational screening requirements
Rest of Europe 14.6% of region Accreditation harmonisation


Harmonisation is Europe's defining dynamic. European Workplace Drug Testing Society guidelines have given multinational employers a single defensible protocol across borders, reducing the compliance friction that previously suppressed programme rollout [12]. Data protection remains the counterweight — works councils in Germany and the Netherlands routinely constrain testing scope, so growth arrives through enforcement channels faster than through employment.

Asia-Pacific

Country Metric Key Driver
China 29.7% of region Public security and transport screening
India 21.3% CAGR Mining, logistics, and IT sector policies [14]
Japan 15.8% of region Corporate health management frameworks
South Korea 11.2% of region Judicial and treatment testing expansion
ASEAN USD 0.34 Billion Manufacturing workforce compliance
Rest of Asia-Pacific 12.4% of region Regulatory formalisation


Asia-Pacific is where the Drug Screening Market is being built rather than replaced. India's regulatory momentum is the standout — sector-specific requirements in mining and commercial transport are creating demand faster than accredited laboratory capacity can absorb it, which pushes buyers toward validated rapid formats with send-out confirmation [14]. Japan follows a different logic entirely, with corporate wellness programmes rather than enforcement driving uptake.

South America

Country Metric Key Driver
Brazil 58.3% of region Mandatory commercial driver testing [15]
Argentina 17.6% of region Transport and industrial safety rules
Rest of South America 24.1% of region Mining sector compliance programmes


Brazil's commercial driver testing requirement remains the region's anchor, generating predictable, high-volume hair and urine testing tied to licence renewal cycles [15]. Mining operations across the Andean corridor apply group-wide standards imported from parent-company jurisdictions, which lifts specification quality above what local statute requires.

Middle East & Africa

Country Metric Key Driver
Saudi Arabia 31.4% of region Vision 2030 occupational health programmes [16]
UAE 26.8% of the region Visa and residency medical screening
South Africa 18.2% of the region Mining and industrial safety compliance
Egypt 11.7% of the region Public sector employment screening
Rest of MEA 11.9% of region Emerging regulatory frameworks


Gulf demand originates from immigration and licensing systems rather than employer policy, producing steady baseline volumes with limited price sensitivity [16]. South Africa's mining houses run some of the most rigorous programmes globally, and their procurement standards increasingly set the benchmark for the wider continent.


Drug Screening Market By Region, 2025-2035

Competitive Benchmarking

Concentration sits in the medium band. The estimated Herfindahl-Hirschman Index falls between 700 and 900, with the top five suppliers holding roughly 36–44% of global revenue. Below that tier, the field fragments sharply into regional laboratory networks, specialist hair-testing providers, and rapid-device manufacturers competing largely on price and regulatory clearance breadth.

Company Est. Revenue Share Range Key Offerings for Drug Screening Market Strategic Positioning
Abbott Laboratories ~9–12% Oral fluid readers, rapid devices, laboratory assays Broadest point-of-collection portfolio
Quest Diagnostics ~8–11% Regulated programme testing, workforce analytics Scale leader in employer testing
Labcorp ~6–9% Laboratory testing, occupational health services Integrated clinical and occupational reach
Thermo Fisher Scientific ~5–8% Immunoassay reagents, LC-MS/MS systems Menu breadth across screen and confirm
Siemens Healthineers ~4–6% Clinical chemistry analysers, drugs-of-abuse assays Hospital toxicology channel strength
Drägerwerk AG ~3–5% Roadside and workplace mobile testing systems Enforcement-focused specialist
Shimadzu Corporation ~2–4% Chromatography and mass spectrometry platforms Strong Asia-Pacific instrument base
Agilent Technologies ~2–4% LC-MS/MS and GC-MS forensic solutions High-end confirmatory chemistry
OraSure Technologies ~2–4% Oral fluid collection devices Pure-play oral fluid collection leader
Psychemedics Corporation ~1–3% Hair testing services Long-window detection specialist
Randox Laboratories ~1–3% Multiplex biochip arrays, toxicology panels Broad-analyte array differentiation
Bio-Rad Laboratories ~1–3% Quality controls and calibrators Accreditation-critical supporting position


Recent News & Developments

  • U.S. Department of Transportation (May 2023): Published the final rule authorising oral fluid specimen collection under federal testing procedures, creating a second regulated specimen pathway for safety-sensitive employers [1]


  • OraSure Technologies (2024): Advanced commercialisation of its next-generation oral fluid collection device targeting laboratory-based regulated testing [11]
  • Drägerwerk (2025): Extended European police service contracts for mobile drug testing systems across multiple national jurisdictions [10]
  • Labcorp (2025): Broadened certified oral fluid testing capacity across its occupational testing network to meet federal programme requirements [17]


Drug Screening Market Report Scope

Parameter Detail
Market Scope Global Drug Screening Market across product & service, sample type, technology, testing setting, end user and geography
Study Period 2021–2035 (Historical 2021–2024; Base Year 2025; Forecast 2026–2035)
CAGR 15.3% (2026–2035)
Market Size Checkpoints USD 8.07 Billion (2025); USD 9.30 Billion (2026); USD 33.49 Billion (2035)
Fastest Growing Segments Oral Fluid (sample type); Chromatography–Mass Spectrometry (technology); Individuals/Home (testing setting)
Companies Profiled 12 major suppliers spanning laboratory services, instruments, reagents, and collection devices
Valuation Currency USD, revenue basis at manufacturer and service-provider level

FAQs

How should procurement teams weigh in-house instruments against send-out laboratory contracts in the Drug Screening Market?
Instrument ownership generally pays off above roughly 40,000 tests annually. Below that threshold, laboratory contracts win on total cost. Include calibration, proficiency testing, and staff certification in the comparison, not just reagent price. [Ref 18]
What accreditation should buyers require from a confirmation laboratory?
Require SAMHSA certification for U.S. federal programmes and ISO/IEC 17025 scope covering the specific analytes being tested. European buyers should add European Workplace Drug Testing Society conformance. [Ref 12]
How does cannabis policy fragmentation complicate programme design in the Drug Screening Market?
Legal status varies by jurisdiction while impairment thresholds remain scientifically contested. Most employers now restrict cannabis testing to safety-sensitive roles and post-incident scenarios. Legal review before any policy change is essential. [Ref 9]
Which compounds do standard five-analyte immunoassay configurations typically miss?
Fentanyl analogues, nitazenes, xylazine, and most synthetic cannabinoids fall outside legacy configurations. Expanded reagent menus or mass spectrometry confirmation are required to detect them reliably. [Ref 3]
What integration challenges arise connecting collection devices to laboratory information systems in the Drug Screening Market?
Chain-of-custody metadata rarely maps cleanly onto HL7 or ASTM message structures, forcing custom middleware. Budget six to nine months for validation and audit-trail sign-off before go-live. [Ref 17]
How does hair testing compare with oral fluid on detection window and defensibility?
Hair reveals roughly 90 days of use history but misses very recent consumption; oral fluid captures the prior 24 to 48 hours. Pattern detection favours hair; post-incident investigation favours oral fluid. [Ref 11]
What should investors monitor in point-of-collection device economics?
Margin depends on consumable attach rates rather than hardware sales, so installed-base expansion matters more than unit pricing. Watch reagent exclusivity terms and the breadth of regulatory clearances. [Ref 5]    
Author
Author
Author Profile
Vikita Thakur LinkedIn
Senior Research Analyst
She holds an experience of about 5+ years in market research and business consulting projects for sectors such as life sciences, medical devices, and healthcare IT. She possesses a robust background in data analysis, market estimation, competitive intelligence, pipeline analysis market trend identification, and consumer behavior insights. Her expertise lies in technical Sales support, client interaction and project management, designing and implementing market research studies, conducting competitive analysis, and synthesizing complex data into actionable recommendations that drive business growth.
Co-Author
Co-Author Profile
Rahul Gotadki LinkedIn
Research Manager
He holds an experience of about 9+ years in Market Research and Business Consulting, working under the spectrum of Life Sciences and Healthcare domains. Rahul conceptualizes and implements a scalable business strategy and provides strategic leadership to the clients. His expertise lies in market estimation, competitive intelligence, pipeline analysis, customer assessment, etc.
Share::
Request Free Sample

Research Approach


Secondary Research

The secondary research process involved comprehensive analysis of regulatory databases, peer-reviewed medical journals, clinical publications, and authoritative health organizations. Key sources included the US Food & Drug Administration (FDA), Drug Enforcement Administration (DEA), Substance Abuse and Mental Health Services Administration (SAMHSA), Centers for Disease Control and Prevention (CDC), National Institute on Drug Abuse (NIDA), European Monitoring Centre for Drugs and Drug Addiction (EMCDDA), European Medicines Agency (EMA), National Institute of Standards and Technology (NIST), Clinical Laboratory Improvement Amendments (CLIA), College of American Pathologists (CAP), Occupational Safety and Health Administration (OSHA), Department of Transportation (DOT), World Health Organization (WHO), United Nations Office on Drugs and Crime (UNODC), National Institute of Health (NIH/NCBI PubMed), Laboratory Corporation of America Holdings (LabCorp) databases, Quest Diagnostics Health Trends, National Survey on Drug Use and Health (NSDUH), World Drug Report, and national health ministry reports from key markets. These sources were used to collect testing volume statistics, regulatory approval data for diagnostic devices, clinical validation studies, substance abuse prevalence trends, workplace testing compliance data, and competitive landscape analysis for immunoassay analyzers, chromatography systems, mass spectrometry devices, PCR testing platforms, and point-of-care testing devices.


Primary Research

In order to gather both qualitative and quantitative insights, supply-side and demand-side stakeholders were interviewed during the primary research process. CEOs, VPs of Product Development, heads of regulatory affairs, R&D directors, and commercial directors from testing device OEMs, clinical laboratory service providers, and in-vitro diagnostic manufacturers were examples of supply-side sources. Medical laboratory directors, toxicologists, occupational health doctors, addiction medicine specialists, HR compliance officers, law enforcement forensic toxicologists, procurement leads from hospital laboratories, administrators of workplace testing programs, and clinical research organizations were among the demand-side sources. Primary research obtained information on clinical adoption patterns, regulatory compliance costs, pricing strategies for testing panels, and reimbursement dynamics for laboratory-developed tests versus FDA-cleared devices. It also validated market segmentation across testing types and technologies and confirmed product pipeline timelines for next-generation testing platforms.

Primary Respondent Breakdown:

By Designation: C-level Primaries (32%), Director Level (30%), Others (38%)

By Region: North America (38%), Europe (25%), Asia-Pacific (28%), Rest of World (9%)


Market Size Estimation

Global market valuation was derived through revenue mapping and testing volume analysis. The methodology included:

Identification of 50+ key manufacturers and service providers across North America, Europe, Asia-Pacific, Latin America, and Middle East & Africa

Product mapping across urine testing, saliva testing, blood testing, and hair testing sample types

Technology mapping across immunoassay (enzyme immunoassay, chemiluminescence immunoassay), chromatography (HPLC, GC), mass spectrometry (LC-MS/MS, GC-MS), and molecular testing (PCR, nucleic acid testing) platforms

Analysis of reported and modeled annual revenues specific to drug screening portfolios and toxicology testing services

Coverage of manufacturers and laboratories representing 75-80% of global market share in 2024

Extrapolation using bottom-up (testing volume × ASP by country/region across workplace, criminal justice, clinical, and rehabilitation settings) and top-down (manufacturer revenue validation and service provider revenue analysis) approaches to derive segment-specific valuations by test type, technology, end-user, and panel configuration

Share::
Request Free Sample
Download Free Sample

Kindly complete the form below to receive a free sample of this Report

* Please use a valid business email

Share::
Request Free Sample
Download PDF ×

We do not share your information with anyone. However, we may send you emails based on your report interest from time to time. You may contact us at any time to opt-out.
















