Drug Screening Market (2026 - 2035)

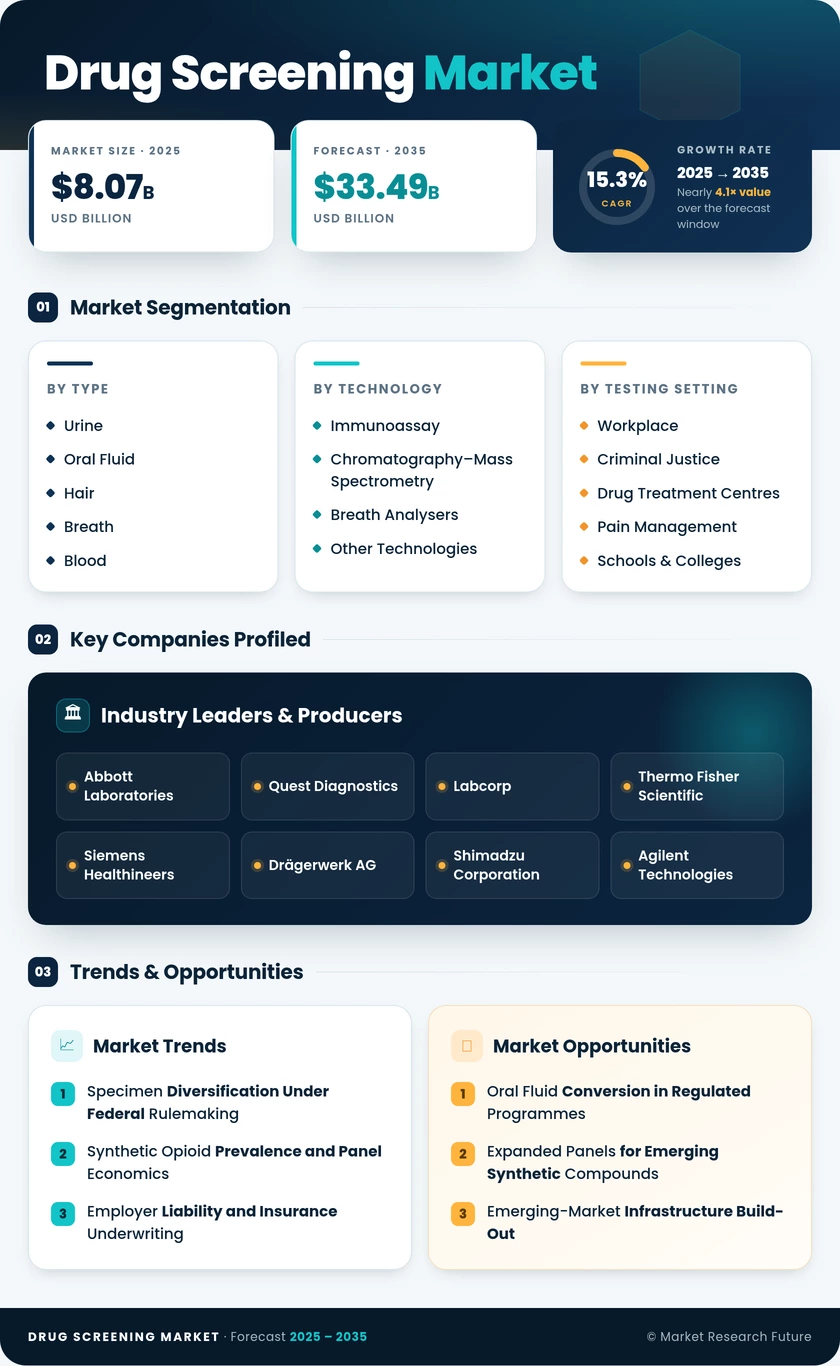
Drug Screening Market Research Report: Size, Share, Trend Analysis By Types (Urine Testing, Saliva Testing, Blood Testing, Hair Testing), By Technology (Immunoassay, Chromatography, Mass Spectrometry, PCR Testing), By End Use (Workplace, Drug Rehabilitation Centers, Hospitals and Clinics, Law Enforcement), By Panel Size (Single Panel, Multi-Panel, Expanded Panel) and By Regional (North America, Europe, South America, Asia Pacific, Middle East and Africa) - Growth Outlook & Industry Forecast 2025 To 2035

Forecast Period
2026-2035
CAGR
15.3%
2025 Market Size
USD 8.07 Billion
2035 Market Size
USD 33.49 Billion
Healthcare ● Updated August 2026 Report ID: MRFR/HC/19136-HCR | Pages: 128 | Author: Vikita Thakur, Rahul Gotadki
  1. 1 Market Summary |
    1. 1.1 Study Assumptions & Market Definition |
    2. 1.2 Scope of the Study |
    3. 1.3 Research Methodology
  2. 2 Key Report Takeaways |
    1. 2.1 By Technology |
    2. 2.2 By Sector |
    3. 2.3 By Geography
  3. 3 Market Size & Forecast (2021–2035) |
    1. 3.1 Historical Market Size (2021–2025) |
    2. 3.2 Current & Forecast Market Size (2026–2035) |
    3. 3.3 Year-over-Year Growth Analysis
  4. 4 Driver Impact Analysis |
    1. 4.1 Specimen Diversification Under Federal Rulemaking |
    2. 4.2 Synthetic Opioid Prevalence and Panel Economics |
    3. 4.3 Employer Liability and Insurance Underwriting |
    4. 4.4 Enforcement Modernisation Outside the United States
  5. 5 Restraints Impact Analysis |
    1. 5.1 Cannabis Policy Fragmentation |
    2. 5.2 Reimbursement Pressure in Clinical Toxicology |
    3. 5.3 Chemistry Lag Against Emerging Compounds
  6. 6 Opportunities |
    1. 6.1 Oral Fluid Conversion in Regulated Programmes |
    2. 6.2 Expanded Panels for Emerging Synthetic Compounds |
    3. 6.3 Emerging-Market Infrastructure Build-Out |
    4. 6.4 Data Monetisation and Analytics-as-a-Service |
    5. 6.5 Home Collection and Telehealth-Supervised Testing
  7. 7 Regional Market Share & Country-Level Analysis |
    1. 7.1 North America | |
      1. 7.1.1 US | |
      2. 7.1.2 Canada | |
      3. 7.1.3 Mexico |
    2. 7.2 Europe | |
      1. 7.2.1 Germany | |
      2. 7.2.2 UK | |
      3. 7.2.3 France | |
      4. 7.2.4 Italy | |
      5. 7.2.5 Spain | |
      6. 7.2.6 Nordic Countries | |
      7. 7.2.7 Russia | |
      8. 7.2.8 Rest of Europe |
    3. 7.3 Asia-Pacific | |
      1. 7.3.1 China | |
      2. 7.3.2 India | |
      3. 7.3.3 Japan | |
      4. 7.3.4 South Korea | |
      5. 7.3.5 ASEAN | |
      6. 7.3.6 Rest of Asia-Pacific |
    4. 7.4 South America | |
      1. 7.4.1 Brazil | |
      2. 7.4.2 Argentina | |
      3. 7.4.3 Rest of South America |
    5. 7.5 Middle East & Africa | |
      1. 7.5.1 Saudi Arabia | |
      2. 7.5.2 UAE | |
      3. 7.5.3 South Africa | |
      4. 7.5.4 Egypt | |
      5. 7.5.5 Rest of Middle East & Africa
  8. 8 Future Outlook (2026–2035) |
    1. 8.1 Algorithmic Result Interpretation |
    2. 8.2 Consumable Attach Rates as the Business Model |
    3. 8.3 Mass Spectrometry Moving Downmarket |
    4. 8.4 Integration With Public Health Surveillance
  9. 9 Market Segmentation Analysis |
    1. 9.1 By Product & Service | |
      1. 9.1.1 Consumables | |
      2. 9.1.2 Instruments | |
      3. 9.1.3 Services |
    2. 9.2 By Sample Type | |
      1. 9.2.1 Urine | |
      2. 9.2.2 Oral Fluid | |
      3. 9.2.3 Hair | |
      4. 9.2.4 Breath | |
      5. 9.2.5 Blood | |
      6. 9.2.6 Other Sample Types |
    3. 9.3 By Technology | |
      1. 9.3.1 Immunoassay | |
      2. 9.3.2 Chromatography–Mass Spectrometry | |
      3. 9.3.3 Breath Analysers | |
      4. 9.3.4 Other Technologies |
    4. 9.4 By Testing Setting | |
      1. 9.4.1 Workplace | |
      2. 9.4.2 Criminal Justice | |
      3. 9.4.3 Drug Treatment Centres | |
      4. 9.4.4 Pain Management | |
      5. 9.4.5 Schools & Colleges | |
      6. 9.4.6 Individuals / Home |
    5. 9.5 By End User | |
      1. 9.5.1 Drug Testing Laboratories | |
      2. 9.5.2 Hospitals | |
      3. 9.5.3 Workplaces & Employers | |
      4. 9.5.4 Criminal Justice Agencies | |
      5. 9.5.5 Home / Individual Users
  10. 10 Competitive Landscape |
    1. 10.1 Market Concentration Analysis (2026) |
    2. 10.2 Competitive Benchmarking Matrix |
    3. 10.3 Company Profiles
  11. 11 Recent News & Developments
  12. 12 Report Scope & Methodology
  13. 13 Detailed Sources & Citations
  14. 14 Frequently Asked Questions (FAQs)
  15. 15 LIST OF TABLES |
  16. TABLE 1 Global Drug Screening Market Size & Forecast, by Revenue (USD Billion), 2021–2035 |
  17. TABLE 2 Global Drug Screening Market – Year-over-Year Growth Analysis, 2021–2035 |
  18. TABLE 3 Driver Impact Analysis Matrix, 2026–2035 |
  19. TABLE 4 Restraint Impact Analysis Matrix, 2026–2035 |
  20. TABLE 5 Global Market Size, by Region, 2021–2035 (USD Billion) |
  21. TABLE 6 North America Market Size, by Country, 2021–2035 (USD Billion) |
  22. TABLE 7 Europe Market Size, by Country, 2021–2035 (USD Billion) |
  23. TABLE 8 Asia-Pacific Market Size, by Country, 2021–2035 (USD Billion) |
  24. TABLE 9 South America Market Size, by Country, 2021–2035 (USD Billion) |
  25. TABLE 10 Middle East & Africa Market Size, by Country, 2021–2035 (USD Billion) |
  26. TABLE 11 Global Market Size, by Product & Service, 2021–2035 (USD Billion) |
  27. TABLE 12 Global Market Size, by Sample Type, 2021–2035 (USD Billion) |
  28. TABLE 13 Global Market Size, by Technology, 2021–2035 (USD Billion) |
  29. TABLE 14 Global Market Size, by Testing Setting, 2021–2035 (USD Billion) |
  30. TABLE 15 Global Market Size, by End User, 2021–2035 (USD Billion) |
  31. TABLE 16 Competitive Benchmarking Matrix, 2026 |
  32. TABLE 17 Company Profiles – Key Players |
  33. TABLE 18 Recent Developments & Strategic Announcements, 2023–2025 |
  34. TABLE 19 Report Scope & Methodology Summary |
  35. TABLE 20 Detailed Sources & Citations Index
  36. 16 LIST OF FIGURES |
  37. FIGURE 1 Market Dynamics – Drivers, Restraints and Opportunities Overview |
  38. FIGURE 2 Industry Value Chain Analysis |
  39. FIGURE 3 Porter's Five Forces Analysis |
  40. FIGURE 4 Global Market Size Trend, 2021–2035 (USD Billion) |
  41. FIGURE 5 Year-over-Year Growth Trajectory, 2022–2035 (%) |
  42. FIGURE 6 Market Share by Product & Service, 2025 vs 2035 (%) |
  43. FIGURE 7 Market Share by Sample Type, 2025 vs 2035 (%) |
  44. FIGURE 8 Market Share by Technology, 2025 (%) |
  45. FIGURE 9 Market Share by Testing Setting, 2025 (%) |
  46. FIGURE 10 Market Share by End User, 2025 (%) |
  47. FIGURE 11 Regional Revenue Share Distribution, 2025 (%) |
  48. FIGURE 12 Regional CAGR Comparison, 2026–2035 (%) |
  49. FIGURE 13 Country-Level Contribution Heat Map, 2025 |
  50. FIGURE 14 Competitive Landscape – Estimated Revenue Share Bands, 2026 |
  51. FIGURE 15 Strategic Positioning Matrix – Menu Breadth vs Channel Reach
Share::
Request Free Sample

Segmentation Quick Reference

DimensionSub-SegmentsDominant SegmentFastest Growing Segment
By Product & ServiceConsumables; Instruments; ServicesConsumablesServices
By Sample TypeUrine; Oral Fluid; Hair; Breath; Blood; Other Sample TypesUrineOral Fluid
By TechnologyImmunoassay; Chromatography–Mass Spectrometry; Breath Analysers; Other TechnologiesImmunoassayChromatography–Mass Spectrometry
By Testing SettingWorkplace; Criminal Justice; Drug Treatment Centres; Pain Management; Schools & Colleges; Individuals/HomeWorkplaceIndividuals / Home
By End UserDrug Testing Laboratories; Hospitals; Workplaces & Employers; Criminal Justice Agencies; Home/Individual UsersDrug Testing LaboratoriesWorkplaces & Employers
By GeographyNorth America; Europe; Asia-Pacific; South America; Middle East & AfricaNorth AmericaAsia-Pacific


Market Segmentation Overview

By Product & Service

Sub-SegmentKey Trend
ConsumablesReagent menu expansion toward synthetic opioid analytes
InstrumentsPlacement-based commercial models replacing outright capital sales
ServicesGrowth in outsourced programme administration and result review


Revenue concentration sits with consumables, but competitive positioning is decided at the instrument layer. Suppliers place analysers to secure multi-year reagent commitments, then defend the account through menu breadth rather than price.

By Sample Type

Sub-SegmentKey Trend
UrineRetains regulatory primacy and arbitral precedent
Oral FluidCertification capacity expanding under federal authorisation
HairPreferred for retrospective pattern detection in mining and transport
BreathAnchored to roadside and pre-shift alcohol enforcement
BloodReserved for evidential and acute clinical toxicology
Other Sample TypesSweat patch and wastewater surveillance gaining traction


Specimen choice is a legal decision as much as a clinical one. Buyers select the format their jurisdiction will defend, which explains why urine holds share even where alternatives offer superior collection logistics.

By Technology

Sub-SegmentKey Trend
ImmunoassayCost leadership sustains first-line screening dominance
Chromatography–Mass SpectrometryBenchtop pricing decline pushing confirmation downmarket
Breath AnalysersDevice refresh cycles tied to enforcement procurement
Other TechnologiesBiosensor and spectroscopy platforms in early commercialisation


Screening and confirmation are converging economically. As mass spectrometry costs fall, the historical two-tier workflow faces pressure from laboratories willing to run definitive chemistry as a first-line method for high-value cases.

By Testing Setting

Sub-SegmentKey Trend
WorkplaceScope narrowing on cannabis, widening on synthetic opioids
Criminal JusticeDiversion programmes lifting recurring testing frequency
Drug Treatment CentresAdherence monitoring driving expanded panel adoption
Pain ManagementPayer scrutiny compressing definitive testing volumes
Schools & CollegesAthletic programme compliance sustaining stable demand
Individuals / HomeDirect-to-consumer channels growing on privacy preference


Setting mix is shifting toward clinical and community contexts. Employment testing still leads on volume, yet treatment and justice settings deliver higher tests-per-subject frequency and therefore stronger revenue durability.

By End User

Sub-SegmentKey Trend
Drug Testing LaboratoriesConsolidation around accredited confirmation capacity
HospitalsEmergency toxicology demand tracking overdose presentations
Workplaces & EmployersOn-site instrumented readers reducing result turnaround
Criminal Justice AgenciesField testing adoption for supervision caseloads
Home / Individual UsersE-commerce and pharmacy distribution scaling


Buying power is migrating outward from central laboratories. Employers and agencies increasingly own the screening step and purchase only confirmation, which reshapes how vendors structure pricing and support.




Share::
Request Free Sample
Download PDF ×

We do not share your information with anyone. However, we may send you emails based on your report interest from time to time. You may contact us at any time to opt-out.