Segmentation Quick Reference
| Dimension | Sub-Segments | Dominant Segment | Fastest Growing Segment |
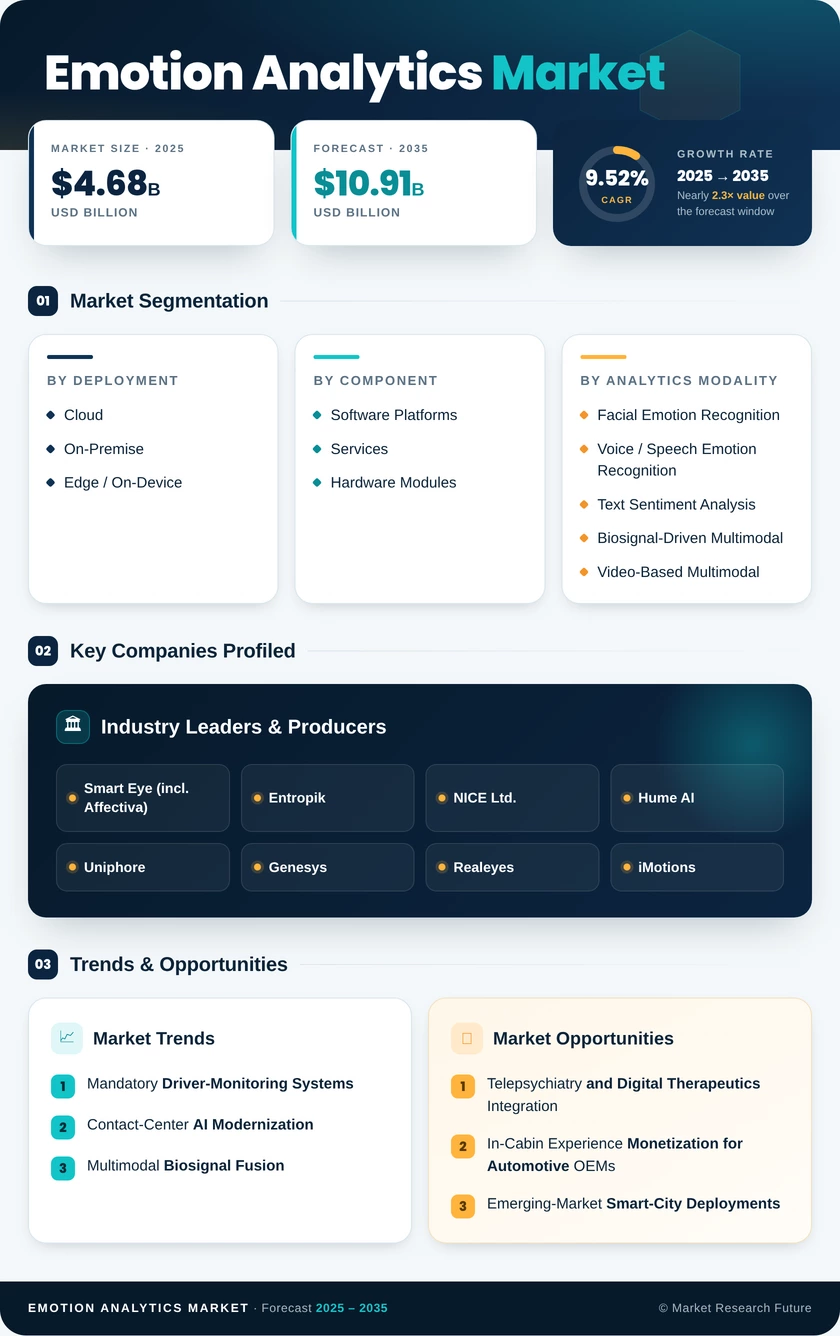
| Deployment | Cloud, On-Premise, Edge / On-Device | Cloud (58.2% share, 2025) | Edge / On-Device (10.78% CAGR) |
| Component | Software Platforms, Services, Hardware Modules | Software Platforms (USD 2.16B, 2025) | Hardware Modules (10.05% CAGR) |
| Analytics Modality | Facial Emotion Recognition, Voice/Speech, Text Sentiment, Biosignal-Driven Multimodal, Video-Based Multimodal | Facial Emotion Recognition (41.5% share, 2025) | Biosignal-Driven Multimodal (11.68% CAGR) |
| Application | Customer Service & Contact Centers, Product & Market Research, Emotion Analytics Market & Well-Being, Automotive & Transportation, Education & E-Learning | Customer Service & Contact Centers (59.1% share, 2025) | Emotion Analytics Market & Well-Being (9.69% CAGR) |
| Geography | North America, Europe, Asia-Pacific, South America, Middle East & Africa | North America (39.1% share, 2025) | Asia-Pacific (12.38% CAGR) |
Market Segmentation Overview
By Deployment
| Sub-Segment | Key Trend |
| Cloud | SaaS-first CCaaS migration driving dominant adoption; continuous model updates as differentiator |
| On-Premise | Data sovereignty requirements in banking, defense, and healthcare are sustaining demand |
| Edge / On-Device | Automotive DMS mandates and latency-critical clinical use cases are accelerating NPU adoption |
Cloud remains the default deployment for the Emotion Analytics Market, but the edge segment is closing the gap as automotive safety regulations and real-time clinical monitoring impose strict latency ceilings that cloud round-trips cannot satisfy.
By Component
| Sub-Segment | Key Trend |
| Software Platforms | Omnichannel emotion analytics suites integrating facial, voice, and text modalities |
| Services | System integration and managed emotion analytics services for complex enterprise deployments |
| Hardware Modules | Dedicated emotion inference NPUs embedded in automotive and IoT edge SoCs |
Software platforms capture the largest revenue share, but hardware modules are experiencing the fastest growth as semiconductor vendors integrate emotion-specific processing cores at the silicon level.
By Analytics Modality
| Sub-Segment | Key Trend |
| Facial Emotion Recognition | Mature modality leveraging ubiquitous camera infrastructure and action-unit coding |
| Voice / Speech Emotion Recognition | Deep integration with contact-center platforms for real-time agent coaching |
| Text Sentiment Analysis | NLP-driven expansion into social media monitoring and CX feedback loops |
| Biosignal-Driven Multimodal | Fusion of galvanic skin response, HRV, and EEG with visual/acoustic data |
| Video-Based Multimodal | Combined facial and body-language analysis for retail and education settings |
Multimodal approaches that combine three or more input channels are redefining accuracy benchmarks, with biosignal-driven fusion systems leading performance gains in clinical and automotive validation studies.
By Application
| Sub-Segment | Key Trend |
| Customer Service & Contact Centers | Real-time emotion scoring for agent coaching, predictive routing, and churn prevention |
| Product & Market Research | Neuromarketing and ad pre-testing using implicit emotional response measurement |
| Emotion Analytics Market & Well-Being | Telepsychiatry affects monitoring, digital therapeutics, and remote patient engagement |
| Automotive & Transportation | Driver monitoring, in-cabin personalization, occupant safety alerting |
| Education & E-Learning | Engagement scoring, adaptive content delivery, student wellbeing tracking |
Contact centers remain the revenue engine, but healthcare and automotive applications represent the highest-growth frontiers as regulatory mandates and reimbursement reforms create new procurement pathways.