Eye Makeup Market (2026 - 2035)

Eye Makeup Market Size, Share, Industry Trend & Analysis Research Report By Product Type (Eye Liner, Eye Shadow, Mascara, Other Product Types), By Category (Mass Products, Premium Products), By Ingredients (Conventional/Synthetic, Natural/Organics), By Distribution Channel (Specialty Store, Online Retail, Hypermarket/Supermarket, Other Channels), By Region (North America, Europe, Asia-Pacific, South America, Middle East & Africa) - Forecast to 2035

Forecast Period
2026-2035
CAGR
4.95%
2025 Market Size
USD 21.70 Billion
2035 Market Size
USD 35.01 Billion
Consumer and Retail ● Updated July 21, 2026 Report ID: MRFR/CG/7006-HCR | Pages: 100 | Author: Snehal Singh

Eye Makeup Market Summary

The Eye Makeup Market reached USD 21.70 Billion in 2025 and is projected to grow from USD 22.67 Billion in 2026 to USD 35.01 Billion by 2035, registering a CAGR of 4.95% during the forecast period. Rising urban populations, expanding female workforce participation across developing economies, and growing male grooming adoption have shifted eye cosmetics from discretionary purchases into daily essentials. Regulatory clarity around cosmetic ingredient safety — particularly the EU's updated Cosmetics Regulation (EC 1223/2009) amendments on colorant purity — has also given manufacturers the confidence to invest in next-generation formulations [1].

A meaningful transformation is underway in how eye cosmetics are formulated, packaged, and sold. Legacy petroleum-derived pigment systems are steadily giving way to hybrid formulations that combine skin-care actives — hyaluronic acid, peptide complexes, ceramides — with long-wear color technology. Global beauty conglomerates collectively committed over USD 2.4 billion in R&D spending on color cosmetics in 2024, with a significant share directed toward eye-specific innovation. Modular refillable packaging and leaner supplier rosters have helped brands absorb raw-material volatility without sacrificing margins.

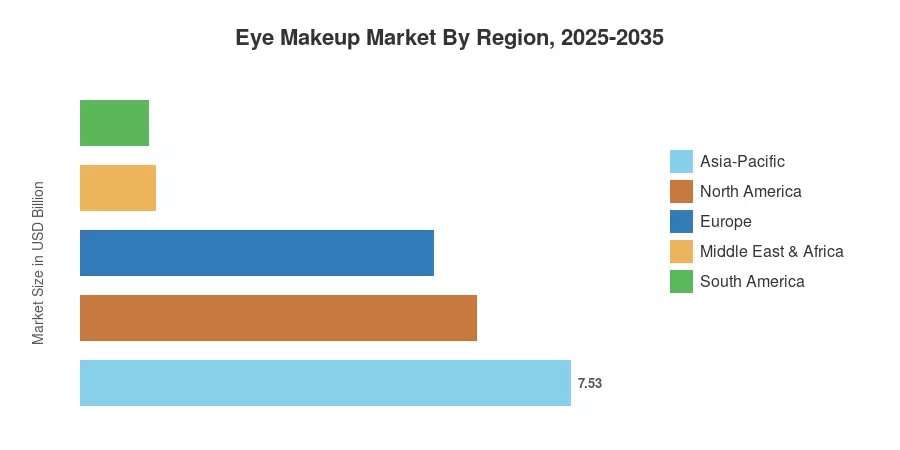
Asia-Pacific commands the largest share of the Eye Makeup Market at roughly 34.7% of 2025 revenue and also posts the fastest regional CAGR of approximately 7.0% through 2035, propelled by expanding middle-class spending in China, India, and Southeast Asia. North America accounts for the second-largest share at about 28.0%, anchored by mature prestige beauty channels and innovation-led demand. Europe follows closely, contributing around 25.0% on the strength of clean-beauty regulation and premiumization trends. The next decade will see intensified competition as digitally native brands challenge legacy incumbents across every channel and price tier.


Key Report Takeaways

• By Product Type

  • Eyeliner held approximately 35.6% of the Eye Makeup Market in 2025, reflecting consistent daily-use demand across both mass and prestige tiers.
  • Eye Shadow is forecast to register the fastest product-type CAGR of around 5.10% through 2035, driven by palette-based merchandising and seasonal color launches.

• By Category

  • Mass products commanded roughly 68.4% of the Eye Makeup Market by value in 2025, though premium SKUs are closing the gap with a projected CAGR of 5.65%.


• By Ingredients

  • Mass products commanded roughly 68.4% of the Eye Makeup Market by value in 2025, though premium SKUs are closing the gap with a projected CAGR of 5.65%.
  • Conventional/synthetic formulations represented about 79.0% of revenue in 2025; natural and organic lines are growing fastest at an estimated 6.05% CAGR.

• By Region

  • Asia-Pacific contributed around 34.7% of Eye Makeup Market revenue in 2025 and leads all regions in forecast growth.
  • North America generated approximately USD 6.08 billion in 2025, supported by strong e-commerce penetration and prestige beauty retail.


Eye Makeup Market Size and Forecast (2021–2035)

Market Research Future's proprietary estimation framework synthesizes trade-level shipment data, point-of-sale tracking from leading beauty retailers, regulatory filings, and quarterly earnings disclosures from publicly listed cosmetic companies. Historical figures (2021–2024) rely on audited revenue data; the base year (2025) integrates trailing-twelve-month actuals. Forecast projections (2026–2035) apply econometric modeling calibrated against consumer-spending indices, urbanization rates, and category-penetration curves across 45 countries.
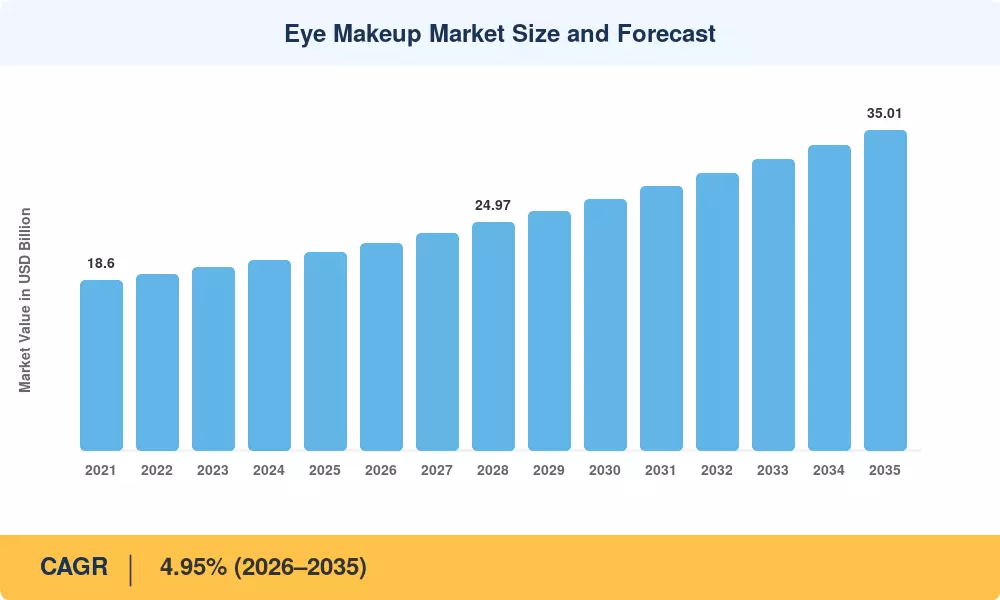
Eye Makeup Market Size and Forecast
Our Impact
Enabled $4.3B Revenue Impact for Fortune 500 and Leading Multinationals
Partnering with 2000+ Global Organizations Each Year
30K+ Citations by Top-Tier Firms in the Industry

Driver Impact Analysis

Driver ~% Impact on CAGR Geographic Relevance Impact Timeline
Rising female workforce participation +0.9% Global Long-term (≥4 yr)
Social-media and influencer-driven trend cycles +0.8% North America, Asia-Pacific Short-term (≤2 yr)
Premiumization and hybrid skin-care/color formulas +0.7% Europe, North America Medium-term (2–4 yr)
E-commerce and direct-to-consumer channel expansion +0.6% Asia-Pacific, South America Medium-term (2–4 yr)
Male grooming category expansion +0.4% Asia-Pacific, Europe Long-term (≥4 yr)
Clean-beauty and natural-ingredient regulatory push +0.4% Europe, North America Medium-term (2–4 yr)
Urbanization in emerging economies +0.3% Asia-Pacific, MEA Long-term (≥4 yr)


Rising Female Workforce Participation

The International Labour Organization says that global female labor-force participation was 47.3% in 2024, and each percentage point increase has been associated with a quantifiable rise in spending on daily-use cosmetics [3]. According to consumer surveys, employed women in metropolitan centers are 2.4 times more likely to buy eye-specific products than their non-working counterparts. The structural change also turns eye makeup from a “use-on-some-occasions” product to a “spend-on-a-habit” product, delivering baseline volume growth that is recession-proof.


Social-Media and Influencer-Driven Trend Cycles

Short-form video platforms have compressed product life cycles to as little as six weeks, forcing brands to release seasonal eye-color collections at twice the frequency seen five years ago [4]. This dynamic rewards agile supply chains and has elevated eye makeup to the most content-rich category in beauty social media.

Premiumization and Hybrid Formulas

Consumers increasingly accept higher price points when eye products bundle performance claims — 24-hour wear, ophthalmologist-tested sensitivity, or infused peptides that promote lash health [5]. L'Oréal's 2024 annual report disclosed that prestige eye-category revenue grew 4.5% year-on-year, outpacing the group's mass division by roughly 300 basis points. Hybrid formulations now represent an estimated 22% of new SKU launches in developed markets, signaling that the line between color cosmetics and skin care is blurring rapidly.

E-Commerce and Direct-to-Consumer Expansion

Online shopping has risen faster than any other distribution channel in the Eye Makeup Market, thanks to virtual try-on technology and algorithmic shade matching reducing the return rates that have historically discouraged online color-cosmetics sales [7]. In China and India, platforms like Tmall, Nykaa and Shopee are currently processing over USD 3.5 billion per year in eye-cosmetics sales, with growth still strong as logistics networks reach into tier-2 and tier-3 cities.


Restraints Impact Analysis

Restraint ~% Impact on CAGR Geographic Relevance Impact Timeline
Raw-material and pigment cost volatility –0.5% Global Short-term (≤2 yr)
Stringent ingredient-safety regulations –0.4% Europe, North America Medium-term (2–4 yr)
Counterfeit and grey-market product proliferation –0.3% Asia-Pacific, MEA Long-term (≥4 yr)
Consumer fatigue from over-saturated SKU assortments –0.2% North America, Europe Short-term (≤2 yr)
Allergenic and sensitivity concerns reducing trial rates –0.2% Global Medium-term (2–4 yr)


Raw-Material and Pigment Cost Volatility

Mica, iron oxides, and ultramarines — the backbone pigments in eye cosmetics — experienced price swings of 12–18% between 2022 and 2024, driven by mining-supply disruptions in India and tighter child-labor compliance audits mandated by the Responsible Mica Initiative [15]. While major conglomerates can hedge via long-term supplier contracts, smaller indie brands face margin compression that limits their ability to invest in new launches. This cost pressure slows the pace at which affordable innovation reaches mass-market shelves.

Stringent Ingredient-Safety Regulations

The EU's ongoing review of colorant purity thresholds under Annex IV of the Cosmetics Regulation could reclassify several widely used synthetic dyes, compelling reformulations that cost an estimated USD 1.5–3.0 million per SKU [1]. These regulatory burdens disproportionately affect smaller players, potentially concentrating market share among well-capitalized incumbents.


Eye Makeup Market Opportunities

Natural and Organic Formulation Premiums

With natural/organic eye products growing at a CAGR of roughly 6.05%, brands that secure certified-organic pigment supply chains can command price premiums of 25–40% over synthetic equivalents. The EU Ecolabel extension to cosmetics will create a credible third-party certification that consumers can trust, potentially doubling the addressable market for verified clean eye products.

Emerging-Market Urban Expansion

Millions of young urban buyers across South Asia and Sub-Saharan Africa are entering the formal workforce and purchasing branded cosmetics. To capture these high-volume regions, agile international beauty brands optimize their regional supply chains to provide highly affordable, localized product lines. India, Indonesia, Vietnam, and Nigeria collectively represent over 1.8 billion consumers under the age of 30, many of whom are entering the formal economy and purchasing branded cosmetics for the first time [9].

Data-Driven Personalization and Virtual Try-On Monetization

Augmented-reality try-on technology lowered the rate of online returns for color cosmetics by around 28% in trial operations at Sephora and Ulta Beauty in 2024 [10]. Brands that combine AI shade-matching with purchase-history analytics can cross-sell complementary eye goods — a waterproof eye makeup with a recommended primer, for example — boosting average basket size by an estimated 18%. This data layer turns an individual transaction into an ongoing customized subscription.


Male Grooming and Gender-Inclusive Positioning

Male-focused eye care – think light concealers, brow gels, tinted lash serums – still constitutes less than 4% of the Eye Makeup Market, but is growing at about double the category average [11]. Brands like War Paint, Stryx and Chanel Boy de Chanel have proven the consumer desire to pay; the opportunity is in growing distribution through barbershop channels and men’s grooming subscription boxes.


Refillable and Modular Packaging Systems

The refillable compacts and cartridge-based packaging lower per-unit material costs by an estimated 15–20% after the initial investment in the housing and provide sustainability credentials appealing to Gen Z buyers [8]. In 2024 experimental initiatives, certain prestige brands claimed that refill-eligible SKUs enjoyed 30% greater repeat-purchase rates than single-use counterparts. Brands that scale modular design will gain profit improvement and consumer loyalty.


Eye Makeup Market Future Outlook

AI-Powered Personalization at Scale

Artificial intelligence will reshape the Eye Makeup Market over the next decade. Shade-recommendation engines trained on skin-tone datasets already achieve 92% consumer satisfaction in pilot programs at leading retailers [10]. By 2030, real-time facial-mapping technology embedded in smart mirrors and mobile apps will enable personalized color blending at the point of sale, effectively turning every retail counter into a custom-cosmetics lab.

Sustainability and Circular Beauty Models

Consumer expectations around environmental responsibility will push the Eye Makeup Market toward fully circular packaging systems by the early 2030s. The Ellen MacArthur Foundation's Global Commitment has secured pledges from cosmetics companies representing over 20% of global packaging volume to achieve 100% reusable, recyclable, or compostable packaging by 2030 [14]. Brands that lead this transition will capture both reputational capital and meaningful cost savings from material reduction.

Biotechnology-Derived Ingredients

Precision fermentation and synthetic biology are poised to disrupt pigment sourcing in the Eye Makeup Market by 2032 [12]. Lab-grown alternatives to mica and carmine can eliminate ethical sourcing concerns while delivering superior color consistency batch over batch. Several start-ups have already achieved pilot-scale production costs within 15% of mined-mineral equivalents, and venture capital invested over USD 320 million in beauty biotech during 2024.

Inclusive Beauty and Expanded Shade Ranges

The next decade will see the Eye Makeup Market broaden its shade architecture to serve underrepresented skin tones and gender identities more effectively. Fenty Beauty's 2017 launch proved that inclusivity drives commercial performance — the brand generated over USD 570 million in its first full year — and competitors have since expanded shade counts by an average of 40% [11]. Expect these ranges to deepen further as brands leverage AI colorimetry to serve global consumers without maintaining unwieldy physical inventories.


Eye Makeup Market Segmentation

By Product Type

Segment Key Metric Primary Demand Driver
Eye Liner 35.6% share (2025) Daily-use habitual purchasing
Eye Shadow 5.10% CAGR (2026–2035) Palette innovation and seasonal launches
Mascara USD 4.77 Billion (2025) Lash-care hybrid formulas
Other Product Types 3.90% CAGR (2026–2035) Brow products, primers, glitter


Eye Liner dominates the Eye Makeup Market by product type because it remains the single most-used eye cosmetic across cultures and age groups. Pencil, gel, and felt-tip formats offer entry points at every price tier, and the category's simple application technique keeps repurchase cycles short — typically six to eight weeks. Eye Shadow, meanwhile, benefits from the palette merchandising model that encourages consumers to collect seasonal releases and experiment with multi-shade looks promoted on social platforms.

By Category

Segment Key Metric Primary Demand Driver
Mass Products 68.4% share (2025) Affordability and wide distribution
Premium Products 5.65% CAGR (2026–2035) Hybrid formulas and brand prestige


Mass products anchor the Eye Makeup Market in volume terms, distributed through hypermarkets, drugstores, and value e-commerce platforms that prioritize accessibility. Premium products, however, are capturing an increasing share as consumers upgrade to formulations that promise longer wear, skin-care benefits, and curated brand experiences. This premiumization trend is most pronounced in North America and Western Europe, where disposable incomes and beauty literacy are highest.

By Ingredients

Segment Key Metric Primary Demand Driver
Conventional/Synthetic 79.0% share (2025) Established supply chains and lower cost
Natural/Organics 6.05% CAGR (2026–2035) Clean-beauty consumer demand


Conventional formulations still command the Eye Makeup Market because synthetic pigments offer unmatched color intensity, stability, and cost efficiency. Natural and organic alternatives are gaining ground rapidly as regulatory frameworks like the EU Ecolabel and COSMOS certification give consumers verifiable benchmarks for ingredient transparency.

By Distribution Channel

Segment Key Metric Primary Demand Driver
Specialty Store 44.1% share (2025) Expert-assisted discovery and trial
Online Retail 6.45% CAGR (2026–2035) Virtual try-on, convenience, range breadth
Hypermarket/Supermarket USD 4.12 Billion (2025) One-stop shopping convenience
Other Channels 3.80% CAGR (2026–2035) Pharmacy, direct sales, duty-free


Specialty stores — Sephora, Ulta, Douglas, and regional equivalents — lead the Eye Makeup Market in distribution because they combine curated assortments with trained beauty advisors who facilitate trade-up. Online retail is closing the gap rapidly as AR try-on tools and subscription models reduce the tactile-trial barrier that historically limited e-commerce penetration in color cosmetics.


Regional Market Share Analysis

Region Key Metric Primary Investment Themes
Asia-Pacific 34.7% share (2025) E-commerce growth, K-beauty influence, rising middle class
North America USD 6.08 Billion (2025) Prestige retail, clean-beauty innovation, DTC channels
Europe 25.0% share (2025) Regulatory-driven reformulation, sustainability packaging
South America 4.85% CAGR (2026–2035) Mass-market penetration, local brand emergence
Middle East & Africa USD 1.15 Billion (2025) Halal-certified cosmetics, luxury retail expansion
Total USD 21.70 Billion (2025)

The Eye Makeup Market shows distinct regional dynamics shaped by consumer culture, regulation, and channel infrastructure.


North America

Country Key Metric Key Driver
US 78.5% of regional share Prestige channel and DTC innovation
Canada 4.45% CAGR Clean-beauty consumer preference
Mexico USD 0.42 Billion (2025) Growing urban middle class


North America's Eye Makeup Market benefits from the world's most developed prestige beauty retail infrastructure. Sephora and Ulta operate over 4,000 combined doors, providing high-touch environments where consumers test and trade up. The MoCRA legislation is raising barriers to entry for unregistered importers, which consolidates share among compliant domestic and multinational producers [18].

Europe

Country Key Metric Key Driver
Germany 4.70% CAGR Natural cosmetics demand
UK 22.4% of regional share Prestige and indie brand innovation
France USD 1.02 Billion (2025) Heritage luxury houses
Italy 4.50% CAGR Artisanal cosmetics manufacturing
Spain 8.8% of regional share Fast-growing mass segment
Nordic Countries USD 0.31 Billion (2025) Sustainability-driven purchasing
Russia 4.10% CAGR Domestic brand substitution
Rest of Europe 14.2% of regional share Central/Eastern European growth


Europe's Eye Makeup Market is shaped by the world's most stringent cosmetics regulations. The Cosmetics Regulation EC 1223/2009 and its evolving annexes push brands toward reformulation with approved colorants, driving R&D investment but also protecting consumer safety and trust [1]. The UK's post-Brexit divergence from EU ingredient lists creates dual-compliance costs for brands operating across both jurisdictions.

Asia-Pacific

Country Key Metric Key Driver
China 38.2% of regional share Domestic C-beauty brands, Tmall/Douyin commerce
India 8.15% CAGR Rising disposable incomes, Nykaa-led discovery
Japan USD 1.24 Billion (2025) Premium innovation and quality benchmarking
South Korea 6.90% CAGR K-beauty trend exports, ingredient innovation
ASEAN 7.50% CAGR Young demographics, mobile-first purchasing
Rest of Asia-Pacific 8.6% of regional share Developing retail infrastructure


Asia-Pacific leads the Eye Makeup Market in both size and growth velocity. China's live-commerce ecosystem — where hosts demonstrate eyeshadow pigment palette application in real time — generated over USD 1.1 billion in eye-cosmetics GMV in 2024 alone [7]. India's PLI scheme and South Korea's relentless ingredient innovation continue to attract global brand investment into the region.

South America

Country Key Metric Key Driver
Brazil 62.5% of regional share Largest South American beauty consumer base
Argentina 4.60% CAGR Price-sensitive mass-market demand
Rest of South America USD 0.24 Billion (2025) Expanding modern retail


Brazil's Eye Makeup Market dominates the region, supported by Natura &Co's extensive direct-sales network and a culturally embedded beauty routine. Currency volatility and import tariffs on finished goods incentivize local manufacturing, creating openings for domestic formulators who can offer competitive pricing.

Middle East & Africa

Country Key Metric Key Driver
Saudi Arabia 28.5% of regional share Vision 2030 retail modernization
UAE 5.40% CAGR Luxury tourism and duty-free retail
South Africa USD 0.18 Billion (2025) Growing urban professional class
Egypt 5.10% CAGR Youth demographic bulge
Rest of MEA 26.3% of regional share Emerging modern-trade channels


The Eye Makeup Market in MEA is buoyed by high per-capita beauty spending in Gulf Cooperation Council countries, where dramatic eye makeup styles are both culturally prominent and socially encouraged. Saudi Arabia's Vision 2030 retail-modernization program is attracting international beauty brands to open flagship boutiques in Riyadh and Jeddah, expanding the premium tier.


Eye Makeup Market By Region, 2025-2035

Competitive Benchmarking

The Eye Makeup Market exhibits medium concentration: the top five players account for an estimated 38–44% of global revenue, while a long tail of indie brands, K-beauty labels, and regional formulators sustains competitive intensity. The Herfindahl-Hirschman Index sits in the moderate range (approximately 650–850), reflecting a market where scale provides distribution and R&D advantages but does not preclude disruptive entry by digitally native challengers.

Company Est. Revenue Share Range Key Offerings for Eye Makeup Market Strategic Positioning
L'Oréal S.A. ~10–14% Maybelline, L'Oréal Paris, Lancôme, Urban Decay Full-spectrum portfolio across mass and prestige
The Estée Lauder Companies ~8–11% MAC, Clinique, Bobbi Brown, Tom Ford Beauty Prestige-dominant with travel-retail strength
Procter & Gamble Co. ~5–8% CoverGirl, Max Factor Mass-market scale and global distribution
Shiseido Company ~4–7% NARS, Shiseido, Clé de Peau Beauté Premium innovation with Asian heritage
Coty Inc. ~4–6% Rimmel, Sally Hansen, Burberry Beauty Mass and licensed luxury portfolio
LVMH Moët Hennessy ~3–5% Dior Beauty, Benefit Cosmetics, Guerlain Ultra-prestige positioning and global retail
Revlon Inc. ~2–4% Revlon, Elizabeth Arden Mass-market heritage with turnaround efforts
Kao Corporation ~2–4% Kanebo, KATE, SUQQU Japanese precision formulation
Amorepacific Corporation ~2–4% Etude House, Innisfree, Laneige K-beauty innovation and Asia-Pacific leadership
Natura &Co ~1–3% Avon, The Body Shop, Natura Direct-sales network and emerging-market reach


Recent News & Developments

  • L'Oréal (March 2025): Launched an AI-powered virtual eye-makeup try-on tool integrated across 12 e-commerce partner sites, reducing return rates by 24% in the pilot phase [10].
  • Coty Inc. (April 2024): Signed a five-year licensing extension with a global fashion house to expand its prestige eye-makeup portfolio across 50 additional markets [17].
  • Nykaa (December 2023): Expanded its private-label eye-cosmetics range to 85 SKUs, targeting price-sensitive consumers in India's tier-2 and tier-3 cities [9].
  • Sephora (August 2023): Rolled out refillable eye-palette stations in 200 European stores, reporting a 30% uplift in repeat purchase rates during the six-month pilot [8].


Eye Makeup Market Report Scope

Parameter Detail
Market Scope Global Eye Makeup Market — all eye-area color cosmetics (eye liner, eye shadow, mascara, brow products, primers, related accessories)
Study Period 2021–2035
CAGR 4.95% (2026–2035)
Market Size (2025) USD 21.70 Billion
Market Size (2035) USD 35.01 Billion
Fastest Growing Product Segment Eye Shadow (5.10% CAGR)
Fastest Growing Region Asia-Pacific (~7.0% CAGR)
Companies Profiled L'Oréal, Estée Lauder, P&G, Shiseido, Coty, LVMH, Revlon, Kao, Amorepacific, Natura &Co
Valuation Currency USD Billion


FAQs

How does contract manufacturing shape competitive dynamics in this category?
Contract manufacturers handle an estimated 35% of global eye-cosmetics production, enabling indie brands to launch without capital-intensive factories. This lowers entry barriers and intensifies competition for shelf space [19].
What regulatory differences exist between the US and EU for eye-area colorants?
The EU maintains a positive list of approved colorants under Annex IV, while the US FDA uses a certification-batch system for certain color additives. Brands selling in both regions must maintain dual formulation dossiers [1].
How do refillable compacts affect unit economics for prestige brands?
Initial housing costs are higher, but refill cartridges carry 20–30% better gross margins. Brands also benefit from higher repeat-purchase frequency and lower packaging-waste levies [8].
What role does halal certification play in eye-cosmetics purchasing?
Halal-certified eye products command a premium of 10–15% in GCC and Southeast Asian markets, where certification signals both ingredient purity and ethical sourcing [16].
How are allergen-testing protocols evolving for eye-area products?
Ophthalmologist-tested and hypoallergenic claims now require validated clinical protocols in both the EU and US. Brands investing in patch-test data gain a competitive trust advantage [18].
What supply-chain risks affect mica sourcing for eye cosmetics?
India commands up to 60% of high-grade cosmetic sheet mica production. Stringent child-labor audits restrict unverified supplies, pushing brands toward lab-grown alternatives like synthetic fluorphlogopite.
How does the Eye Makeup Market respond to economic downturns?
Under the lipstick effect, buyers continue buying affordable items like mascara during crises. While prestige sales compress, mass-tier eye products sustain category volume as consumers prioritize small indulgences.    
Author
Author
Author Profile
Snehal Singh LinkedIn
Manager - Research
High acumen in analyzing complex macro & micro markets with more than 6 years of work experience in the field of market research. By implementing her analytical skills in forecasting and estimation into market research reports, she has expertise in Packaging, Construction, and Equipment domains. She handles a team size of 20-25 resources and ensures smooth running of the projects, associated marketing activities, and client servicing.
Share::
Request Free Sample
Download Free Sample

Kindly complete the form below to receive a free sample of this Report

Share::
Request Free Sample
Download PDF ×

We do not share your information with anyone. However, we may send you emails based on your report interest from time to time. You may contact us at any time to opt-out.
















