Segmentation Quick Reference
| Dimension | Sub-Segments | Dominant Segment | Fastest Growing Segment |
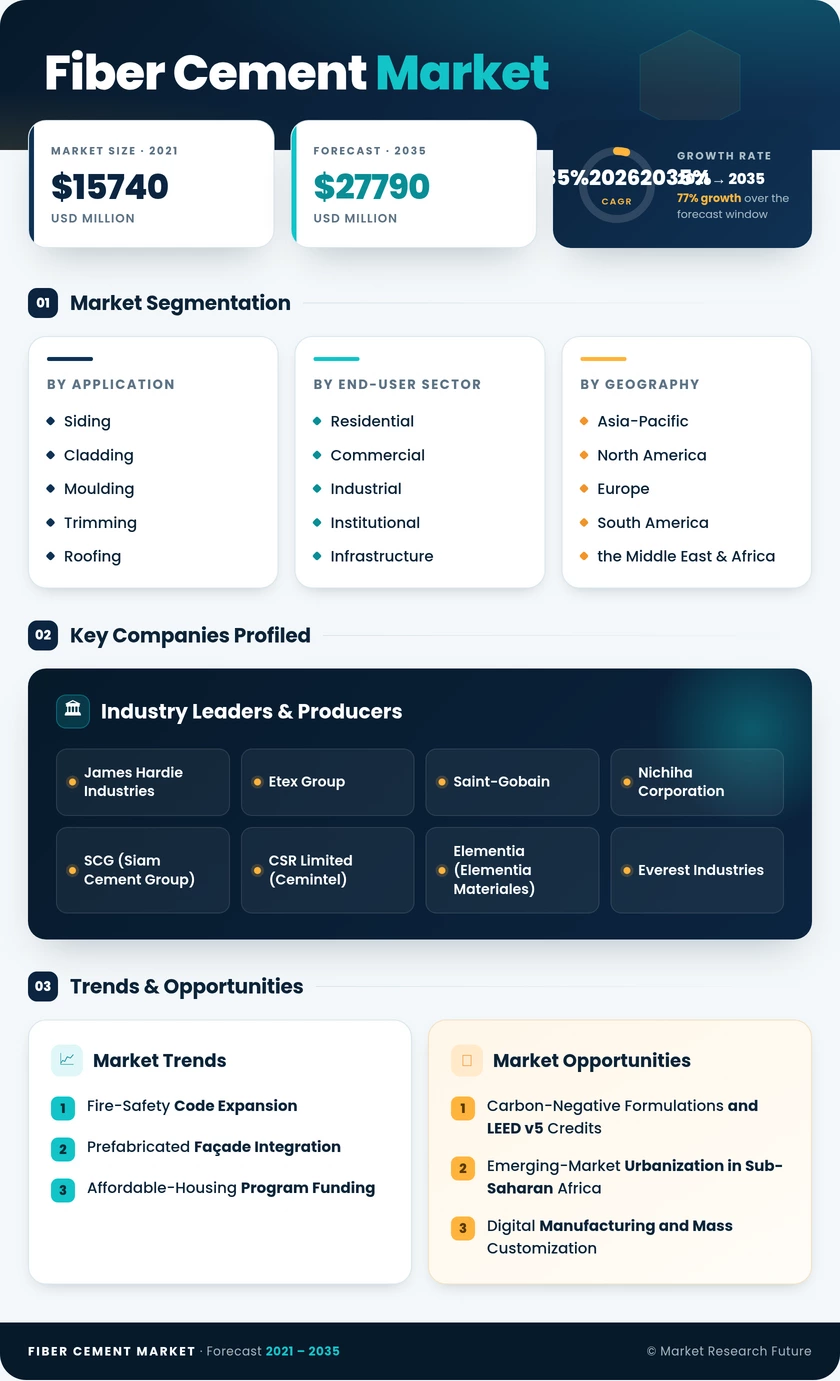
| By Application | Siding, Cladding, Moulding and Trimming, Roofing, Other Applications | Siding (37.6% share, 2025) | Cladding (4.90% CAGR) |
| By End-User Sector | Residential, Commercial, Industrial and Institutional, Infrastructure | Residential (48.2% share, 2025) | Commercial (4.56% CAGR) |
| By Geography | Asia-Pacific, North America, Europe, South America, the Middle East & Africa | Asia-Pacific (46.2% share, 2025) | Middle East & Africa (4.73% CAGR) |
Market Segmentation Overview
By Application
| Sub-Segment | Key Trend |
| Siding | Insurance-mandated adoption in wildfire and hurricane corridors |
| Cladding | Prefabricated commercial façade system integration |
| Moulding and Trimming | Renovation-driven replacement of wood trim products |
| Roofing | Tropical-climate durability replacing corrugated metal. |
| Other Applications | Flooring underlayment and partition board niches |
Siding dominates application-level demand because single-family residential construction consumes the largest share of fiber cement boards globally. Cladding is closing the gap as commercial developers adopt factory-assembled construction cladding materials to compress project schedules and meet green-building certification requirements.
By End-User Sector
| Sub-Segment | Key Trend |
| Residential | Affordable-housing programs and suburban expansion |
| Commercial | Green-building certification driving specification shifts |
| Industrial and Institutional | Warehouse, hospital, and educational facility construction |
| Infrastructure | Transit stations, utility buildings, and public works |
Residential end users account for the largest volume share because government-backed housing programs in India, Brazil, and China explicitly specify durable building panels in material procurement standards. Commercial-sector growth is outpacing residential on a CAGR basis as LEED v5 and BREEAM frameworks incentivize non-combustible exterior wall materials.