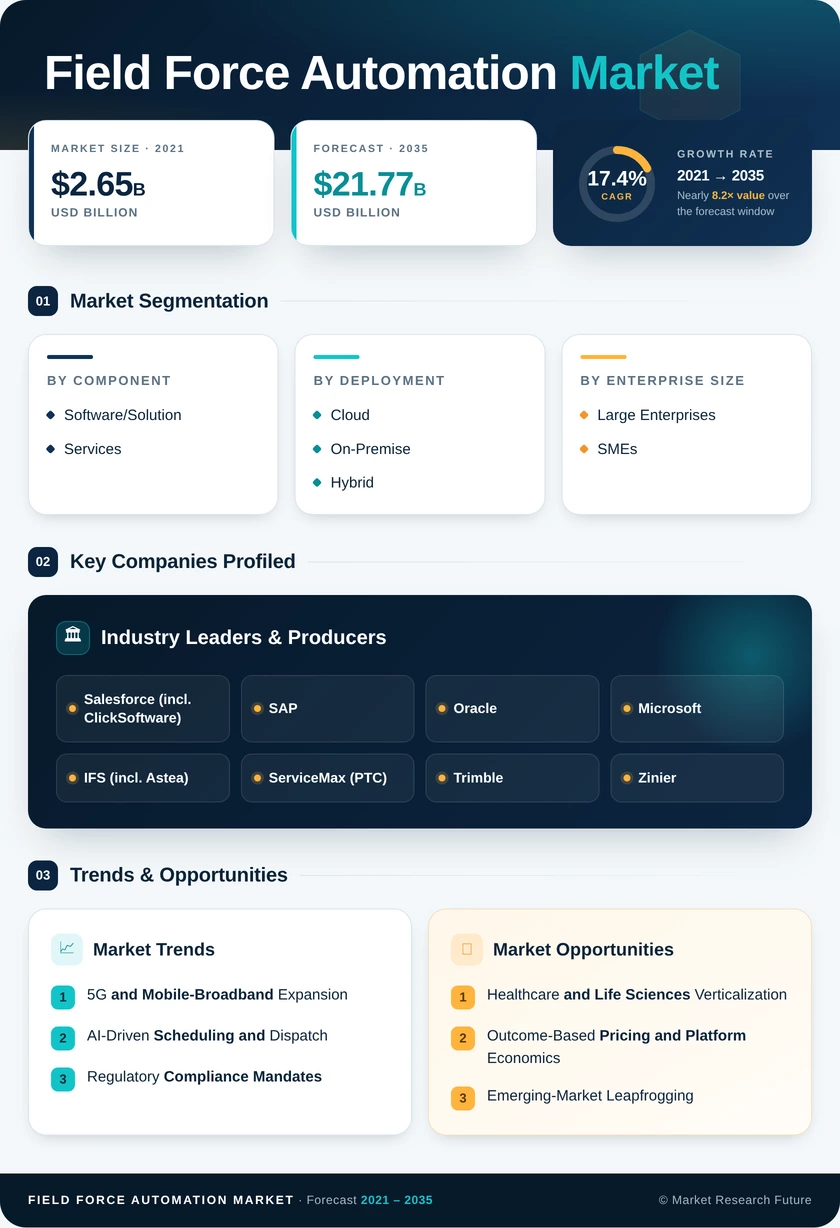
Field Force Automation Market (2026 - 2035)

ID: MRFR/ICT/7214-HCR
141 Pages
Apoorva Priyadarshi
Last Updated: June 26, 2026
Field Force Automation Market Size, Share and Research Report By Component (Software/Solution, Services), By Deployment (Cloud, On-Premise, Hybrid), By Enterprise Size (Large Enterprises, SMEs), By Platform (Android, iOS, Windows), By Functionality (Scheduling and Dispatch, Route Optimization, Inventory and Parts Management, Work Order Management, Customer Management, Reporting and Analytics), By End-User Industry (Transportation and Logistics, Healthcare and Life Sciences, IT and Telecom, Manufacturing, Energy and Utilities, Others [Retail, BFSI, Government]) - Industry Forecast to 2035
Field Force Automation Market
Market Size
Forecast Period2026-2035
CAGR (2026-2035)17.4%
2025 Market SizeUSD 4.38 Billion
2035 Market SizeUSD 21.77 Billion
Key Players
Salesforce
SAP
Oracle
Microsoft
IFS
ServiceMax
Opportunities
  • Healthcare and Life Sciences Verticalization
  • Outcome-Based Pricing and Platform Economics
  • Emerging-Market Leapfrogging
  1. 1 Market Overview |
    1. 1.1 Study Assumptions & Market Definition |
    2. 1.2 Scope of the Study |
    3. 1.3 Research Methodology
  2. 2 Market Summary & Key Takeaways
  3. 3 Market Dynamics |
    1. 3.1 Market Drivers Analysis | |
      1. 3.1.1 5G and Mobile-Broadband Expansion | |
      2. 3.1.2 AI-Driven Scheduling and Dispatch | |
      3. 3.1.3 Regulatory Compliance Mandates (EVV, Safety Audits) | |
      4. 3.1.4 Falling Device and Sensor Costs | |
      5. 3.1.5 Outcome-Based and SaaS Pricing Models | |
      6. 3.1.6 IoT-Edge Convergence in Utilities and Manufacturing | |
      7. 3.1.7 Carbon-Tracking and ESG Reporting Requirements |
    2. 3.2 Market Restraints Analysis | |
      1. 3.2.1 Data-Privacy and Cross-Border Compliance | |
      2. 3.2.2 Integration Complexity with Legacy ERP/CRM | |
      3. 3.2.3 Connectivity Gaps in Rural and Remote Regions | |
      4. 3.2.4 Workforce Resistance and Change-Management Costs | |
      5. 3.2.5 Cybersecurity Risks in Edge-Device Networks |
    3. 3.3 Market Opportunity Analysis | |
      1. 3.3.1 Healthcare and Life Sciences Verticalization | |
      2. 3.3.2 Outcome-Based Pricing and Platform Economics | |
      3. 3.3.3 Emerging-Market Leapfrogging | |
      4. 3.3.4 Carbon-Tracking and ESG Data Monetization | |
      5. 3.3.5 AR-Guided Remote Assistance |
    4. 3.4 Industry Value Chain Analysis |
    5. 3.5 Porter's Five Forces Analysis
  4. 4 Global Field Force Automation Market Size & Forecast (2021–2035) |
    1. 4.1 Historical Market Size (2021–2025) |
    2. 4.2 Current & Forecast Market Size (2026–2035) |
    3. 4.3 Market Size by Revenue (USD Billion) |
    4. 4.4 Year-over-Year Growth Analysis
  5. 5 Segmentation Analysis |
    1. 5.1 By Component | |
      1. 5.1.1 Software/Solution | |
      2. 5.1.2 Services |
    2. 5.2 By Deployment | |
      1. 5.2.1 Cloud | |
      2. 5.2.2 On-Premise | |
      3. 5.2.3 Hybrid |
    3. 5.3 By Enterprise Size | |
      1. 5.3.1 Large Enterprises | |
      2. 5.3.2 SMEs |
    4. 5.4 By Platform | |
      1. 5.4.1 Android | |
      2. 5.4.2 iOS | |
      3. 5.4.3 Windows |
    5. 5.5 By Functionality | |
      1. 5.5.1 Scheduling and Dispatch | |
      2. 5.5.2 Route Optimization | |
      3. 5.5.3 Inventory and Parts Management | |
      4. 5.5.4 Work Order Management | |
      5. 5.5.5 Customer Management | |
      6. 5.5.6 Reporting and Analytics |
    6. 5.6 By End-User Industry | |
      1. 5.6.1 Transportation and Logistics | |
      2. 5.6.2 Healthcare and Life Sciences | |
      3. 5.6.3 IT and Telecom | |
      4. 5.6.4 Manufacturing | |
      5. 5.6.5 Energy and Utilities | |
      6. 5.6.6 Others (Retail, BFSI, Government)
  6. 6 Regional Analysis |
    1. 6.1 North America | |
      1. 6.1.1 United States | |
      2. 6.1.2 Canada | |
      3. 6.1.3 Mexico |
    2. 6.2 Europe | |
      1. 6.2.1 Germany | |
      2. 6.2.2 United Kingdom | |
      3. 6.2.3 France | |
      4. 6.2.4 Italy | |
      5. 6.2.5 Spain | |
      6. 6.2.6 Nordic Countries | |
      7. 6.2.7 Russia | |
      8. 6.2.8 Rest of Europe |
    3. 6.3 Asia-Pacific | |
      1. 6.3.1 China | |
      2. 6.3.2 India | |
      3. 6.3.3 Japan | |
      4. 6.3.4 South Korea | |
      5. 6.3.5 ASEAN | |
      6. 6.3.6 Rest of Asia-Pacific |
    4. 6.4 South America | |
      1. 6.4.1 Brazil | |
      2. 6.4.2 Argentina | |
      3. 6.4.3 Rest of South America |
    5. 6.5 Middle East & Africa | |
      1. 6.5.1 Saudi Arabia | |
      2. 6.5.2 UAE | |
      3. 6.5.3 South Africa | |
      4. 6.5.4 Egypt | |
      5. 6.5.5 Rest of MEA
  7. 7 Competitive Landscape |
    1. 7.1 Market Share Analysis (2025) |
    2. 7.2 Competitive Benchmarking Matrix |
    3. 7.3 Company Profiles | |
      1. 7.3.1 Salesforce (incl. ClickSoftware) | |
      2. 7.3.2 SAP | |
      3. 7.3.3 Oracle | |
      4. 7.3.4 Microsoft | |
      5. 7.3.5 IFS (incl. Astea) | |
      6. 7.3.6 ServiceMax (PTC) | |
      7. 7.3.7 Trimble | |
      8. 7.3.8 Zinier | |
      9. 7.3.9 OverIT | |
      10. 7.3.10 ServiceNow
  8. 8 Future Outlook & Strategic Recommendations (2026–2035) |
    1. 8.1 Autonomous Scheduling and Predictive Dispatch |
    2. 8.2 Platform Consolidation and Ecosystem Lock-In |
    3. 8.3 Sustainability-Driven Feature Differentiation |
    4. 8.4 Edge-AI and Offline-First Architectures
  9. 9 Recent Developments & News
  10. 10 Frequently Asked Questions (FAQs)
  11. 11 Report Scope & Methodology |
    1. 11.1 Study Period & Base Year |
    2. 11.2 Data Sources & Citations |
    3. 11.3 Abbreviations
  12. 12 LIST OF TABLES |
  13. TABLE 1 Global Field Force Automation Market Size & Forecast, by Revenue (USD Billion), 2021–2035 |
  14. TABLE 2 Global Field Force Automation Market — Year-over-Year Growth Analysis, 2021–2035 |
  15. TABLE 3 Market Driver Impact Analysis, 2026–2035 |
  16. TABLE 4 Market Restraint Impact Analysis, 2026–2035 |
  17. TABLE 5 Global Field Force Automation Market Size, by Component, 2021–2035 (USD Billion) |
  18. TABLE 6 Global Field Force Automation Market Size, by Deployment, 2021–2035 (USD Billion) |
  19. TABLE 7 Global Field Force Automation Market Size, by Enterprise Size, 2021–2035 (USD Billion) |
  20. TABLE 8 Global Field Force Automation Market Size, by Platform, 2021–2035 (USD Billion) |
  21. TABLE 9 Global Field Force Automation Market Size, by Functionality, 2021–2035 (USD Billion) |
  22. TABLE 10 Global Field Force Automation Market Size, by End-User Industry, 2021–2035 (USD Billion) |
  23. TABLE 11 Global Field Force Automation Market Size, by Region, 2021–2035 (USD Billion) |
  24. TABLE 12 North America Field Force Automation Market Size, by Country, 2021–2035 (USD Billion) |
  25. TABLE 13 Europe Field Force Automation Market Size, by Country, 2021–2035 (USD Billion) |
  26. TABLE 14 Asia-Pacific Field Force Automation Market Size, by Country, 2021–2035 (USD Billion) |
  27. TABLE 15 South America Field Force Automation Market Size, by Country, 2021–2035 (USD Billion) |
  28. TABLE 16 Middle East & Africa Field Force Automation Market Size, by Country, 2021–2035 (USD Billion) |
  29. TABLE 17 Competitive Benchmarking Matrix — Global Field Force Automation Market, 2025 |
  30. TABLE 18 Company Profiles — Key Players, Global Field Force Automation Market |
  31. TABLE 19 Recent Developments & Strategic Announcements, 2023–2025 |
  32. TABLE 20 Report Scope & Methodology Summary |
  33. TABLE 21 Detailed Sources and Citations
  34. 13 LIST OF FIGURES |
  35. FIGURE 1 Field Force Automation Market Dynamics — Drivers, Restraints, and Opportunities |
  36. FIGURE 2 Industry Value Chain Analysis — Field Force Automation Market |
  37. FIGURE 3 Porter's Five Forces Analysis — Field Force Automation Market |
  38. FIGURE 4 Global Field Force Automation Market Size Trend (USD Billion), 2021–2035 |
  39. FIGURE 5 Field Force Automation Market Share, by Component (2025) |
  40. FIGURE 6 Field Force Automation Market Share, by Deployment (2025) |
  41. FIGURE 7 Field Force Automation Market Share, by Enterprise Size (2025) |
  42. FIGURE 8 Field Force Automation Market Share, by Platform (2025) |
  43. FIGURE 9 Field Force Automation Market Share, by Functionality (2025) |
  44. FIGURE 10 Field Force Automation Market Share, by End-User Industry (2025) |
  45. FIGURE 11 Field Force Automation Market Share, by Region (2025) |
  46. FIGURE 12 North America Field Force Automation Market — Country-Level Revenue Split |
  47. FIGURE 13 Europe Field Force Automation Market — Country-Level Revenue Split |
  48. FIGURE 14 Asia-Pacific Field Force Automation Market — Country-Level Revenue Split |
  49. FIGURE 15 South America Field Force Automation Market — Country-Level Revenue Split |
  50. FIGURE 16 Middle East & Africa Field Force Automation Market — Country-Level Revenue Split |
  51. FIGURE 17 Competitive Landscape — Market Share of Top 10 Players (2025)

Segmentation Quick Reference

DimensionSub-SegmentsDominant SegmentFastest Growing Segment
ComponentField Force Automation Market/Solution, ServicesField Force Automation Market/SolutionServices
DeploymentCloud, On-Premise, HybridCloudHybrid
Enterprise SizeLarge Enterprises, SMEsLarge EnterprisesSMEs
PlatformAndroid, iOS, WindowsAndroidiOS
FunctionalityScheduling and Dispatch, Route Optimization, Inventory and Parts Management, Work Order Management, Customer Management, Reporting and AnalyticsScheduling and DispatchInventory and Parts Management
End-User IndustryTransportation and Logistics, Healthcare and Field Force Automation Market, IT and Telecom, Manufacturing, Energy and Utilities, OthersTransportation and LogisticsHealthcare and Field Force Automation Market


Market Segmentation Overview

By Component

Sub-SegmentKey Trend
Field Force Automation Market/SolutionShift from standalone scheduling tools to unified AI-orchestrated platform suites.
ServicesGrowth in managed services and outcome-based implementation contracts


Field Force Automation Market/Solution captures the largest revenue share as enterprises consolidate multiple point solutions into single-vendor platforms. Service growth is propelled by demand for change management, training, and ongoing optimization support.

By Deployment

Sub-SegmentKey Trend
CloudMulti-tenant SaaS models with elastic scaling for seasonal workforce fluctuations
On-PremisePersists in defense, government, and heavily regulated industries requiring data sovereignty
HybridBridges legacy on-premise ERP with cloud-native scheduling and analytics modules


Cloud deployment dominates as organizations prioritize operational agility over infrastructure control. Hybrid models are gaining traction among enterprises midway through digital transformation.

By Enterprise Size

Sub-SegmentKey Trend
Large EnterprisesMulti-region, multi-skill-set deployments with custom analytics layers
SMEsSelf-service SaaS tiers with usage-based pricing and mobile-first UX


Large enterprises drive current spending volume, while SMEs represent the faster-expanding segment as affordable entry points proliferate.

By Platform

Sub-SegmentKey Trend
AndroidPreferred for cost-sensitive deployments and rugged-device availability
iOSGrowing in enterprise-mandated security environments and MDM-heavy organizations
WindowsDeclining share; persists in legacy ruggedized tablet deployments.


Android's dominance reflects the economics of equipping large field teams with sub-USD 200 rugged devices. iOS growth stems from corporate security policies favoring Apple's closed ecosystem.

By Functionality

Sub-SegmentKey Trend
Scheduling and DispatchAI-powered auto-scheduling replacing manual dispatcher workflows
Route OptimizationCarbon-aware routing algorithms integrating fuel and emissions data
Inventory and Parts ManagementPredictive replenishment tied to work-order forecasting models
Work Order ManagementDigital audit trails replacing paper-based sign-off processes
Customer ManagementReal-time NPS scoring and automated post-visit surveys
Reporting and AnalyticsExecutive dashboards with embedded predictive KPI modeling


Scheduling and Dispatch remains the foundational module that anchors platform selection. Inventory and Parts Management is the fastest-growing functionality as first-time-fix economics increasingly drive procurement decisions.

By End-User Industry

Sub-SegmentKey Trend
Transportation and LogisticsLast-mile delivery orchestration and real-time fleet visibility
Healthcare and Field Force Automation MarketEVV compliance, home-health visit tracking, clinical-trial monitoring
IT and TelecomCell-tower maintenance and fiber-rollout coordination
ManufacturingPredictive equipment servicing tied to IoT sensor feeds
Energy and UtilitiesSmart-meter deployment and grid-fault response automation
Others (Retail, BFSI, Government)Branch-banking automation, government facility management


Transportation and Logistics holds the largest end-user share, while Healthcare and Field Force Automation Market are the fastest-growing verticals driven by regulatory mandates and demographic tailwinds.


 

Download PDF ×

We do not share your information with anyone. However, we may send you emails based on your report interest from time to time. You may contact us at any time to opt-out.