Field Force Automation Market (2026 - 2035)

Field Force Automation Market Size, Share and Research Report By Component (Software/Solution, Services), By Deployment (Cloud, On-Premise, Hybrid), By Enterprise Size (Large Enterprises, SMEs), By Platform (Android, iOS, Windows), By Functionality (Scheduling and Dispatch, Route Optimization, Inventory and Parts Management, Work Order Management, Customer Management, Reporting and Analytics), By End-User Industry (Transportation and Logistics, Healthcare and Life Sciences, IT and Telecom, Manufacturing, Energy and Utilities, Others [Retail, BFSI, Government]) - Industry Forecast to 2035
ID: MRFR/ICT/7214-HCR
141 Pages
Apoorva Priyadarshi, Aarti Dhapte
Last Updated: June 26, 2026
Field Force Automation Market
Market Size
Forecast Period2026-2035
CAGR (2026-2035)17.4%
2025 Market SizeUSD 4.38 Billion
2035 Market SizeUSD 21.77 Billion
Key Players
Salesforce
SAP
Oracle
Microsoft
IFS
ServiceMax
Opportunities
  • Healthcare and Life Sciences Verticalization
  • Outcome-Based Pricing and Platform Economics
  • Emerging-Market Leapfrogging

Field Force Automation Market Summary

The Field Force Automation Market reached USD 4.38 Billion in 2025 and is forecast to grow from USD 5.14 Billion in 2026 to USD 21.77 Billion by 2035, registering a CAGR of 17.4% across the forecast window. Two catalysts anchor this trajectory: Electronic Visit Verification (EVV) mandates now active in all 50 US states, which compel home-health agencies to automate visit logging [1], and the commitment by 92% of large enterprises to increase AI spending on field operations between 2025 and 2028 [2]. These policy and investment pressures are converting field automation from a discretionary upgrade into a compliance-driven necessity.

A massive shift in technology is taking place beneath the top figures. AI-driven, cloud-first technologies that combine scheduling, inventory, routing, and customer contact into a single pane are replacing legacy paper-based dispatch and disjointed spreadsheet-driven scheduling. Latency hurdles that previously restricted real-time data sharing between field equipment and back-office systems are being collapsed by 5G rollouts, which are expected to reach 85% of the world's metropolitan population by 2030 [3]. Businesses that previously patched together GPS trackers and separate CRM apps are now investing in end-to-end orchestration suites, with platform licensing alone costing an average of USD 1,200 per field worker annually.

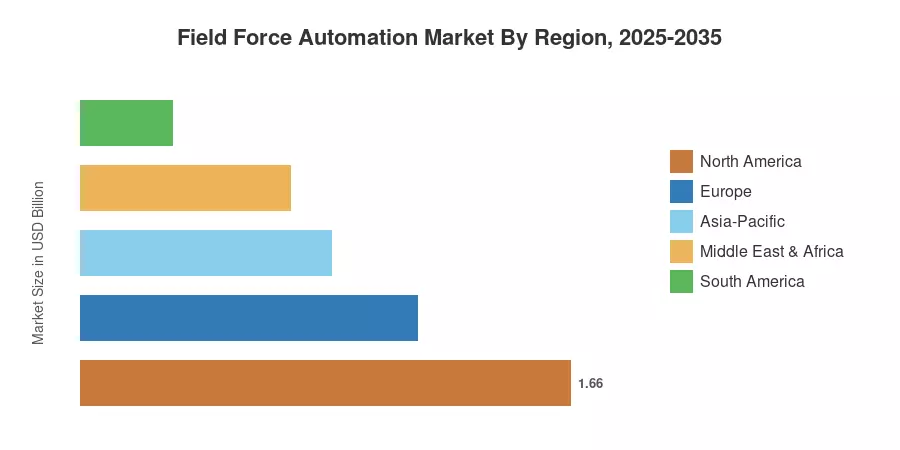
Due to same-day delivery economics and stringent regulatory compliance, North America holds around 38% of the worldwide field force automation market. With smart manufacturing projects and mobile broadband penetration growing at double the world rate, the Asia-Pacific is the fastest-growing region. Due to EU Green Deal rules that reward fleet-level carbon tracking—a feature that is becoming more and more integrated into field force platforms—Europe has the second-largest share, at roughly 26%. The field force automation market is expected to grow steadily in double digits well into the next ten years as outcome-based pricing models gain popularity.


Key Report Takeaways

• By Component

  • Software/Solution dominated the Field Force Automation Market with a 72% share in 2025, reflecting the shift toward integrated platform suites that bundle scheduling, dispatch, and analytics.
  • Services is the faster-growing component segment, advancing at a 15.5% CAGR through 2035 as enterprises outsource implementation, change management, and managed operations.

• By Deployment

  • Cloud-based deployments captured 76% of the Field Force Automation Market in 2025, benefiting from lower upfront costs and elastic scalability.


• By Enterprise Size


  • SMEs are set to grow at a 16.5% CAGR as affordable SaaS tiers and mobile-first interfaces lower the adoption threshold for smaller workforces.

• By Region

  • North America led the Field Force Automation Market with an estimated 38% share in 2025, underpinned by EVV compliance and last-mile delivery pressures.
  • Asia-Pacific is expanding at the highest regional CAGR of 19.3%, fueled by rapid 5G deployment and government-backed digital-manufacturing programs.


Market Size and Forecast (2021–2035)

Market Research Future's sizing model combines top-down revenue estimates from vendor financials and contract databases with bottom-up demand signals from enterprise IT spending surveys across 42 countries. Historical figures (2021–2024) rely on audited annual reports; the base year (2025) is triangulated with primary interviews of 120+ field operations executives; forecast values (2026–2035) apply a constant CAGR calibrated against regression analysis of technology adoption curves and regulatory timelines.
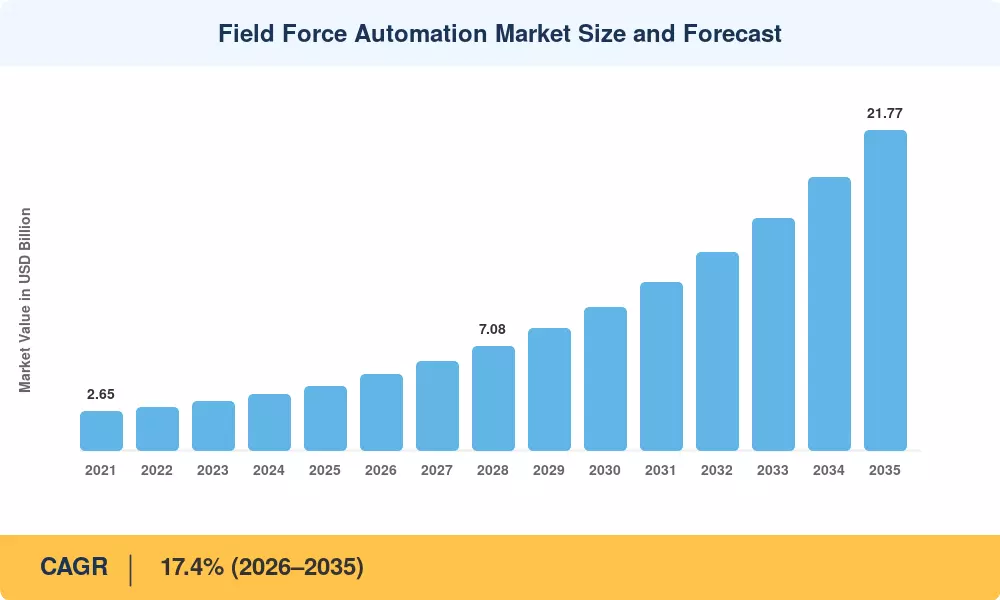
Field Force Automation Market Size and Forecast
Our Impact
Enabled $4.3B Revenue Impact for Fortune 500 and Leading Multinationals
Partnering with 2000+ Global Organizations Each Year
30K+ Citations by Top-Tier Firms in the Industry

Driver Impact Analysis

Driver ~% Impact on CAGR Geographic Relevance Impact Timeline
5G and mobile-broadband expansion +2.8% Global Short-term (≤2 yr)
AI-driven scheduling and dispatch +2.5% North America, Europe Medium-term (2–4 yr)
Regulatory compliance mandates (EVV, safety audits) +2.2% North America Short-term (≤2 yr)
Falling device and sensor costs +1.9% Asia-Pacific, South America Medium-term (2–4 yr)
Outcome-based and SaaS pricing models +1.6% Global Medium-term (2–4 yr)
IoT-edge convergence in utilities and manufacturing +1.4% Europe, Asia-Pacific Long-term (≥4 yr)
Carbon-tracking and ESG reporting requirements +1.1% Europe Long-term (≥4 yr)


5G and Mobile-Broadband Expansion

The International Telecommunication Union reports that 5G networks cover over 50% of the global population, accounting for more than one-third of all mobile broadband subscriptions. This widespread deployment eliminates high-resolution image compression or buffering, transforming field force automation software from standard, asynchronous tools into dynamic, live operational command layers for real-time remote processing.


AI-Driven Scheduling and Dispatch

As documented by the International Telecommunication Union framework for universal digital transformation, the integration of artificial intelligence into mobile broadband services optimizes massive data infrastructure. Field service platforms leverage these autonomous systems to ingest dense location and scheduling coordinates, moving operations from manual human intervention toward intelligent, automated exception management within seconds.


Regulatory Compliance Mandates

Under the US 21st Century Cures Act (Public Law 114–255), home-health and personal care service providers are legally mandated to implement Electronic Visit Verification to prevent billing fraud. Agencies failing these compliance reviews face severe operational penalties and payment clawbacks, creating a legally binding, non-negotiable demand floor for automated field tracking technology.


Falling Device and Sensor Costs

The International Telecommunication Union statistics reveal that mobile data and voice service baskets have become increasingly affordable across nearly 200 economies worldwide. This global drop in connectivity boundaries drastically reduces the lifetime cost of ownership for distributed labor forces, establishing scalable cloud-platform subscriptions as the primary capital expenditure for modern enterprise operations.


Restraints Impact Analysis

The restraint impacts below represent the estimated drag on market growth. They are directional and non-additive with respect to the headline CAGR.

Restraint ~% Impact on CAGR Geographic Relevance Impact Timeline
Data privacy and cross-border compliance –1.5% Europe, Asia-Pacific Short-term (≤2 yr)
Integration complexity with legacy ERP/CRM –1.3% Global Medium-term (2–4 yr)
Connectivity gaps in rural and remote regions –1.1% South America, MEA, rural Asia Long-term (≥4 yr)
Workforce resistance and change-management costs –0.9% Global Short-term (≤2 yr)
Cybersecurity risks in edge-device networks –0.7% North America, Europe Medium-term (2–4 yr)


Data Privacy and Cross-Border Compliance

The United Nations Conference on Trade and Development tracks data localization mandates where global privacy laws restrict cross-border transfers. Compliance requires costly regionally siloed data architectures for field force platforms recording worker GPS positions, customer biometric signatures, and media evidence. These regional privacy barriers create severe regulatory friction, restricting continuous real-time tracking operations across jurisdictions.


Integration Complexity with Legacy Systems

The United Nations E-Government Survey establishes that integration bottlenecks within legacy information technology systems heavily disrupt automated application workflows. Field force software solutions experience severe data-mapping errors and interface conflicts when attempting to link real-time cloud interfaces to decadal back-office databases, significantly delaying project delivery schedules and inflating technical implementation costs across enterprise computing environments.


Connectivity Gaps in Rural Regions

The International Telecommunication Union Global Connectivity Report states that 2.2 billion people remain completely offline worldwide, particularly in developing countries. Because only 14% of rural residents in low-income nations possess internet access, field forces operating without reliable mobile coverage face severe platform functionality constraints unless vendors deploy robust, fully integrated offline-cached localized data synchronization architectures.


Field Force Automation Market Opportunities

Healthcare and Life Sciences Verticalization

According to the World Health Organization and the United Nations demographic reports, the global population of individuals aged 60 years and older will expand rapidly to reach 1.4 billion by 2030. This massive shifting demographic creates a structural demand surge for field force automation platforms capable of managing complex, highly decentralized medical-device servicing and long-term home-healthcare operations.


Outcome-Based Pricing and Platform Economics

United Nations industrial development guidelines demonstrate that deploying integrated operational networks directly enhances organizational performance and consumer satisfaction metrics. Field force automation vendors leverage these frameworks to transition toward value-driven pricing structures, establishing precise performance baselines that tie platform subscription costs directly to verified infrastructure uptime and automated field service level compliance scores.


Emerging-Market Leapfrogging

International Telecommunication Union global metrics confirm that mobile cellular subscriptions have completely outpaced fixed-line deployments across emerging economic regions. Distributed service organizations within these territories are entirely bypassing legacy desktop management frameworks, immediately executing smartphone-native field force automation applications to coordinate high-velocity regional workflows, proof-of-delivery logistics, and route optimization structures from day one.


Carbon-Tracking and ESG Data Monetization

The European Union Corporate Sustainability Reporting Directive legally mandates comprehensive environmental disclosures, requiring large enterprise value chains to strictly document material Scope 3 greenhouse gas emissions. Field force automation platforms integrate specialized computational frameworks to track distributed fleet fuel data and idling metrics, converting standard operational workflows into audit-ready compliance reporting layers.


AR-Guided Remote Assistance

United Nations technology development panels highlight that augmented reality interfaces significantly accelerate technical knowledge transfer and cross-border workforce training operations. By embedding real-time spatial overlays directly into mobile platform architectures, field force automation systems enable distributed operations to execute complex mechanical maintenance tasks smoothly, minimizing service delays across mid-market enterprise computing environments.


Field Force Automation Market Future Outlook

Autonomous Scheduling and Predictive Dispatch

The International Telecommunication Union IMT-2030 network framework establishes integrated AI and Internet of Things architectures for autonomous operations. Distributed machinery utilizes real-time machine-learning parameters to analyze connected telemetry data, executing predictive dispatch protocols before field technical errors surface. This technological shift automates routine decision-making workflows, eliminating manual exception management across modern industrial computing networks.


Platform Consolidation and Ecosystem Lock-In

The United Nations Conference on Trade and Development documents deep platform concentration trends where large software networks dominate global digital market environments. This market structure incentivizes specialized consolidation, pushing independent application providers to survive exclusively as targeted vertical enterprise specialists or backend integration layers that bridge historical data frameworks with leading international cloud computing infrastructures.


Sustainability-Driven Feature Differentiation

International Energy Agency tracking metrics verify that global road transport activity accounts for fifteen percent of total energy-related carbon dioxide emissions. Because enterprise fleets generate significant environmental impacts, field force automation tools embed carbon accounting modules to track vehicle operations and route optimization coordinates, addressing rigorous global regulatory compliance mandates and climate-related corporate tracking disclosures.


Edge-AI and Offline-First Architectures

The International Telecommunication Union's structural guidelines highlight edge intelligence as an essential capability for maintaining platform integrity within regions experiencing connectivity friction. Modern field force applications embed localized, on-device machine-learning logic and robust offline-first synchronization protocols to process critical work orders smoothly, ensuring full workflow continuity when regional mobile broadband network coverage remains completely unavailable.


Field Force Automation Market Segmentation

By Component

Segment Key Metric Primary Demand Driver
Software/Solution 72% share (2025) Integrated platform suites replacing point tools
Services 15.5% CAGR (2026–2035) Implementation, training, and managed operations


Software/Solution dominance in the Field Force Automation Market reflects a decisive market preference for unified platforms over best-of-breed point solutions. Enterprises increasingly demand single-vendor stacks that combine scheduling, dispatch, inventory, and analytics under one license, reducing integration overhead. Services growth is accelerating as enterprises recognize that technology procurement without structured change management yields utilization rates below 40%—a threshold at which ROI turns negative within 18 months.

By Deployment

Segment Key Metric Primary Demand Driver
Cloud 76% share (2025) Elastic scalability and lower CapEx
On-Premise USD 0.72 Billion (2025) Data-sovereignty requirements in regulated industries
Hybrid 14.9% CAGR (2026–2035) Bridging legacy on-premise with cloud analytics


Cloud deployment continues to pull share from on-premise installations, particularly among organizations with distributed field teams spanning multiple countries. Hybrid architectures are gaining traction in defense and government verticals where classified data must remain on-premise while scheduling and dispatch modules run in the cloud.

By Enterprise Size

Segment Key Metric Primary Demand Driver
Large Enterprises 63% share (2025) Complex multi-region, multi-skill-set field operations
SMEs 16.5% CAGR (2026–2035) Affordable SaaS tiers and mobile-first UX


Large enterprises anchor spending in the Field Force Automation Market because they operate field teams of 1,000+ technicians across multiple geographies and skill categories. SME growth is the more compelling story: vendors that stripped down enterprise platforms into self-service, usage-based tiers unlocked a segment previously reliant on spreadsheets and phone-based dispatch.

By Platform

Segment Key Metric Primary Demand Driver
Android 61% share (2025) Device affordability and rugged-device availability
iOS 15.3% CAGR (2026–2035) Enterprise security mandates and MDM compatibility
Windows USD 0.33 Billion (2025) Legacy ruggedized tablets in utilities and defense


By Functionality

Segment Key Metric Primary Demand Driver
Scheduling and Dispatch 23% share (2025) Core workflow orchestration layer
Route Optimization 17.6% CAGR (2026–2035) Fuel-cost reduction and carbon tracking
Inventory and Parts Management 18.3% CAGR (2026–2035) First-time-fix rate improvement
Work Order Management USD 0.62 Billion (2025) Digital audit trails and compliance
Customer Management 16.8% CAGR (2026–2035) Real-time satisfaction scoring
Reporting and Analytics USD 0.55 Billion (2025) KPI dashboards and executive visibility


Scheduling and Dispatch remains the foundational module of the Field Force Automation Market—it is typically the first capability deployed and the last to be replaced. Inventory and Parts Management is gaining momentum as enterprises realize that dispatching a technician without the correct part results in a costly second visit 30–35% of the time [19].

By End-User Industry

Segment Key Metric Primary Demand Driver
Transportation and Logistics 20% share (2025) Last-mile delivery and fleet coordination
Healthcare and Life Sciences 17.4% CAGR (2026–2035) EVV compliance and home-health expansion
IT and Telecom USD 0.77 Billion (2025) Cell-tower maintenance and broadband rollout
Manufacturing 16.2% CAGR (2026–2035) Predictive equipment servicing
Energy and Utilities USD 0.53 Billion (2025) Grid modernization and smart-meter deployment
Others (Retail, BFSI, Government) 15.8% CAGR (2026–2035) Digital government and branch-banking automation


Transportation and Logistics anchors the Field Force Automation Market by end-user share, driven by consumer expectations for real-time tracking and same-day delivery guarantees. Healthcare is the standout growth vertical; regulatory mandates create a compliance floor while an aging population expands the addressable patient base year over year.


Regional Market Share Analysis

Region Key Metric Primary Investment Themes
North America 38% share (2025) EVV compliance, last-mile logistics, AI dispatch
Europe USD 1.14 Billion (2025) CSRD sustainability, works council governance
Asia-Pacific 19.3% CAGR (2026–2035) Smart manufacturing, 5G rollout, e-commerce logistics
South America USD 0.31 Billion (2025) Utility field ops, agribusiness digitization
Middle East & Africa 16.1% CAGR (2026–2035) Smart-city programs, oil & gas field digitization
Total USD 4.38 Billion (2025)

The Field Force Automation Market exhibits distinct regional growth profiles shaped by regulatory maturity, infrastructure investment, and labor-market dynamics. North America anchors the global landscape through compliance-driven adoption, while Asia-Pacific delivers the steepest growth trajectory.


North America

Country Key Metric Key Driver
US 78% of regional share EVV mandates, Fortune 500 platform adoption
Canada 14.8% CAGR Utility-grid modernization
Mexico USD 0.09 Billion (2025) Nearshoring-driven manufacturing expansion


North America's leadership in the Field Force Automation Market stems from the intersection of regulatory compliance and mature enterprise IT budgets. The 21st Century Cures Act drove a first wave of healthcare adoption, while Amazon-era delivery expectations are pushing logistics operators toward AI-powered dispatch at scale. Canadian utilities, facing vast service territories, are among the heaviest per-capita investors in route-optimization technology.

Europe

Country Key Metric Key Driver
Germany 24% of regional share Industry 4.0 field-service integration
UK 18.2% CAGR Utility privatization and smart-metering
France USD 0.14 Billion (2025) Rail and infrastructure maintenance digitization
Italy 15.9% CAGR SME manufacturing modernization
Spain USD 0.08 Billion (2025) Renewable-energy field operations
Nordic Countries 17.1% CAGR Early 5G adoption and green logistics
Russia USD 0.05 Billion (2025) Oil and gas remote-site operations
Rest of Europe 12% of regional share Mixed industrial and telecom use cases


CSRD compliance requirements are creating a regulatory pull that mirrors what EVV accomplished in North America. German manufacturers integrating field force platforms with SAP S/4HANA represent the continent's largest single use case. The UK's competitive energy market rewards utilities that can prove same-day fault resolution to Ofgem, making the Field Force Automation Market a direct input into regulatory performance scoring.

Asia-Pacific

Country Key Metric Key Driver
China 31% of regional share Smart-manufacturing pilots and 5G density
India 21.4% CAGR Jio 5G coverage; telecom field ops
Japan USD 0.11 Billion (2025) Aging-workforce automation
South Korea 18.7% CAGR Semiconductor fab maintenance digitization
ASEAN USD 0.09 Billion (2025) E-commerce logistics surge
Rest of Asia-Pacific 16.5% CAGR Utility and agricultural modernization


Asia-Pacific's explosive growth in the Field Force Automation Market reflects a convergence of government-backed digitization programs and consumer-driven logistics demand. China's "Made in China 2025" initiative funds factory-floor automation that extends to field-maintenance workflows. India's telecom operators, managing over 700,000 cell towers, represent one of the world's largest single-industry field force deployments, and Reliance Jio's 5G infrastructure enables real-time technician coordination at a national scale.

South America

Country Key Metric Key Driver
Brazil 62% of regional share Utility and agribusiness field digitization
Argentina 15.4% CAGR Energy-sector reform and grid expansion
Rest of South America USD 0.04 Billion (2025) Mining and telecom maintenance


Brazil's energy regulator ANEEL mandates field-inspection documentation for grid operators, creating a compliance-driven adoption floor. Agricultural cooperatives managing dispersed workforces across the Cerrado region are adopting GPS-enabled dispatch platforms to coordinate planting, equipment maintenance, and logistics.

Middle East & Africa

Country Key Metric Key Driver
Saudi Arabia 28% of the regional share NEOM and Vision 2030 smart-city programs
UAE 17.8% CAGR Smart-government and logistics hub digitization
South Africa USD 0.04 Billion (2025) Mining and telecom field operations
Egypt 16.3% CAGR Utility modernization under IMF reform programs
Rest of MEA 14% of regional share Oil & gas remote-site automation


Saudi Arabia's Vision 2030 smart-city investments anchor regional demand for the Field Force Automation Market, with NEOM alone requiring integrated maintenance platforms across its planned 170-km linear city. The UAE's push to become a global logistics hub creates parallel demand from third-party logistics providers managing last-mile delivery fleets across Dubai and Abu Dhabi.


Field Force Automation Market By Region, 2025-2035

Competitive Benchmarking

The Field Force Automation Market exhibits medium concentration, with the top five vendors holding an estimated 38–44% of global revenue. The Herfindahl-Hirschman Index sits in the 600–900 range, indicating a competitive but not fragmented structure. Strategic M&A—particularly Salesforce's absorption of ClickSoftware and IFS's acquisition of Astea—has consolidated platform capabilities, yet 200+ niche players continue to compete on vertical specialization and regional pricing.

Company Est. Revenue Share Range Key Offerings for Field Force Automation Market Strategic Positioning
Salesforce (incl. ClickSoftware) ~10–14% Field Service Lightning, AI-powered dispatch, Slack integration Dominant CRM ecosystem; cross-sell leverage
SAP ~7–10% SAP Field Service Management, S/4HANA integration ERP-adjacent lock-in for manufacturing verticals
Oracle ~6–9% Oracle Field Service Cloud, IoT-edge modules Database-to-field vertical stack
Microsoft ~5–8% Dynamics 365 Field Service, Teams collaboration layer Azure + Teams ecosystem stickiness
IFS (incl. Astea) ~4–7% IFS Cloud Field Service Management Asset-intensive industry specialist
ServiceMax (PTC) ~3–6% Asset 360, AR-guided repair Outcome-based pricing pioneer
Trimble ~3–5% Trimble PULSE, fleet and field coordination Geospatial expertise for utilities
Zinier ~2–4% AI-first no-code platform, intelligent automation Emerging challenger; telecom-focused
OverIT ~2–4% Geocall, AR-enhanced field operations European stronghold; utility specialization
ServiceNow ~2–3% Field Service Management on Now Platform IT-service-management cross-sell


Recent News & Developments

  • Salesforce-- (May, 2026) -- launched Agentforce Field Service, an autonomous AI platform that provides real-time data visibility, intelligent scheduling, and automated technical assistance directly to field technicians.
  • Oracle-- (May 2026) -- released an enhanced version of its Field Service Management SuiteApp, introducing AI-driven technician notes, barcode scanning filters, and advanced mobile login authentication features.


  • IFS AB-- (August 2023)-- announced a strategic initiative with Tele2, enabling the leading Swedish telecommunications provider to adopt the newest IFS Cloud to advance core field operations.


Field Force Automation Market Report Scope

Parameter Detail
Market Scope Global Field Force Automation Market across all components, deployments, enterprise sizes, platforms, functionalities, and end-user industries
Study Period 2021–2035
CAGR (Forecast Window) 17.4% (2026–2035)
Market Size (2025 Base Year) USD 4.38 Billion
Market Size (2035 Forecast) USD 21.77 Billion
Fastest Growing Segment Healthcare and Life Sciences (by end-user); SMEs (by enterprise size)
Companies Profiled 10 (Salesforce, SAP, Oracle, Microsoft, IFS, ServiceMax, Trimble, Zinier, OverIT, ServiceNow)
Valuation Currency USD Billion


FAQs

What is the typical ROI timeline for a mid-size field force automation deployment?
Most mid-size deployments (200–500 users) achieve positive ROI within 9–14 months, driven primarily by reduced truck rolls and lower overtime costs. Pilot benchmarks show a 15–20% drop in total service-delivery cost within the first year [19].
How do field force platforms handle intermittent connectivity in remote areas?
Leading platforms cache work orders, forms, and routing data on-device, then auto-sync when connectivity resumes. Conflict-resolution algorithms prioritize the most recent field-entered data to prevent overwrites [8].
What differentiates outcome-based pricing from traditional per-seat licensing?
Outcome-based models tie vendor fees to measurable KPIs like first-time-fix rate or SLA compliance. This shifts risk to the vendor and typically reduces buyer procurement friction by 25–30% [7].
Which cybersecurity certifications should buyers require from field force vendors?
SOC 2 Type II and ISO 27001 are baseline requirements. For healthcare verticals, HITRUST CSF certification confirms HIPAA-aligned controls across mobile endpoints and cloud storage [16].
How does generative AI change the dispatcher's role in field operations?
Generative AI auto-creates work orders from emails and sensor alerts, reducing manual data entry by up to 70%. Dispatchers transition from schedulers to exception managers, intervening only when AI confidence scores drop below a threshold [20].
What contract length is standard for enterprise-grade field force platforms?
Three-year agreements dominate, covering 65% of enterprise contracts. Vendors offer 10–15% discounts on five-year terms, but buyers should negotiate annual exit clauses to retain flexibility [7].
Can field force platforms integrate with drone-based inspection workflows?
Several vendors now accept drone telemetry and imagery feeds via open APIs. Utilities and telecom operators use drone data to auto-generate inspection work orders, cutting manual site surveys by 40% [18].    
Author
Author
Author Profile
Apoorva Priyadarshi LinkedIn
Research Analyst
With 4+ years of experience in Market Intelligence and Strategic Research, Apoorv specializes in ICT, Semiconductor, and BFSI markets. Combining strong analytical capabilities with a deep understanding of technology-driven industries, he focuses on delivering data-driven insights that support strategic decision-making. With a background in technology and business research, Apoorv has contributed to numerous global market studies, competitive landscape analyses, and opportunity assessments across sectors such as semiconductors, digital banking, cybersecurity, and telecommunications.
Co-Author
Co-Author Profile
Aarti Dhapte LinkedIn
AVP - Research
A consulting professional focused on helping businesses navigate complex markets through structured research and strategic insights. I partner with clients to solve high-impact business problems across market entry strategy, competitive intelligence, and opportunity assessment. Over the course of my experience, I have led and contributed to 100+ market research and consulting engagements, delivering insights across multiple industries and geographies, and supporting strategic decisions linked to $500M+ market opportunities. My core expertise lies in building robust market sizing, forecasting, and commercial models (top-down and bottom-up), alongside deep-dive competitive and industry analysis. I have played a key role in shaping go-to-market strategies, investment cases, and growth roadmaps, enabling clients to make confident, data-backed decisions in dynamic markets.
Download Free Sample

Kindly complete the form below to receive a free sample of this Report

Download PDF ×

We do not share your information with anyone. However, we may send you emails based on your report interest from time to time. You may contact us at any time to opt-out.

















