Freight and Logistics Market (2026 - 2035)

Freight and Logistics Market Research Report Information by Shipping Type (Airways, Railways, Roadways, and Waterways), Service (Inventory Management, Packaging, Warehousing, Transportation, Distribution, Customs Clearance, and other), End-Use Industry (Energy & Utilities, Trade and Transportation, Government and Public Utilities, Healthcare, Manufacturing & Construction, Retail, Media and Entertainment, Banking and Financial Services and Telecommunication & Information Technology) And By Region – Market Forecast Till 2035.
ID: MRFR/PCM/7226-HCR
107 Pages
Snehal Singh
Last Updated: July 06, 2026
Freight and Logistics Market
Market Size
Forecast Period2026-2035
CAGR (2026-2035)5.28%
2025 Market SizeUSD 6.81 Trillion
2035 Market SizeUSD 11.39 Trillion
Key Players
DHL Group
Kuehne + Nagel International AG
DSV A/S
UPS Supply Chain Solutions
FedEx Corporation
A.P. Moller-Maersk
Opportunities
  • Autonomous and Semi-Autonomous Trucking Corridors
  • Data Monetization Through Visibility Platforms
  • Emerging-Market Warehouse Build-Out

Freight and Logistics Market Summary

The Freight and Logistics Market stood at USD 6.81 trillion in 2025 and is projected to reach USD 7.17 trillion by 2026 before climbing to USD 11.39 trillion by 2035 at a 5.28% CAGR during the 2026–2035 forecast window. Two structural catalysts underpin this trajectory: first, global merchandise trade volumes have rebounded past pre-pandemic peaks, with the WTO estimating a 3.3% annual expansion in goods trade through the late 2020s [1]; second, governments across Asia and the Middle East are channeling over USD 1.4 trillion into port, highway, and rail corridor investments during the current decade, creating fresh capacity that pulls freight volumes upward [2].

Technology is altering the cost equation in the Freight & Logistics Market. Autonomous yard-management systems, real-time visibility platforms and AI-driven demand sensing are replacing human warehouse picking and legacy paper-based customs clearance. forecasts that the digitization of logistics operations can lower total landing costs by 15–25% . The EU’s new Combined Transport Directive, which extends intermodal shift incentives through 2030 [4], is further bolstering that policy push.

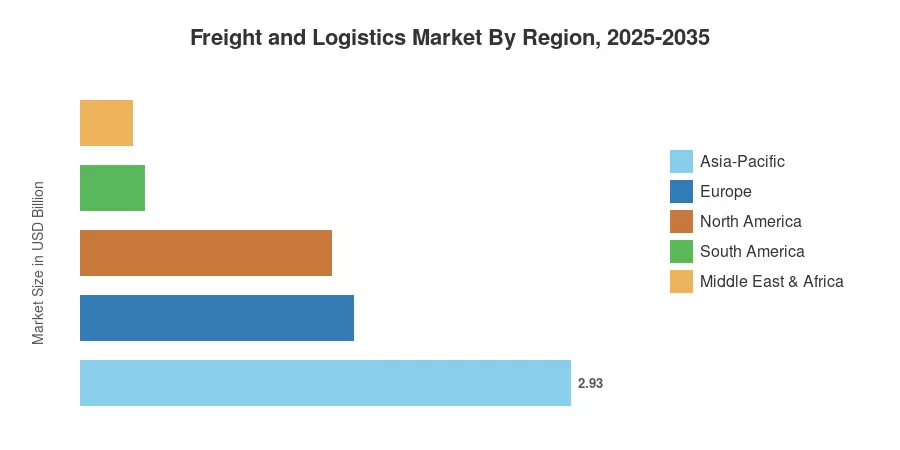
Asia-Pacific holds almost 43% of the Freight and Logistics Market share, owing to the Belt and Road corridors of China and the Gati Shakti infrastructure scheme of India. The region registers a CAGR of 5.92%, which is the fastest. Europe is second at 24%, supported by intra-EU trade density. North America is at 22% buoyed by nearshoring tailwinds changing U.S.-Mexico freight lines. The next decade will depend on how fast operators can transform capital-intensive physical networks into platform-orchestrated, data-rich ecosystems.

Key Report Takeaways

• By Logistics Function

  • Freight Transport accounted for 56.8% of the Freight and Logistics Market in 2025, reflecting the dominant share of line-haul road, rail, and ocean movements.
  • Freight Forwarding is on track to record a 5.58% CAGR through 2035 as cross-border complexity drives demand for intermediary coordination.
  • Warehousing and Storage reached USD 680 billion in 2025, fueled by e-commerce fulfillment center expansion.

• By End User Industry

  • Wholesale and Retail Trade captured 30.8% of the Freight and Logistics Market in 2025, reflecting omnichannel supply chain investment.
  • Manufacturing is projected to grow at a 5.55% CAGR as reshoring and regionalization increase inbound raw-material flows.

• By Geography

  • Asia-Pacific leads the Freight and Logistics Market at an estimated 43% share, backed by sustained infrastructure spending across China, India, and ASEAN.
  • North America contributes roughly USD 1.50 trillion in 2025, with nearshoring driving cross-border volumes along the U.S.–Mexico corridor.


Freight and Logistics Market Size and Forecast (2021–2035)

Market Research Future (MRFR) projections are based on personal interviews with 350+ freight operators, forwarders and shippers and secondary research from national statistics bureaus, trade associations & regulatory filings. Historical statistics (2021-2024) are actuals; 2025 is the calibrated base year; 2026-2035 values are using a constant CAGR model that was validated against bottom-up segment estimates.
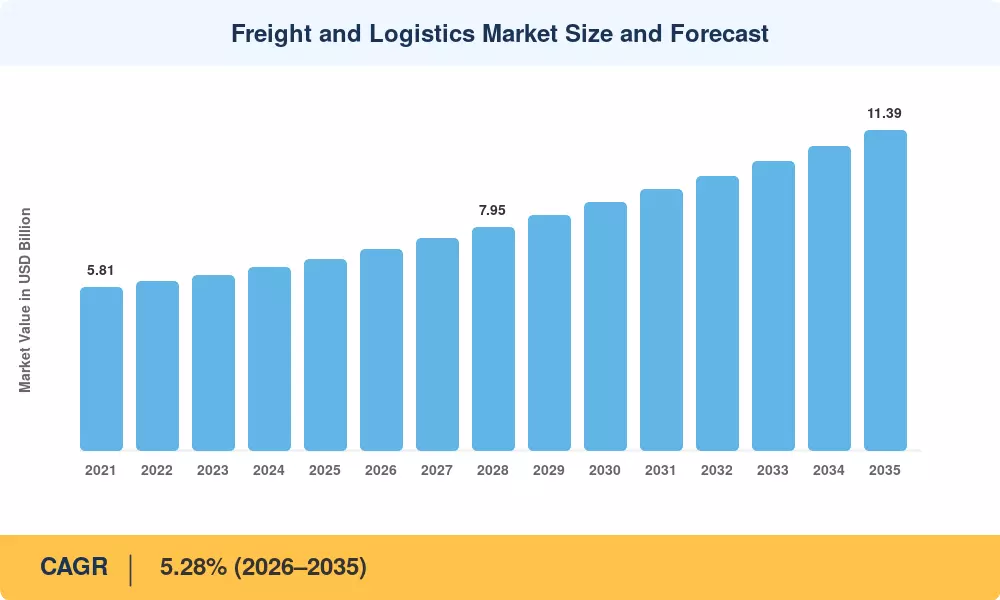
Freight and Logistics Market Size and Forecast
Our Impact
Enabled $4.3B Revenue Impact for Fortune 500 and Leading Multinationals
Partnering with 2000+ Global Organizations Each Year
30K+ Citations by Top-Tier Firms in the Industry

Driver Impact Analysis

Driver ~% Impact on CAGR Geographic Relevance Impact Timeline
E-commerce parcel volume surge +0.95 Global Short-term (≤2 yr)
Infrastructure modernization programs +0.80 Asia-Pacific, MEA Long-term (≥4 yr)
Cross-border CEP demand growth +0.55 Europe, Asia-Pacific Medium-term (2–4 yr)
Public-private logistics park investments +0.45 Asia-Pacific, South America Long-term (≥4 yr)
Cold-chain expansion for pharma and food +0.40 North America, Europe Medium-term (2–4 yr)
Digital freight matching platforms +0.35 North America, Europe Short-term (≤2 yr)
Nearshoring and friend-shoring trade realignment +0.30 North America, Asia-Pacific Medium-term (2–4 yr)


E-Commerce Parcel Volume Surge

Global e-commerce sales crossed USD 6.3 trillion in 2024, and projects they will surpass USD 8 trillion by 2027 . Every incremental USD 1 billion in online retail spending generates an estimated 12–15 million additional parcel shipments annually, loading last-mile and middle-mile networks. This volume pressure is pushing carriers to expand automated sortation capacity and micro-fulfillment footprints, directly enlarging the addressable Freight and Logistics Market.

Infrastructure Modernization Programs

India's PM Gati Shakti National Master Plan serves as a comprehensive framework for multi-modal connectivity, integrating infrastructure projects with a total estimated investment value of over USD 1.2 trillion. Similarly, China continues to prioritize "New Infrastructure" through state-directed programs, with multi-billion dollar commitments targeting smart ports, high-speed rail freight, and AI-integrated logistics hubs. These investments are instrumental in reducing transit times and lowering logistics costs, unlocking previously underserved inland regions across the Asia-Pacific.


Cross-Border CEP Demand Growth

The Universal Postal Union recorded 22% growth in international small-packet volumes between 2022 and 2024 [6]. Regulatory simplification — such as the EU's Import One-Stop-Shop (IOSS) for VAT — is lowering friction for cross-border parcel flows. Express integrators are responding with dedicated international sort hubs and customs-bonded warehousing, expanding the forwarding and CEP segments within the Freight and Logistics Market.

Cold-Chain Expansion for Pharma and Food

The global Biopharma Cold-Chain Logistics market is entering a phase of sustained growth, with specialized logistics demand driven by the rise of temperature-sensitive biologics, cell therapies, and personalized medicine. With over 70% of modern biologics requiring strictly controlled cold-chain environments, investments are shifting toward high-tech refrigerated warehousing, real-time IoT monitoring, and specialized reefer fleets, adding a significant high-margin segment to the broader Freight and Logistics market.


Restraints Impact Analysis

The restraint impacts below are directional estimates of drag on growth momentum. They are not linearly subtracted from the headline CAGR.

Restraint ~% Impact on CAGR Geographic Relevance Impact Timeline
Chronic driver and labor shortages –0.50 North America, Europe Long-term (≥4 yr)
Fuel price volatility and energy transition costs –0.40 Global Medium-term (2–4 yr)
Regulatory fragmentation across borders –0.30 Europe, South America Long-term (≥4 yr)
Cybersecurity risks to digital freight platforms –0.20 Global Short-term (≤2 yr)
Port congestion and capacity bottlenecks –0.25 Asia-Pacific, North America Medium-term (2–4 yr)


Chronic Driver and Labor Shortages

The American Trucking Associations estimated a shortfall of 82,000 truck drivers in the U.S. alone by end-2024, with the gap projected to widen to 160,000 by 2031 [11]. Europe faces similar pressures, as the IRU reports that 40% of the continent's commercial drivers are over 55. Rising wages compress margins and slow fleet expansion, acting as a structural brake on growth within the Freight and Logistics Market.

Fuel Price Volatility and Energy Transition Costs

Diesel accounts for 30–40% of road freight operating costs. Brent crude price swings of over 25% year-on-year between 2022 and 2024 squeezed carrier profitability [12]. Simultaneously, the transition toward LNG, battery-electric, and hydrogen powertrains demands upfront capital that many mid-sized operators struggle to finance. These dual cost pressures temper the pace at which operators can reinvest in capacity expansion.

Regulatory Fragmentation Across Borders

Disparate customs procedures, cabotage restrictions, and divergent emissions standards increase compliance costs for cross-border operators. Within the EU, despite the Single Market, national transposition of the Mobility Package regulations has created uneven enforcement [13]. In South America, Mercosur's incomplete trade harmonization adds layers of documentation and delay. This friction limits the addressable Freight and Logistics Market for integrated cross-regional operators.


Freight and Logistics Market Opportunities

Autonomous and Semi-Autonomous Trucking Corridors

Regulatory sandboxes in Texas, Arizona, and Germany's A9 autobahn corridor are clearing the path for driverless line-haul operations. Aurora Innovation and Daimler Truck plan commercial autonomous services on the Dallas–Houston lane by 2027 [16]. Operators who secure early corridor permits can reduce per-mile labor costs by up to 40%, reshaping cost structures across the Freight and Logistics Market.

Data Monetization Through Visibility Platforms

Real-time shipment data — spanning ETA predictions, carrier performance scores, and carbon intensity metrics — carries standalone commercial value. Platforms like project44 and FourKites are selling anonymized benchmark datasets to shippers and insurers. This data-as-a-service model creates an adjacent revenue stream for logistics technology providers within the Freight and Logistics Market.

Emerging-Market Warehouse Build-Out

Sub-Saharan Africa and Southeast Asia remain significantly under-warehoused relative to GDP. The African Development Bank estimates the continent needs an additional 100 million sq ft of Grade-A warehouse space by 2030 [17]. Developers who combine pre-built modular facilities with solar microgrids can unlock rapid deployment cycles in the Freight and Logistics Market across these geographies.

Green Freight Financing Instruments

Green bonds earmarked for low-emission fleet conversions and energy-efficient warehouses raised USD 8.2 billion globally in 2024 [18]. The EU's Taxonomy Regulation now classifies zero-emission freight vehicles as "substantially contributing" activities, unlocking preferential capital. Operators who align fleet renewal timelines with green-bond issuance windows can lower their weighted cost of capital by 50–80 basis points.

Micro-Fulfillment and Urban Logistics Hubs

Cities from Paris to Jakarta are restricting heavy-vehicle access to central zones. Micro-fulfillment centers located inside urban perimeters — often repurposed retail or parking structures — enable same-day delivery using electric cargo bikes and light EVs. This shift creates a new sub-segment within the Freight and Logistics Market that blends warehousing with last-mile delivery.


Freight and Logistics Market Future Outlook

AI-Orchestrated Supply Networks

By 2030, generative AI and digital twins will shift logistics planning from reactive to anticipatory. projects that 45% of supply chain decisions will be autonomously executed by 2028 . Within the Freight and Logistics Market, AI-driven control towers will dynamically reroute shipments, match loads to capacity in real time, and compress planning cycles from days to minutes.

Platform Economics and Freight Marketplaces

Digital freight brokerages — Uber Freight, Convoy's technology successors, and Asia-based entrants like Blackbuck — are aggregating fragmented trucking capacity onto centralized platforms. By 2032, platform-intermediated loads could represent 30% of North American truckload volumes, reshaping pricing transparency and carrier-shipper dynamics across the Freight and Logistics Market [23].

Fleet Electrification and Alternative Fuels

The IEA's Global EV Outlook indicates that electric heavy-duty truck registrations will exceed 500,000 units annually by 2030 [24]. Concurrently, green-hydrogen refueling corridors are being piloted in Germany, the Netherlands, and California. These transitions will lower Scope-1 emissions for fleet operators while introducing new infrastructure dependencies that reshape capital allocation within the Freight and Logistics Market.

ESG Reporting and Scope-3 Transparency

The EU's Corporate Sustainability Reporting Directive (CSRD) requires large companies to disclose Scope-3 logistics emissions starting in 2026. This regulatory push will make carrier carbon performance a procurement criterion, rewarding low-emission operators with premium contract access. Shippers will increasingly select partners based on verified emissions intensity, creating competitive differentiation across the Freight and Logistics Market [25].


Freight and Logistics Market Segmentation

By Logistics Function

Segment Key Metric Primary Demand Driver
Freight Transport 56.8% share (2025) Road and rail line-haul volumes
Freight Forwarding 5.58% CAGR (2026–2035) Cross-border trade complexity
Courier, Express, and Parcel USD 820 B (2025) E-commerce parcel acceleration
Warehousing and Storage 5.62% CAGR (2026–2035) Fulfillment center build-out
Other Services ~4.2% share (2025) Value-added logistics and customs brokerage


Freight Transport remains the largest function within the Freight and Logistics Market, driven by massive road and ocean volumes that move bulk commodities and finished goods between production zones and consumption centers. Road freight alone captures roughly 59% of transport-mode revenue, though rail is gaining ground on long-haul inland routes where fuel efficiency gives it a 3:1 ton-mile cost advantage.

Courier, Express, and Parcel services represent the most dynamic function, with domestic parcels accounting for roughly 63% of CEP revenue and international services growing at the fastest clip. The rise of same-day and next-day delivery expectations is forcing CEP operators to invest in automated sorting hubs and decentralized fulfillment nodes, intensifying capital requirements but also expanding addressable revenue for the Freight and Logistics Market.

By End User Industry

Segment Key Metric Primary Demand Driver
Wholesale and Retail Trade 30.8% share (2025) Omnichannel retail and grocery delivery
Manufacturing 5.55% CAGR (2026–2035) Reshoring and inbound raw-material flows
Agriculture, Fishing, and Forestry USD 610 B (2025) Perishable cold-chain and bulk agri-exports
Construction ~12% share (2025) Infrastructure capex across Asia and MEA
Other Industries 4.90% CAGR (2026–2035) Healthcare, energy, and defense logistics


Wholesale and Retail Trade dominates end-user demand within the Freight and Logistics Market because the segment touches every node — from container drayage at ports through distribution centers to last-mile doorstep delivery. Retailers are increasingly contracting for end-to-end visibility, pushing logistics providers to offer track-and-trace dashboards alongside physical movement services.

Manufacturing's outsized growth rate reflects the global reorganization of production networks. As companies diversify sourcing away from single-country dependency, inbound freight complexity rises, requiring more sophisticated routing, bonded-warehouse staging, and just-in-sequence delivery to assembly lines.

By Freight Transport Mode

Segment Key Metric Primary Demand Driver
Road Freight ~59% share (2025) Door-to-door flexibility, short-haul dominance
Sea and Inland Waterways 5.78% CAGR (2026–2035) Containerized trade growth
Rail Freight USD 420 B (2025) Intermodal corridor investment
Air Freight ~5% share (2025) High-value, time-sensitive cargo


Road freight's dominance stems from its unmatched flexibility for first-mile and last-mile movements. Sea and inland waterways are the fastest-growing modes, reflecting expanding container-trade volumes across Asia-Pacific and the ongoing deepening of major transshipment ports.


Regional Market Share Analysis

Region Key Metric Primary Investment Themes
Asia-Pacific ~43% share (2025) Port automation, Belt and Road corridors, e-commerce fulfillment
Europe ~24% share (2025) Green Corridor programs, intermodal shift, single-market integration
North America USD 1.50 T (2025) Nearshoring, autonomous trucking, cold-chain
South America 5.52% CAGR (2026–2035) Agri-commodity exports, trade facilitation reform
Middle East & Africa USD 0.31 T (2025) Free-zone logistics hubs, mining freight corridors
Total USD 6.81 T (2025)

The Freight and Logistics Market exhibits strong regional variation tied to trade openness, infrastructure maturity, and domestic consumption patterns.


North America

Country Key Metric Key Driver
United States ~76% of regional share Nearshoring-led import surge, intermodal investment
Canada 5.15% CAGR Pacific Gateway corridor expansion
Mexico USD 92 B (2025) U.S.–Mexico cross-border manufacturing freight


The North American Freight and Logistics Market benefits from the USMCA trade framework, which has deepened cross-border supply chain integration. U.S. Class I railroads invested USD 25 billion in network maintenance and capacity additions during 2023–2024, while Mexico's Interoceánico Corridor is positioning the Isthmus of Tehuantepec as a Pacific-Atlantic land bridge alternative to the Panama Canal [19].

Europe

Country Key Metric Key Driver
Germany ~22% of regional share Manufacturing export logistics, Rhine-Danube corridor
United Kingdom 5.08% CAGR Post-Brexit customs digitization
France USD 185 B (2025) TGV Fret rail-freight revival
Italy ~11% of regional share Adriatic port gateway for Mediterranean trade
Spain 5.30% CAGR Iberian Peninsula intermodal growth
Nordic Countries USD 102 B (2025) Green shipping corridors
Russia ~8% of regional share East-bound rail freight rerouting
Rest of Europe 5.18% CAGR EU cohesion fund infrastructure projects


The European Freight and Logistics Market is shaped by the EU's Sustainable and Smart Mobility Strategy, which targets a 90% reduction in transport emissions by 2050. The European Commission allocated EUR 25.8 billion under the Connecting Europe Facility (2021–2027) for cross-border transport corridors, while the Fit for 55 package is driving fleet electrification mandates [4].

Asia-Pacific

Country Key Metric Key Driver
China ~38% of regional share Belt and Road, e-commerce, smart port investment
India 6.20% CAGR Gati Shakti, Dedicated Freight Corridors
Japan USD 275 B (2025) Labor-saving automation, high-value cold-chain
South Korea ~7% of regional share Semiconductor and EV battery logistics
ASEAN 6.05% CAGR Manufacturing FDI inflows, cross-border e-commerce
Rest of Asia-Pacific USD 145 B (2025) Mining and agri-commodity freight


The Asia-Pacific Freight and Logistics Market continues to outpace other regions, propelled by China's dual-circulation strategy and India's Dedicated Freight Corridor project, which will add 2,800 km of high-speed rail freight capacity by 2028 [2]. ASEAN's Regional Comprehensive Economic Partnership (RCEP) is lowering tariffs and harmonizing rules of origin, accelerating intra-regional freight flows.

South America

Country Key Metric Key Driver
Brazil ~52% of regional share Soy and mineral export corridors
Argentina USD 42 B (2025) Vaca Muerta energy logistics
Rest of South America 5.40% CAGR Andean mining and Pacific-coast port expansion


Brazil dominates the South American Freight and Logistics Market, though chronic underinvestment in road maintenance raises logistics costs to roughly 12% of GDP compared with 8% in the U.S. [20]. The Santos–Guarulhos logistics corridor is receiving BRL 14 billion in public and private capital for port deepening and road widening through 2029.

Middle East & Africa

Country Key Metric Key Driver
Saudi Arabia ~28% of regional share Vision 2030 logistics hub investments
UAE 4.95% CAGR Dubai and Abu Dhabi free-zone expansion
South Africa USD 48 B (2025) Mining freight and port rehabilitation
Egypt ~10% of regional share Suez Canal Economic Zone development
Rest of MEA 5.65% CAGR East African rail corridor projects


Saudi Arabia's NEOM and Oxagon logistics zones, backed by over USD 16 billion in committed investment, aim to create a next-generation freight hub linking Asian and European trade lanes [21]. In Sub-Saharan Africa, the African Continental Free Trade Area (AfCFTA) is expected to raise intra-African trade by 52% by 2030, generating significant new freight demand.


Freight and Logistics Market By Region, 2025-2035

Competitive Benchmarking

The Freight and Logistics Market is not concentrated in general. The market is fragmented with hundreds of thousands of players worldwide. The top five players jointly account for an estimated 12-16% of overall market income. Industry-level HHI is significantly below 500, a result of the vast range of service modalities, regions and customer sectors. But consolidation at the top has gathered pace – the 2024 acquisition of DB Schenker by DSV formed the world’s largest forwarder by revenue and suggests a scale-driven competitive dynamic among the global integrators.

Company Est. Revenue Share Range Key Offerings Strategic Positioning
DHL Group (Deutsche Post DHL) ~3.5–5.0% Express, freight forwarding, supply chain, e-commerce Global integrator with the widest geographic footprint
Kuehne + Nagel International AG ~1.8–2.5% Sea freight, air freight, contract logistics Premium forwarding leader focused on digital tools
DSV A/S (incl. Schenker) ~2.5–3.5% Road, air, sea freight, contract logistics Scale consolidator with the strongest M&A track record
UPS Supply Chain Solutions ~2.0–3.0% Parcel, LTL, healthcare logistics, forwarding U.S.-centric integrator expanding internationally
FedEx Corporation ~2.0–2.8% Express, ground, freight, trade networks Speed-focused network with a strong SME base
A.P. Moller-Maersk ~1.5–2.2% Ocean shipping, port terminals, inland logistics End-to-end ocean-to-door integration
XPO Inc. ~0.8–1.2% LTL, brokerage, last-mile North American LTL technology leader
C.H. Robinson Worldwide ~0.7–1.0% Freight brokerage, managed services Platform-led asset-light brokerage model
Nippon Express Holdings ~0.9–1.3% Air, ocean, road, warehousing Asia-focused with expanding European presence
J.B. Hunt Transport Services ~0.6–0.9% Intermodal, dedicated, brokerage U.S. intermodal pioneer leveraging rail partnerships


Recent News & Developments

  • DSV A/S (September 2024): Completed the EUR 14.3 billion acquisition of DB Schenker from Deutsche Bahn, creating the world's largest logistics company by forwarding revenue and reshaping competitive dynamics within the Freight and Logistics Market [10].


  • DHL Group (March 2024): Announced a EUR 2 billion investment in electrifying its European last-mile fleet, targeting 60% electric vans by 2030.


  • European Commission (January 2024): Adopted the Greening Freight Package, including updated Combined Transport Directive rules and CountEmissions EU methodology for standardized Scope-3 reporting [4].


  • India Ministry of Commerce (August 2023): Released the National Logistics Policy implementation roadmap, targeting a reduction in logistics cost from 14% of GDP to 8% by 2030 through unified digital platforms and multimodal connectivity.


Freight and Logistics Market Report Scope

Item Detail
Market Scope Global Freight and Logistics Market covering freight transport, forwarding, CEP, and warehousing
Study Period 2021–2035
CAGR (Forecast Period) 5.28% (2026–2035)
Base Year Market Size USD 6.81 Trillion (2025)
Forecast Year Market Size USD 11.39 Trillion (2035)
Fastest Growing Segment Sea and Inland Waterways (by freight transport mode)
Companies Profiled 10 (DHL, Kuehne + Nagel, DSV, UPS, FedEx, Maersk, XPO, C.H. Robinson, Nippon Express, J.B. Hunt)
Valuation Currency USD (Trillions / Billions)


FAQs

How does the freight contract structure differ between asset-based carriers and freight brokers?
Asset-based carriers offer capacity guarantees and fixed-lane pricing in exchange for volume commitments. Brokers provide flexible spot-market access but expose shippers to rate volatility during peak cycles.
What cybersecurity frameworks are logistics companies adopting to protect digital freight platforms?
Most large operators align with NIST CSF 2.0 and ISO 27001 for information security governance. Some carriers also pursue SOC 2 Type II certification to satisfy shipper vendor-qualification requirements [14].
How does Scope-3 emissions reporting change carrier selection for enterprise shippers?
CSRD mandates push shippers to weight carbon intensity alongside cost in procurement scorecards. Carriers offering verified per-shipment emissions data gain preferred-partner status [25].
What role do free-trade zones play in shaping the Freight and Logistics Market?
Free-trade zones like Dubai's JAFZA and China's Hainan FTP reduce tariff friction and consolidation costs. They attract regional distribution centers that concentrate freight volumes and boost forwarding activity [21].
How are insurance models evolving for autonomous freight operations in the Freight and Logistics Market?
Underwriters are shifting from driver-liability to product-liability frameworks for autonomous trucks. Parametric insurance tied to real-time telematics data is emerging as a pricing alternative [16].
What financing options exist for mid-sized carriers entering the Freight and Logistics Market's electric-fleet transition?
Green bonds, equipment-as-a-service leases, and government subsidy programs like the U.S. EPA Clean Truck Plan offer capital pathways. These instruments lower upfront cost barriers for fleet electrification [18].
How does the Freight and Logistics Market differ in asset-heavy versus asset-light business models?
Asset-heavy operators control trucks, warehouses, and terminals for service reliability. Asset-light platforms leverage technology to match demand with third-party capacity, trading margin for scalability.    
Author
Author
Author Profile
Snehal Singh LinkedIn
Manager - Research
High acumen in analyzing complex macro & micro markets with more than 6 years of work experience in the field of market research. By implementing her analytical skills in forecasting and estimation into market research reports, she has expertise in Packaging, Construction, and Equipment domains. She handles a team size of 20-25 resources and ensures smooth running of the projects, associated marketing activities, and client servicing.

Research Approach


Secondary Research

The secondary research process involved comprehensive analysis of trade databases, regulatory filings, transport statistics repositories, and authoritative logistics publications. Key sources included the US Department of Transportation (USDOT), Federal Motor Carrier Safety Administration (FMCSA), Federal Maritime Commission (FMC), Bureau of Transportation Statistics (BTS), European Commission Directorate-General for Mobility and Transport (DG MOVE), Eurostat Transport Database, International Transport Forum (ITF), World Trade Organization (WTO) Trade Statistics, UNCTAD Review of Maritime Transport, International Air Transport Association (IATA) Cargo Intelligence, International Maritime Organization (IMO) shipping statistics, World Bank Logistics Performance Index (LPI), and national customs authorities from key markets. These sources were used to collect freight volume data (ton-kilometers and TEU), modal split statistics, carrier fleet capacities, infrastructure investment figures, customs clearance metrics, and regulatory compliance frameworks across road freight, air cargo, maritime shipping, and rail logistics segments.

Additional industry sources included the Council of Supply Chain Management Professionals (CSCMP) State of Logistics Report, International Association of Logistics and Supply Chain Management (IALSCM) trade data, Warehousing Education and Research Council (WERC) benchmarking studies, American Trucking Associations (ATA) freight tonnage reports, Association of American Railroads (AAR) commodity statistics, and International Federation of Freight Forwarders Associations (FIATA) market intelligence. Peer-reviewed sources included the International Journal of Logistics Management, Journal of Business Logistics, Transportation Research Part E: Logistics and Transportation Review, and Supply Chain Management: An International Journal to gather insights on supply chain optimization, last-mile delivery innovations, cold chain logistics, and intermodal transportation trends.


Primary Research

Qualitative and quantitative insights were obtained by interviewing supply-side and demand-side stakeholders during the primary research process. CEOs, COOs, Presidents of Freight Operations, Heads of Fleet Management, Chief Commercial Officers from third-party logistics (3PL) providers, fourth-party logistics (4PL) integrators, freight forwarders, asset-based carriers, shipping lines, rail operators, and air cargo airlines, as well as Heads of Supply Chain Solutions from contract logistics providers, comprised supply-side sources. The demand-side sources comprised Chief Supply Chain Officers, Vice Presidents of Procurement, Global Logistics Directors, Distribution Center Managers, and Transportation Planning Leads from manufacturing conglomerates, retail chains, pharmaceutical companies, oil & gas majors, and automotive OEMs. The modal share segmentation was validated, infrastructure capacity expansion timelines were confirmed, and insights were gathered on freight rate contracting patterns, fuel surcharge mechanisms, digital freight brokerage adoption, and sustainability compliance costs through primary research.

Primary Respondent Breakdown:

• By Designation: C-level Primaries (32%), Director Level (35%), Others (33%)

• By Region: North America (32%), Europe (30%), Asia-Pacific (28%), Rest of World (10%)


Market Size Estimation

Global market valuation was derived through volume-tonnage mapping and revenue analysis across transportation modes. The methodology included:

• Identification of 50+ key freight carriers, logistics service providers, and integrated supply chain operators across North America, Europe, Asia-Pacific, Latin America, and Middle East & Africa

• Segment mapping across air freight (cargo ton-kilometers), ocean freight (TEU capacity), road freight (truckload and less-than-truckload volumes), and rail freight (carload and intermodal units)

• Analysis of reported and modeled annual revenues specific to freight forwarding, contract logistics, warehousing, and value-added service portfolios

• Coverage of logistics providers representing 75-80% of global freight and logistics market share in 2024

• Extrapolation using bottom-up (shipment volume × average freight rate by trade lane) and top-down (carrier revenue validation) approaches to derive modal-specific and service-specific valuations

Download Free Sample

Kindly complete the form below to receive a free sample of this Report

Download PDF ×

We do not share your information with anyone. However, we may send you emails based on your report interest from time to time. You may contact us at any time to opt-out.
















