Functional Safety Market (2026 - 2035)

Functional Safety Market Size, Share and Research Report By Device (Actuators, Safety Sensors, Final Control Elements, Safety Controllers, Modules, Relays & Programmable Safety Systems), By System (Safety Instrumented Systems, Turbo Machinery Control (TMC), Supervisory Control System, Burner Management Systems (BMS) & Emergency Shutdown Systems (ESD)), By End-Users (Oil & Gas, Metal & Mining, Pharmaceuticals & Biotech, Retail & Wholesale) And By Region (North America, Europe, Asia-Pacific, & Rest Of The World) –Industry Forecast Till 2035
ID: MRFR/SEM/2329-CR
131 Pages
Nirmit Biswas, Aarti Dhapte
Last Updated: June 30, 2026
Functional Safety Market
Market Size
Forecast Period2026-2035
CAGR (2026-2035)9.5%
2025 Market SizeUSD 7.61 Billion
2026 Market SizeUSD 8.33 Billion
2035 Market SizeUSD 18.86 Billion
Key Players
Siemens AG
Honeywell International
ABB Ltd
Schneider Electric
Emerson Electric
Rockwell Automation
Opportunities
  • Subscription-Based Safety-as-a-Service Models
  • Hydrogen and Battery Gigafactory Safety Infrastructure
  • Data Monetization Through Predictive Safety Analytics

Functional Safety Market Summary

The Functional Safety Market was valued at USD 7.61 Billion in 2025 and is projected to grow from USD 8.33 Billion  in 2026 to USD 18.86 Billion by 2035, registering a CAGR of 9.5% during the forecast period. Mandatory compliance with international standards such as IEC 61508 and the Seveso III Directive across chemical and petrochemical facilities has created non-discretionary demand for safety-instrumented systems, while ISO 26262 obligations tied to ADAS and electric vehicle architectures are pulling automotive OEMs into multi-year certification cycles [1][2].

A technology shift is underway as hardware-centric safety controllers give way to software-defined platforms capable of over-the-air parameter updates and cloud-hosted proof-test documentation. Industry 4.0 deployments are embedding SIL-rated logic solvers directly into distributed control architectures, collapsing what used to be standalone safety layers into integrated automation stacks. Global spending on smart manufacturing infrastructure exceeded USD 410 Billion in 2024, and a meaningful share of that capital is flowing into functional safety upgrades [3][4].

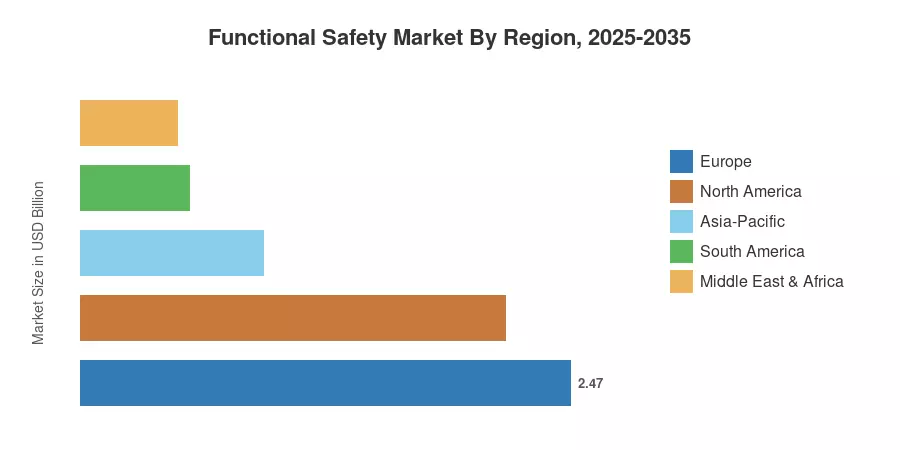
Europe retained the largest share of the Functional Safety Market at approximately 32.4% in 2025, anchored by stringent EU machinery and process safety directives. Asia-Pacific stands as the fastest-growing region with a projected 12.1% CAGR, driven by refinery and automotive plant expansions across China, India, and Southeast Asia. North America accounted for roughly 28.1% of global revenue, supported by OSHA process safety mandates and shale-sector modernization programs. As autonomous systems and AI-driven shutdown logic mature, the Functional Safety Market is poised for sustained double-digit expansion through the next decade [5][6].

Key Report Takeaways

• By Device Type

  • Safety sensors commanded approximately 31.4% of the Functional Safety Market in 2025, reflecting broad deployment across process and discrete manufacturing environments.
  • Programmable safety systems are forecast to expand at a 10.8% CAGR through 2035, fueled by software-defined controller adoption.

• By Safety System

  • Emergency shutdown systems represented roughly 30.4% of total revenue in 2025, driven by oil and gas regulatory requirements.
  • High-integrity pressure protection systems are projected to grow at a 10.9% CAGR, the fastest among safety system categories.

• By End-User Industry

  • Oil and gas contributed an estimated 31.7% of the Functional Safety Market in 2025, making it the single largest vertical.
  • Pharmaceuticals are expected to post a 10.8% CAGR through 2035 as batch-process validation standards tighten.

• By Region

  • Europe held the dominant position in the Functional Safety Market with 32.4% share in 2025.
  • Asia-Pacific is anticipated to register a 12.1% CAGR, outpacing all other regions.

Market Size and Forecast (2021–2035)

Market Research Future employs a triangulated methodology combining bottom-up revenue estimation from device and service line-items, top-down validation against industrial automation spending benchmarks, and qualitative inputs from safety engineering consultancies and certification bodies. Historical figures are calibrated against audited financial disclosures from leading suppliers, while forecast projections apply a regression-adjusted CAGR informed by capital expenditure cycles across end-user industries.
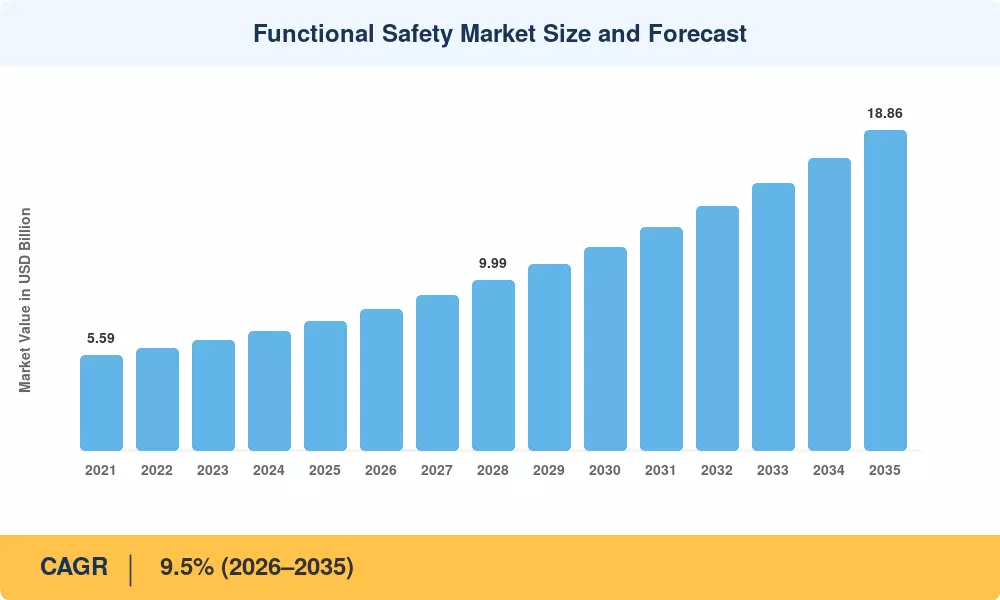
Functional Safety Market Size and Forecast
Our Impact
Enabled $4.3B Revenue Impact for Fortune 500 and Leading Multinationals
Partnering with 2000+ Global Organizations Each Year
30K+ Citations by Top-Tier Firms in the Industry

Driver Impact Analysis

Driver ~% Impact on CAGR Geographic Relevance Impact Timeline
Mandatory IEC 61508/61511 compliance enforcement ~18% Global Short-term (≤2 yr)
ISO 26262 automotive functional safety expansion ~16% Europe, North America, Asia-Pacific Medium-term (2–4 yr)
Industry 4.0 and smart manufacturing integration ~15% Global Medium-term (2–4 yr)
Methane emission penalties and ESG-driven retrofits ~12% North America, Europe Short-term (≤2 yr)
Autonomous systems and AI shutdown logic development ~14% North America, Europe, Asia-Pacific Long-term (≥4 yr)
Pharmaceutical batch-process validation requirements ~10% Europe, North America Medium-term (2–4 yr)
Hydrogen economy and energy transition infrastructure ~9% Europe, Asia-Pacific Long-term (≥4 yr)

Regulatory Compliance as a Non-Discretionary Demand Floor

Plant operators are unable to avoid the legal baselines established by IEC 61508 and its sector-specific derivatives, such as IEC 61511 for process industries and IEC 62061 for machinery. Semi-autonomous robotic cells and collaborative automation are now subject to safety integrity requirements under the European Commission's revised Machinery Regulation (EU 2023/1230), which goes into effect in January 2027. By 2029, this could result in an additional USD 800 million in safety spending across EU manufacturing [1][12].

Automotive Safety Standards and ADAS Proliferation

As manufacturers pursue Level 2+ and Level 3 autonomy technologies, ISO 26262 compliance expenses per vehicle platform have increased to USD 4–7 million. In order to push OEMs and Tier-1 suppliers to invest in fail-operational electronic control units and validated software stacks, Euro NCAP's 2026 protocol upgrade imposes a stricter crash-avoidance score linked to redundant safety designs [2][9].

Industry 4.0 Brownfield Retrofit Cycle

An estimated 65% of process plants worldwide still rely on relay-based or first-generation PLC safety systems installed before 2010. As these assets approach end-of-life, operators are replacing them with networked, SIL 3-rated programmable safety controllers that integrate natively with SCADA, DCS, and cloud-based asset performance management platforms [3][11].

ESG-Driven Process Safety Upgrades

The U.S. EPA's proposed methane fee under the Inflation Reduction Act—starting at USD 900 per metric ton in 2024 and rising to USD 1,500 by 2026—incentivizes upstream operators to install high-integrity pressure protection systems that simultaneously prevent blowouts and reduce fugitive emissions. Similar carbon-pricing mechanisms in Canada and the EU reinforce this investment cycle [8][14].

Restraints Impact Analysis

Restraint impact estimates follow the same directional methodology described in Section 4. They represent headwinds that moderate rather than eliminate growth, and are not directly subtracted from the headline CAGR.

Restraint ~% Negative Impact on CAGR Geographic Relevance Impact Timeline
High certification and lifecycle management costs ~−6% Global Short-term (≤2 yr)
Shortage of qualified functional safety engineers ~−5% Global Medium-term (2–4 yr)
Fragmented and evolving standards landscape ~−4% Emerging markets Medium-term (2–4 yr)
Legacy system integration complexity ~−4% North America, Europe Short-term (≤2 yr)
Cybersecurity vulnerabilities in networked safety controllers ~−3% Global Long-term (≥4 yr)

Certification Cost Burden for Small and Medium Enterprises

A complete SIL certification cycle can take 12 to 18 months and cost between USD 250,000 and USD 500,000 per safety function, including hazard and risk analysis, design review, integration testing, and third-party assessment. These expenses are a major obstacle for SMEs running single-site operations, delaying adoption and directing funds toward minimum viable compliance rather than best-practice designs [18][19].

Talent Scarcity in Functional Safety Engineering

Industry certification bodies estimate that there are fewer than 12,000 TÜV-certified Functional Safety Engineers (CFSE/CFSP) worldwide. Since 2022, contractor day-rates have increased by 15–25%, and project schedules have been stretched due to the growing disparity between the installed base of safety-instrumented systems and project demand, which is growing at a rate of around 10% per year [19][20].

Interoperability Challenges in Multi-Vendor Environments

Brownfield facilities often run safety controllers from two or three different vendors alongside legacy relay logic. Achieving SIL 2 or SIL 3 across a heterogeneous architecture requires extensive integration testing and custom middleware, adding 20–30% to total project costs compared with greenfield installations [11][21].

Functional Safety Market Opportunities

Subscription-Based Safety-as-a-Service Models

Cloud-hosted safety lifecycle platforms that bundle proof-test scheduling, documentation management, and competency tracking into monthly subscriptions are lowering the entry barrier for SMEs. This model converts large upfront certification expenditures into predictable operating expenses, expanding the addressable market beyond traditional large-cap operators.

Hydrogen and Battery Gigafactory Safety Infrastructure

The global pipeline of announced battery cell factories exceeds 200 projects through 2030, each requiring SIL 2–3 rated thermal runaway detection and gas suppression systems. Hydrogen production and fueling infrastructure add another layer of demand for high-integrity pressure protection and flame detection, with cumulative safety spending in these segments estimated to reach USD 1.2 Billion by 2032 [15][16].

Data Monetization Through Predictive Safety Analytics

Safety controllers generate vast amounts of diagnostic and process data that, when paired with machine learning algorithms, can predict degradation in final control elements before proof-test deadlines. Vendors offering embedded analytics dashboards and outcome-based maintenance contracts can capture 15–20% pricing premiums over commodity hardware suppliers.

Emerging Market Industrialization in Southeast Asia and Africa

Vietnam, Indonesia, and Nigeria are building refining and petrochemical capacity that will require greenfield safety-instrumented system installations aligned with international standards. These markets currently lack established local integrators, creating white-space opportunities for global vendors willing to invest in regional training and certification infrastructure.

Automotive Functional Safety for Autonomous Driving Platforms

As Level 3 and Level 4 autonomous driving programs expand beyond pilot fleets, demand for fail-operational architectures validated against ISO 26262 ASIL-D requirements will grow significantly. Semiconductor suppliers and Tier-1 integrators investing in pre-certified safety IP blocks can reduce OEM validation timelines from 18 months to under 9 months [2][13].

Functional Safety Market Future Outlook

AI-Enabled Safety Verification and Autonomous Shutdown Logic

Machine learning algorithms trained on decades of process upset data are beginning to supplement—and in some cases replace—static cause-and-effect matrices in safety-instrumented system design. By 2030, an estimated 25% of new SIS installations in the oil and gas sector will incorporate AI-assisted diagnostics that continuously validate safety function integrity, reducing spurious trip rates by 30–40% while maintaining or improving process risk reduction [17].

Platform Economics and Software-Defined Safety

The shift from proprietary hardware to open, software-defined safety platforms is reshaping vendor economics. Companies that can decouple safety logic execution from specific controller hardware—enabling portability across edge, on-premise, and cloud environments—will capture subscription revenue streams that grow independently of capital cycles. IEC is actively developing standards guidance for virtualized safety functions, with initial technical reports expected by 2028 [3][4].

Energy Transition and New Asset Classes

The IEA projects that global electrolyzer capacity will reach 550 GW by 2035, with each installation requiring dedicated safety instrumented systems for hydrogen leak detection, flame monitoring, and emergency depressurization. Similarly, the lithium-ion battery value chain—from cathode material processing to cell assembly—is introducing novel thermal hazard profiles that demand purpose-built SIL-rated protection systems [15][16].

ESG Reporting and Safety Performance Transparency

As ESG disclosure frameworks mature—driven by the EU Corporate Sustainability Reporting Directive and SEC climate risk rules—functional safety performance metrics are becoming material reporting items. Companies demonstrating lower process safety event rates and higher safety system availability are securing preferential insurance terms and lower costs of capital, creating a financial feedback loop that rewards functional safety investment [8][12].


Functional Safety Market Segmentation

By Device Type

Segment Key Metric Primary Demand Driver
Safety Sensors 31.4% share (2025) Ubiquitous deployment in gas detection, pressure, and temperature monitoring
Safety Switches USD 1.22 Billion (2025) Machine guarding and emergency stop applications
Programmable Safety Systems 10.8% CAGR Software-defined controller migration and integrated DCS safety
Safety Relays USD 0.74 Billion (2025) Legacy system maintenance and simple interlock circuits
Safety Controllers 10.2% CAGR Edge computing-enabled distributed safety architectures


Safety sensors remain the backbone of the Functional Safety Market, spanning gas detectors, pressure transmitters, flame detectors, and temperature elements deployed across every end-user industry. Their dominance reflects the fundamental reality that every safety function begins with reliable process variable measurement. The segment's installed base exceeds 45 million field devices globally, generating sustained aftermarket revenue through calibration, proof testing, and replacement cycles.

Programmable safety systems represent the fastest-growing device category as operators replace first-generation safety PLCs with modern SIL 3-capable controllers featuring integrated cybersecurity, redundant communication backplanes, and native cloud connectivity. These systems reduce engineering hours by 25–35% compared with hardwired relay implementations while enabling centralized safety program management across multi-site operations [3][11].

By Safety System

Segment Key Metric Primary Demand Driver
Emergency Shutdown Systems 30.4% share (2025) Regulatory mandate for rapid process isolation
Burner Management Systems USD 0.89 Billion (2025) Fired equipment safety in refining and power generation
High-Integrity Pressure Protection Systems 10.9% CAGR Methane penalties and well-integrity programs
Fire & Gas Detection Systems USD 1.14 Billion (2025) Facility perimeter and area monitoring requirements
Turbomachinery Control Systems 9.7% CAGR Compressor and turbine protection in LNG and power


Emergency shutdown systems constitute the largest safety system segment in the Functional Safety Market, driven by their role as the last line of automated defense against catastrophic process deviations. Refineries, chemical plants, and offshore platforms universally deploy ESD systems rated to SIL 2 or SIL 3, with system architectures ranging from simple 1oo1 to triple-modular-redundant 2oo3 configurations [1].

High-integrity pressure protection systems are gaining share at the fastest pace, propelled by tightening regulations around well-integrity management and methane emission reduction. HIPPS installations can eliminate the need for mechanical pressure relief devices, reducing flare emissions and enabling operators to demonstrate compliance with increasingly stringent environmental performance standards [8][14].

By Service

Segment Key Metric Primary Demand Driver
Testing, Inspection & Certification 40.1% share (2025) Proof-test compliance and third-party SIL verification
Design, Engineering & Maintenance USD 1.52 Billion (2025) Lifecycle management and brownfield retrofit engineering
Training & Consulting 11.7% CAGR Workforce competency development and standards interpretation


Testing, inspection, and certification services command the largest service share because every safety-instrumented system requires periodic proof testing at intervals specified in the safety requirements specification—typically 1–5 years depending on target SIL. Third-party certification bodies such as TÜV and Exida perform independent assessments that carry regulatory weight across most jurisdictions [18][19].

By End-User Industry

Segment Key Metric Primary Demand Driver
Oil & Gas 31.7% share (2025) Upstream/downstream process safety mandates
Automotive 9.8% CAGR ISO 26262 ADAS and EV architecture compliance
Food & Beverage USD 0.52 Billion (2025) Hygienic process automation and CIP system safety
Pharmaceuticals 10.8% CAGR Batch validation and FDA process safety expectations
Mining & Metals USD 0.38 Billion (2025) Conveyor protection and gas monitoring in underground operations
Power Generation 9.6% CAGR Turbine and boiler safety control modernization


Oil and gas remain the anchor vertical for the Functional Safety Market, with upstream operators deploying HIPPS and ESD systems across wellheads, gathering networks, and processing facilities, while downstream refiners invest in burner management and fire-and-gas systems to maintain operating permits. Pharmaceutical manufacturing is emerging as the fastest-growing end-user segment as regulatory agencies increase scrutiny of batch-process safety and hazardous material handling in active pharmaceutical ingredient production[12][14].


Regional Market Share Analysis

Region Key Metric Primary Investment Themes
North America 28.1% share (2025) Shale modernization, OSHA PSM enforcement, automotive ADAS
Europe 32.4% share (2025) EU Machinery Regulation, Seveso III compliance, offshore wind
Asia-Pacific 12.1% CAGR (2026–2035) Refinery expansion, automotive manufacturing, smart factories
South America USD 0.55 Billion (2025) Pre-salt oil production, mining safety upgrades
Middle East & Africa USD 0.49 Billion (2025) National oil company capex, downstream diversification
Total USD 7.61 Billion (2025)

The Functional Safety Market exhibits distinct regional patterns shaped by industrial maturity, regulatory stringency, and capital investment cycles. Europe leads on the strength of its legislative framework, while Asia-Pacific is accelerating fastest due to capacity additions.


North America

Country Key Metric Key Driver
US 72.3% of regional share OSHA PSM modernization and shale-sector automation [6]
Canada 10.5% CAGR Oil sands decarbonization and methane regulations [8]
Mexico USD 0.14 Billion (2025) Nearshoring-driven manufacturing plant safety compliance [22]


The United States accounts for the bulk of North American demand, anchored by OSHA's Process Safety Management standard and growing EPA enforcement of leak detection and repair programs across refining and midstream assets. Canada's oil sands operators are upgrading aging safety systems as part of broader emissions-reduction commitments, while Mexico is seeing a wave of greenfield safety installations tied to automotive and consumer electronics manufacturing nearshoring [6][22].

Europe

Country Key Metric Key Driver
Germany 24.6% of regional share Automotive OEM ISO 26262 spending and Industrie 4.0 [2]
UK 9.8% CAGR Offshore energy transition and HSE enforcement [23]
France USD 0.34 Billion (2025) Nuclear facility safety upgrades and rail signaling [24]
Italy 8.9% CAGR Pharmaceutical and food processing automation [12]
Spain USD 0.18 Billion (2025) Renewable energy and petrochemical plant retrofits [14]
Nordic Countries 10.1% CAGR Offshore wind and green hydrogen installations [16]
Russia USD 0.12 Billion (2025) Domestic refinery modernization programs [14]
Rest of Europe 9.4% CAGR Eastern European manufacturing expansion [22]


Europe's dominant position in the Functional Safety Market stems from the EU's layered regulatory architecture—Seveso III for major-accident hazard sites, the Machinery Regulation for equipment manufacturers, and ATEX directives for explosive atmospheres. Germany alone generates nearly a quarter of regional revenue through its concentration of automotive OEMs and chemical conglomerates, all of which maintain dedicated functional safety engineering teams. The UK's Health and Safety Executive continues to enforce some of the world's most rigorous offshore safety standards, sustaining demand for certified safety systems across North Sea operations [2][23][24].

Asia-Pacific

Country Key Metric Key Driver
China 38.2% of regional share Petrochemical capacity expansion and automotive electrification [14]
India 13.4% CAGR Refinery modernization and smart city infrastructure [25]
Japan USD 0.41 Billion (2025) Automotive safety and chemical plant upgrades [9]
South Korea 11.2% CAGR Semiconductor fab and battery plant safety installations [15]
ASEAN 12.8% CAGR Greenfield refining and food processing capacity [22]
Rest of Asia-Pacific USD 0.09 Billion (2025) Mining and energy sector development [14]


Asia-Pacific is the fastest-growing region in the Functional Safety Market, propelled by massive industrial capacity additions. China's 14th Five-Year Plan allocated over USD 150 Billion toward petrochemical modernization, much of it requiring IEC 61511-compliant safety instrumented systems. India's refinery throughput expansion—targeting 450 MMTPA by 2030—and South Korea's battery gigafactory pipeline add further layers of demand. Japanese automakers remain among the world's most rigorous adopters of ISO 26262, sustaining a mature but high-value safety electronics market [14][15][25].

South America

Country Key Metric Key Driver
Brazil 64.5% of regional share Pre-salt deepwater safety systems and ethanol processing [14]
Argentina 10.3% CAGR Vaca Muerta shale development [14]
Rest of South America USD 0.07 Billion (2025) Mining and mineral processing safety upgrades [22]


Brazil dominates the South American Functional Safety Market through Petrobras's ongoing pre-salt production scaling program, which requires subsea and topside safety instrumented systems rated to SIL 3 for high-pressure, high-temperature applications. Argentina's Vaca Muerta formation is attracting international operators who bring developed-market safety standards to greenfield well pads and gas processing facilities [14].

Middle East & Africa

Country Key Metric Key Driver
Saudi Arabia 34.7% of regional share Saudi Aramco downstream expansion and NEOM infrastructure [14]
UAE 11.6% CAGR Refinery and petrochemical modernization [14]
South Africa USD 0.05 Billion (2025) Mining sector safety compliance [22]
Egypt 10.2% CAGR Natural gas processing and fertilizer plant safety [14]
Rest of MEA USD 0.06 Billion (2025) Oil-producing nation infrastructure development [22]


Saudi Arabia anchors MEA demand through Saudi Aramco's downstream diversification strategy, which includes world-scale refining and petrochemical complexes at Ras Al Khair and Jazan requiring extensive SIL-rated safety systems. The UAE's ADNOC is similarly investing in safety upgrades across its Ruwais refining complex. Across sub-Saharan Africa, mining operators are gradually aligning with international safety integrity standards, though adoption remains uneven outside South Africa [14][22].


Functional Safety Market By Region, 2025-2035

Competitive Benchmarking

The Functional Safety Market exhibits medium concentration, with the top five players accounting for an estimated 38–45% of global revenue. Competition is structured around two tiers: large automation conglomerates that bundle safety systems within broader DCS/PLC portfolios, and specialized safety vendors that compete on certification depth, niche application expertise, and lifecycle services. The market's Herfindahl-Hirschman Index sits in the 800–1,200 range, reflecting meaningful competition without excessive fragmentation.

Company Est. Revenue Share Range Key Offerings for the Functional Safety Market Strategic Positioning
Siemens AG ~8–11% SIMATIC Safety Integrated controllers, SIL-rated instrumentation Full-stack automation with integrated safety across process and discrete
Honeywell International ~7–10% Safety Manager SC, FSC safety controllers Deep process industry footprint with lifecycle services
ABB Ltd ~6–9% AC 800M High Integrity safety system, SafetyPlus Strong in power and process; growing automotive safety portfolio
Schneider Electric ~5–8% Triconex safety controllers, EcoStruxure Safety Largest installed base of TMR safety controllers globally
Emerson Electric ~5–7% DeltaV SIS, Fisher safety valves, Rosemount safety transmitters Integrated measurement-to-final-element safety chain
Rockwell Automation ~4–6% GuardLogix safety PLCs, Allen-Bradley safety I/O Dominant in discrete and hybrid manufacturing safety applications
HIMA Paul Hildebrandt ~3–5% HIMax, HIQuad safety systems Independent safety specialist; strong in rail and pipeline
Yokogawa Electric ~3–5% ProSafe-RS safety instrumented system Process industry specialist with strong Asia-Pacific presence
Pilz GmbH ~2–4% PSS 4000, SafetyEYE, machinery safety services European leader in machinery safety and CE compliance
TÜV Rheinland ~2–3% Functional safety certification, training, consulting Certification authority with a global accreditation reach

Recent News & Developments

  • European Commission (July 2024): Published detailed implementing guidance for the revised EU Machinery Regulation (EU 2023/1230), clarifying SIL requirements for collaborative robot installations and AI-enabled machinery, with full enforcement beginning January 2027 [Ref: EU Official Journal, July 2024].
  • January 2026: Siemens set aside EUR 150 million (USD 165 million) to expand its Amberg facility and increase the output of Simatic Safety Integrated controllers by 40%.Pilz introduced the cloud-native MYZEL lifecycle suite in November 2025, offering multi-site clients a 25–30% reduction in compliance expenses.
  • October 2025: In order to commercialize SIL-3 cybersecurity gateways, ABB and Honeywell established a joint venture in October 2025. The first deliveries are scheduled for Q2 2026.
  • September 2025: In order to incorporate safety-rated navigation into FactoryTalk automation, Rockwell Automation paid USD 290 million to acquire Clearpath Robotics in September 2025.

Functional Safety Market Report Scope

Parameter Detail
Market Scope The Global Functional Safety Market encompasses devices, safety systems, services, and end-user industries
Study Period 2021–2035
CAGR 9.5% (2026–2035)
Base Year Market Size USD 7.61 Billion (2025)
Forecast Start Market Size USD 8.33 Billion (2026)
Forecast End Market Size USD 18.86 Billion (2035)
Fastest Growing Segment High-Integrity Pressure Protection Systems (by safety system); Pharmaceuticals (by end user)
Companies Profiled 10 (Siemens, Honeywell, ABB, Schneider Electric, Emerson, Rockwell Automation, HIMA, Yokogawa, Pilz, TÜV Rheinland)
Valuation Currency USD Billion


FAQs

What is the typical SIL assessment timeline for a brownfield facility?
A brownfield SIL assessment usually takes 14–22 weeks, covering hazard review, SIL determination workshops, and verification testing. Facilities with legacy DCS infrastructure may require an additional 4–6 weeks for loop migration planning [18].
How do subscription-based safety services compare with traditional project-based procurement?
Subscription models spread costs into predictable monthly fees and include proof-test scheduling, documentation updates, and remote diagnostics. They reduce upfront capital by 30–40% but typically require 3–5-year commitments [4].
What role does cybersecurity play in Functional Safety Market system selection?
IEC 62443 alignment is increasingly required alongside IEC 61508 compliance, as networked safety controllers face growing attack surfaces. Buyers should prioritize vendors offering integrated security-by-design architectures [21].
How are digital twin platforms affecting proof-test intervals in the Functional Safety Market?
Digital twins enable condition-based proof testing, extending intervals by 20–35% without compromising safety integrity levels. This reduces planned shutdowns and associated production losses significantly [17].
What differentiates TÜV-certified from non-certified safety controllers?
TÜV certification provides independent verification of IEC 61508 compliance, reducing buyer liability and accelerating end-user acceptance. Non-certified controllers require additional site-level validation, adding cost and time [19].
Which emerging verticals are driving incremental demand in the Functional Safety Market?
Data center operators and battery gigafactory builders are emerging as significant buyers, requiring SIL 2–3 rated systems for thermal management and fire suppression. These verticals could contribute USD 0.5–0.6 billion by 2032 [15].
How will AI-based diagnostics reshape the Functional Safety Market competitive dynamics?
Vendors embedding predictive analytics into safety controllers will capture premium pricing and sticky maintenance contracts. Smaller integrators lacking AI capabilities face margin compression as end users consolidate suppliers [17].    
Author
Author
Author Profile
Nirmit Biswas LinkedIn
Senior Research Analyst
With 5+ years of expertise in Market Intelligence and Strategic Research, Nirmit Biswas specializes in ICT, Semiconductors, and BFSI. Backed by an MBA in Financial Services and a Computer Science foundation, Nirmit blends technical depth with business acumen. He has successfully led 100+ projects for global enterprises and startups, including Amazon, Cisco, L&T and Huawei, delivering market estimations, competitive benchmarking, and GTM strategies. His focus lies in transforming complex data into clear, actionable insights that drive growth, innovation, and investment decisions. Recognized for bridging engineering innovation with executive strategy, Nirmit helps businesses navigate dynamic markets with confidence.
Co-Author
Co-Author Profile
Aarti Dhapte LinkedIn
AVP - Research
A consulting professional focused on helping businesses navigate complex markets through structured research and strategic insights. I partner with clients to solve high-impact business problems across market entry strategy, competitive intelligence, and opportunity assessment. Over the course of my experience, I have led and contributed to 100+ market research and consulting engagements, delivering insights across multiple industries and geographies, and supporting strategic decisions linked to $500M+ market opportunities. My core expertise lies in building robust market sizing, forecasting, and commercial models (top-down and bottom-up), alongside deep-dive competitive and industry analysis. I have played a key role in shaping go-to-market strategies, investment cases, and growth roadmaps, enabling clients to make confident, data-backed decisions in dynamic markets.

Research Approach


Secondary Research

The secondary research process involved comprehensive analysis of international standards databases, industrial automation publications, safety engineering journals, and authoritative regulatory bodies. Key sources included the International Electrotechnical Commission (IEC) standards repository (IEC 61508, IEC 62061, IEC 61511), International Organization for Standardization (ISO) databases (ISO 26262, ISO 13849, ISO 12100), US Occupational Safety and Health Administration (OSHA), European Agency for Safety and Health at Work (EU-OSHA), US National Institute of Standards and Technology (NIST), American National Standards Institute (ANSI), Process Safety Management (PSM) databases, US Chemical Safety and Hazard Investigation Board (CSB), European Chemicals Agency (ECHA), US Department of Energy (DOE) Safety databases, International Association of Oil & Gas Producers (IOGP) safety reports, US National Transportation Safety Board (NTSB) incident databases, EU European Industrial Gases Association (EIGA) safety publications, US Food and Drug Administration (FDA) 21 CFR Part 11 compliance data, UK Health and Safety Executive (HSE), German Federal Institute for Occupational Safety and Health (BAuA), Japan Ministry of Health, Labour and Welfare industrial safety statistics, American Petroleum Institute (API) safety standards, US Bureau of Safety and Environmental Enforcement (BSEE) offshore safety data, International Labour Organization (ILO) occupational safety statistics, and national process safety regulatory reports from key markets. These sources were used to collect safety integrity level (SIL) certification data, regulatory compliance requirements, incident analysis reports, industrial automation trends, and market landscape analysis for safety sensors, safety controllers/modules/relays, programmable safety systems, emergency stop devices, and final control elements across emergency shutdown systems (ESD), burner management systems (BMS), turbomachinery control (TMC) systems, high-integrity pressure protection systems (HIPPS), and fire & gas monitoring control systems.


Primary Research

Qualitative and quantitative insights were obtained by interviewing supply-side and demand-side stakeholders during the primary research process. CEOs, VPs of Engineering, Chief Safety Officers, regulatory compliance leaders, and business unit directors from functional safety device manufacturers, automation solution providers, and safety system integrators comprised supply-side sources. Plant managers, process safety engineers, instrumentation and control managers, reliability engineers, and procurement leads from oil and gas operators, power generation utilities, pharmaceutical manufacturers, automotive OEMs, food and beverage processors, and chemical plants comprised demand-side sources. Safety integrity level (SIL) adoption patterns were validated, product certification timelines were confirmed, and insights regarding Industry 4.0 integration, maintenance strategies, and lifecycle cost analysis were garnered through primary research.

Primary Respondent Breakdown:

By Designation: C-level Primaries (28%), Director Level (32%), Others (40%)

By Region: North America (32%), Europe (30%), Asia-Pacific (28%), Rest of World (10%)


Market Size Estimation

Global market valuation was derived through revenue mapping and safety system deployment analysis. The methodology included:

Identification of 55+ key manufacturers across North America, Europe, Asia-Pacific, and Latin America

Product mapping across safety sensors, safety controllers/modules/relays, programmable safety systems, emergency stop devices, final control elements (valves, actuators), and safety switches

System-level analysis across emergency shutdown systems (ESD), burner management systems (BMS), turbomachinery control (TMC) systems, high-integrity pressure protection systems (HIPPS), fire & gas monitoring control systems, SCADA safety systems, and distributed control systems (DCS)

Analysis of reported and modeled annual revenues specific to functional safety device and system portfolios

Coverage of manufacturers representing 72-78% of global market share in 2024

Extrapolation using bottom-up (safety device shipments × ASP by industry vertical and region) and top-down (manufacturer revenue validation) approaches to derive segment-specific valuations across oil & gas, power generation, pharmaceuticals, automotive, food & beverage, and chemical processing end-user industries

Download Free Sample

Kindly complete the form below to receive a free sample of this Report

Download PDF ×

We do not share your information with anyone. However, we may send you emails based on your report interest from time to time. You may contact us at any time to opt-out.

















