Functional Safety Market (2026 - 2035)

ID: MRFR/SEM/2329-CR
131 Pages
Nirmit Biswas
Last Updated: June 30, 2026
Functional Safety Market Size, Share and Research Report By Device (Actuators, Safety Sensors, Final Control Elements, Safety Controllers, Modules, Relays & Programmable Safety Systems), By System (Safety Instrumented Systems, Turbo Machinery Control (TMC), Supervisory Control System, Burner Management Systems (BMS) & Emergency Shutdown Systems (ESD)), By End-Users (Oil & Gas, Metal & Mining, Pharmaceuticals & Biotech, Retail & Wholesale) And By Region (North America, Europe, Asia-Pacific, & Rest Of The World) –Industry Forecast Till 2035
Functional Safety Market
Market Size
Forecast Period2026-2035
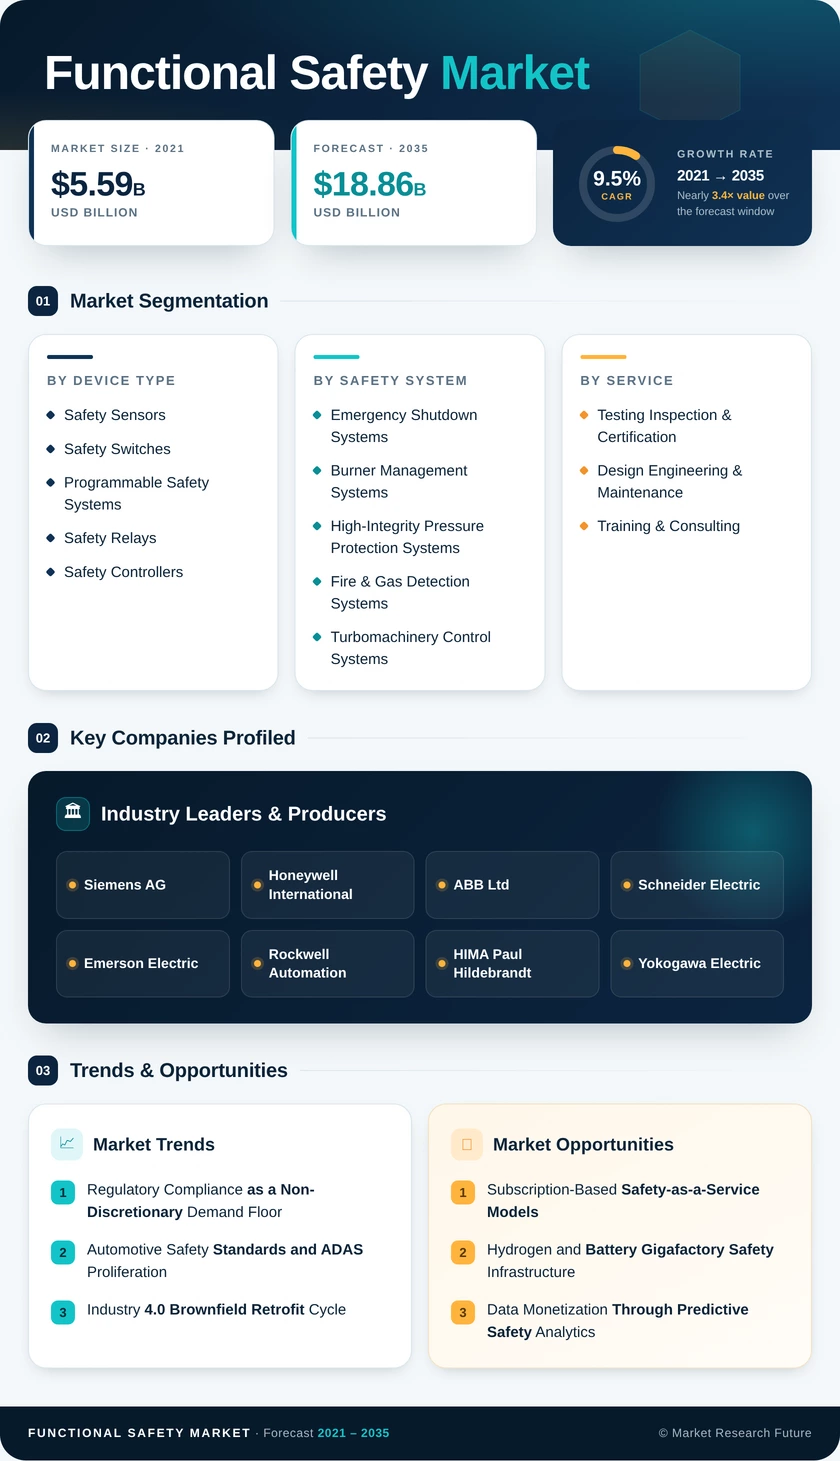
CAGR (2026-2035)9.5%
2025 Market SizeUSD 7.61 Billion
2026 Market SizeUSD 8.33 Billion
2035 Market SizeUSD 18.86 Billion
Key Players
Siemens AG
Honeywell International
ABB Ltd
Schneider Electric
Emerson Electric
Rockwell Automation
Opportunities
  • Subscription-Based Safety-as-a-Service Models
  • Hydrogen and Battery Gigafactory Safety Infrastructure
  • Data Monetization Through Predictive Safety Analytics
  1. 1 Market Overview |
    1. 1.1 Study Assumptions & Market Definition |
    2. 1.2 Scope of the Study |
    3. 1.3 Research Methodology
  2. 2 Market Summary & Key Takeaways
  3. 3 Market Dynamics |
    1. 3.1 Market Drivers Analysis | |
      1. 3.1.1 Regulatory Compliance as a Non-Discretionary Demand Floor | |
      2. 3.1.2 Automotive Safety Standards and ADAS Proliferation | |
      3. 3.1.3 Industry
    2. 4.0 Brownfield Retrofit Cycle | |
      1. 3.1.4 ESG-Driven Process Safety Upgrades |
    3. 3.2 Market Restraints Analysis | |
      1. 3.2.1 Certification Cost Burden for Small and Medium Enterprises | |
      2. 3.2.2 Talent Scarcity in Functional Safety Engineering | |
      3. 3.2.3 Interoperability Challenges in Multi-Vendor Environments |
    4. 3.3 Market Opportunity Analysis | |
      1. 3.3.1 Subscription-Based Safety-as-a-Service Models | |
      2. 3.3.2 Hydrogen and Battery Gigafactory Safety Infrastructure | |
      3. 3.3.3 Data Monetization Through Predictive Safety Analytics | |
      4. 3.3.4 Emerging Market Industrialization in Southeast Asia and Africa | |
      5. 3.3.5 Automotive Functional Safety for Autonomous Driving Platforms |
    5. 3.4 Industry Value Chain Analysis |
    6. 3.5 Porter's Five Forces Analysis
  4. 4 Global Functional Safety Market Size & Forecast (2021–2035) |
    1. 4.1 Historical Market Size (2021–2025) |
    2. 4.2 Current & Forecast Market Size (2026–2035) |
    3. 4.3 Market Size by Revenue (USD Billion) |
    4. 4.4 Year-over-Year Growth Analysis
  5. 5 Segmentation Analysis |
    1. 5.1 By Device Type | |
      1. 5.1.1 Safety Sensors | |
      2. 5.1.2 Safety Switches | |
      3. 5.1.3 Programmable Safety Systems | |
      4. 5.1.4 Safety Relays | |
      5. 5.1.5 Safety Controllers |
    2. 5.2 By Safety System | |
      1. 5.2.1 Emergency Shutdown Systems | |
      2. 5.2.2 Burner Management Systems | |
      3. 5.2.3 High-Integrity Pressure Protection Systems | |
      4. 5.2.4 Fire & Gas Detection Systems | |
      5. 5.2.5 Turbomachinery Control Systems |
    3. 5.3 By Service | |
      1. 5.3.1 Testing, Inspection & Certification | |
      2. 5.3.2 Design, Engineering & Maintenance | |
      3. 5.3.3 Training & Consulting |
    4. 5.4 By End-User Industry | |
      1. 5.4.1 Oil & Gas | |
      2. 5.4.2 Automotive | |
      3. 5.4.3 Food & Beverage | |
      4. 5.4.4 Pharmaceuticals | |
      5. 5.4.5 Mining & Metals | |
      6. 5.4.6 Power Generation
  6. 6 Regional Analysis |
    1. 6.1 North America | |
      1. 6.1.1 United States | |
      2. 6.1.2 Canada | |
      3. 6.1.3 Mexico |
    2. 6.2 Europe | |
      1. 6.2.1 Germany | |
      2. 6.2.2 United Kingdom | |
      3. 6.2.3 France | |
      4. 6.2.4 Italy | |
      5. 6.2.5 Spain | |
      6. 6.2.6 Nordic Countries | |
      7. 6.2.7 Russia | |
      8. 6.2.8 Rest of Europe |
    3. 6.3 Asia-Pacific | |
      1. 6.3.1 China | |
      2. 6.3.2 India | |
      3. 6.3.3 Japan | |
      4. 6.3.4 South Korea | |
      5. 6.3.5 ASEAN | |
      6. 6.3.6 Rest of Asia-Pacific |
    4. 6.4 South America | |
      1. 6.4.1 Brazil | |
      2. 6.4.2 Argentina | |
      3. 6.4.3 Rest of South America |
    5. 6.5 Middle East & Africa | |
      1. 6.5.1 Saudi Arabia | |
      2. 6.5.2 UAE | |
      3. 6.5.3 South Africa | |
      4. 6.5.4 Egypt | |
      5. 6.5.5 Rest of MEA
  7. 7 Competitive Landscape |
    1. 7.1 Market Share Analysis (2025) |
    2. 7.2 Competitive Benchmarking Matrix |
    3. 7.3 Company Profiles | |
      1. 7.3.1 Siemens AG | |
      2. 7.3.2 Honeywell International | |
      3. 7.3.3 ABB Ltd | |
      4. 7.3.4 Schneider Electric | |
      5. 7.3.5 Emerson Electric | |
      6. 7.3.6 Rockwell Automation | |
      7. 7.3.7 HIMA Paul Hildebrandt | |
      8. 7.3.8 Yokogawa Electric | |
      9. 7.3.9 Pilz GmbH | |
      10. 7.3.10 TÜV Rheinland
  8. 8 Future Outlook & Strategic Recommendations (2026–2035) |
    1. 8.1 AI-Enabled Safety Verification and Autonomous Shutdown Logic |
    2. 8.2 Platform Economics and Software-Defined Safety |
    3. 8.3 Energy Transition and New Asset Classes |
    4. 8.4 ESG Reporting and Safety Performance Transparency
  9. 9 Recent Developments & News
  10. 10 Frequently Asked Questions (FAQs)
  11. 11 Report Scope & Methodology |
    1. 11.1 Study Period & Base Year |
    2. 11.2 Data Sources & Citations |
    3. 11.3 Abbreviations
  12. 12 LIST OF TABLES |
  13. TABLE 1 Global Functional Safety Market Size & Forecast, by Revenue (USD Billion), 2021–2035 |
  14. TABLE 2 Global Functional Safety Market – Year-over-Year Growth Analysis, 2021–2035 |
  15. TABLE 3 Global Functional Safety Market – Driver Impact Analysis |
  16. TABLE 4 Global Functional Safety Market – Restraint Impact Analysis |
  17. TABLE 5 Global Functional Safety Market Size, by Device Type, 2021–2035 (USD Billion) |
  18. TABLE 6 Global Functional Safety Market Size, by Safety System, 2021–2035 (USD Billion) |
  19. TABLE 7 Global Functional Safety Market Size, by Service, 2021–2035 (USD Billion) |
  20. TABLE 8 Global Functional Safety Market Size, by End-User Industry, 2021–2035 (USD Billion) |
  21. TABLE 9 Global Functional Safety Market Size, by Region, 2021–2035 (USD Billion) |
  22. TABLE 10 North America Functional Safety Market Size, by Country, 2021–2035 (USD Billion) |
  23. TABLE 11 Europe Functional Safety Market Size, by Country, 2021–2035 (USD Billion) |
  24. TABLE 12 Asia-Pacific Functional Safety Market Size, by Country, 2021–2035 (USD Billion) |
  25. TABLE 13 South America Functional Safety Market Size, by Country, 2021–2035 (USD Billion) |
  26. TABLE 14 Middle East & Africa Functional Safety Market Size, by Country, 2021–2035 (USD Billion) |
  27. TABLE 15 Competitive Benchmarking Matrix – Global Functional Safety Market, 2025 |
  28. TABLE 16 Company Profiles – Key Players, Global Functional Safety Market |
  29. TABLE 17 Recent Developments & Strategic Announcements, 2023–2025 |
  30. TABLE 18 North America Functional Safety Market Size, by Device Type, 2021–2035 (USD Billion) |
  31. TABLE 19 North America Functional Safety Market Size, by Safety System, 2021–2035 (USD Billion) |
  32. TABLE 20 North America Functional Safety Market Size, by Service, 2021–2035 (USD Billion) |
  33. TABLE 21 North America Functional Safety Market Size, by End-User Industry, 2021–2035 (USD Billion) |
  34. TABLE 22 Europe Functional Safety Market Size, by Device Type, 2021–2035 (USD Billion) |
  35. TABLE 23 Europe Functional Safety Market Size, by Safety System, 2021–2035 (USD Billion) |
  36. TABLE 24 Europe Functional Safety Market Size, by Service, 2021–2035 (USD Billion) |
  37. TABLE 25 Europe Functional Safety Market Size, by End-User Industry, 2021–2035 (USD Billion) |
  38. TABLE 26 Asia-Pacific Functional Safety Market Size, by Device Type, 2021–2035 (USD Billion) |
  39. TABLE 27 Asia-Pacific Functional Safety Market Size, by Safety System, 2021–2035 (USD Billion) |
  40. TABLE 28 Asia-Pacific Functional Safety Market Size, by Service, 2021–2035 (USD Billion) |
  41. TABLE 29 Asia-Pacific Functional Safety Market Size, by End-User Industry, 2021–2035 (USD Billion) |
  42. TABLE 30 South America Functional Safety Market Size, by Device Type, 2021–2035 (USD Billion) |
  43. TABLE 31 South America Functional Safety Market Size, by Safety System, 2021–2035 (USD Billion) |
  44. TABLE 32 South America Functional Safety Market Size, by Service, 2021–2035 (USD Billion) |
  45. TABLE 33 South America Functional Safety Market Size, by End-User Industry, 2021–2035 (USD Billion) |
  46. TABLE 34 Middle East & Africa Functional Safety Market Size, by Device Type, 2021–2035 (USD Billion) |
  47. TABLE 35 Middle East & Africa Functional Safety Market Size, by Safety System, 2021–2035 (USD Billion) |
  48. TABLE 36 Middle East & Africa Functional Safety Market Size, by Service, 2021–2035 (USD Billion) |
  49. TABLE 37 Middle East & Africa Functional Safety Market Size, by End-User Industry, 2021–2035 (USD Billion) |
  50. TABLE 38 Report Scope and Methodology Summary |
  51. TABLE 39 Detailed Sources and Citations
  52. 13 LIST OF FIGURES |
  53. FIGURE 1 Global Functional Safety Market Dynamics (Drivers, Restraints, Opportunities) |
  54. FIGURE 2 Industry Value Chain Analysis – Functional Safety Market |
  55. FIGURE 3 Porter's Five Forces Analysis – Functional Safety Market |
  56. FIGURE 4 Global Functional Safety Market Size Trend, 2021–2035 (USD Billion) |
  57. FIGURE 5 Global Functional Safety Market Share, by Device Type, 2025 (%) |
  58. FIGURE 6 Global Functional Safety Market Share, by Safety System, 2025 (%) |
  59. FIGURE 7 Global Functional Safety Market Share, by Service, 2025 (%) |
  60. FIGURE 8 Global Functional Safety Market Share, by End-User Industry, 2025 (%) |
  61. FIGURE 9 Global Functional Safety Market Share, by Region, 2025 (%) |
  62. FIGURE 10 North America Functional Safety Market Size, by Country, 2021–2035 (USD Billion) |
  63. FIGURE 11 Europe Functional Safety Market Size, by Country, 2021–2035 (USD Billion) |
  64. FIGURE 12 Asia-Pacific Functional Safety Market Size, by Country, 2021–2035 (USD Billion) |
  65. FIGURE 13 South America Functional Safety Market Size, by Country, 2021–2035 (USD Billion) |
  66. FIGURE 14 Middle East & Africa Functional Safety Market Size, by Country, 2021–2035 (USD Billion) |
  67. FIGURE 15 Competitive Landscape – Market Share Analysis, 2025

Segmentation Quick Reference

DimensionSub-SegmentsDominant SegmentFastest Growing Segment
Device TypeSafety Sensors, Safety Switches, Programmable Safety Systems, Safety Relays, Safety ControllersSafety SensorsProgrammable Safety Systems
Safety SystemEmergency Shutdown Systems, Burner Management Systems, High-Integrity Pressure Protection Systems, Fire & Gas Detection Systems, Turbomachinery Control SystemsEmergency Shutdown SystemsHigh-Integrity Pressure Protection Systems
ServiceTesting Inspection & Certification, Design Engineering & Maintenance, Training & ConsultingTesting, Inspection & CertificationTraining & Consulting
End-User IndustryOil & Gas, Automotive, Food & Beverage, Functional Safety Markets, Mining & Metals, Power GenerationOil & GasFunctional Safety Markets
GeographyNorth America, Europe, Asia-Pacific, South America, Middle East & AfricaEuropeAsia-Pacific


Market Segmentation Overview

By Device Type

Sub-SegmentKey Trend
Safety SensorsMigration to smart, SIL-rated transmitters with HART 7 and fieldbus diagnostics
Safety SwitchesIntegration of RFID-coded non-contact switches for flexible machine guarding
Programmable Safety SystemsSoftware-defined controllers enabling over-the-air certification updates
Safety RelaysGradual decline as programmable alternatives gain cost parity
Safety ControllersEdge-computing-enabled distributed architectures with embedded cybersecurity


Safety sensors remain the largest device category, reflecting their role as the foundational measurement layer in every safety-instrumented function. Programmable safety systems are overtaking legacy relay-based architectures as lifecycle cost advantages and engineering efficiency gains become undeniable across both process and discrete manufacturing.

By Safety System

Sub-SegmentKey Trend
Emergency Shutdown SystemsAdoption of partial-stroke testing and smart valve positioners for improved availability
Burner Management SystemsIntegration with combustion optimization to reduce emissions alongside safety assurance
High-Integrity Pressure Protection SystemsReplacing mechanical relief valves to cut flaring and fugitive emissions
Fire & Gas Detection SystemsShift toward video-based flame detection and open-path gas imaging
Turbomachinery Control SystemsDigital governor integration with predictive vibration monitoring


Emergency shutdown systems lead by revenue share owing to universal regulatory mandates across hazardous process industries. High-integrity pressure protection systems represent the fastest-expanding category, driven by environmental compliance pressures and well-integrity management requirements in upstream oil and gas.

By Service

Sub-SegmentKey Trend
Testing, Inspection & CertificationCloud-based proof-test documentation and automated compliance tracking
Design, Engineering & MaintenanceShift toward turnkey safety lifecycle management contracts
Training & ConsultingVirtual-reality-based competency assessment and remote learning platforms


Testing, inspection, and certification dominate service revenue due to recurring proof-test obligations mandated by IEC 61511 safety requirements specifications. Training and consulting services are expanding fastest as the global shortage of certified functional safety professionals creates sustained demand for workforce development programs.

By End-User Industry

Sub-SegmentKey Trend
Oil & GasHIPPS and ESD upgrades driven by methane regulations and aging infrastructure
AutomotiveISO 26262 ASIL-D compliance for ADAS and autonomous driving platforms
Food & BeverageHygienic safety sensor adoption for CIP and SIP process protection
Functional Safety MarketsBatch-process validation and hazardous API handling safety systems
Mining & MetalsUnderground gas monitoring and conveyor protection system modernization
Power GenerationTurbine and boiler safety control upgrades for combined-cycle efficiency


Oil and gas commands the largest share of end-user spending, reflecting the sector's high-hazard operating environment and dense regulatory coverage. Functional Safety Markets represent the fastest-growing vertical as global regulatory agencies increase scrutiny of process safety in active ingredient manufacturing and biologic production facilities.

By Geography

Sub-SegmentKey Trend
North AmericaOSHA PSM enforcement, shale automation, and automotive ADAS investment
EuropeEU Machinery Regulation, Seveso III compliance, offshore wind safety
Asia-PacificRefinery capacity additions, automotive manufacturing, smart factory rollouts
South AmericaPre-salt deepwater safety, mining sector compliance upgrades
Middle East & AfricaNational oil company capex, downstream diversification, and mining safety


Europe leads globally through its comprehensive regulatory framework spanning process, machinery, and automotive safety domains. Asia-Pacific is accelerating fastest as China, India, and ASEAN nations add industrial capacity that requires international-standard safety instrumented systems from inception.


 

Download PDF ×

We do not share your information with anyone. However, we may send you emails based on your report interest from time to time. You may contact us at any time to opt-out.