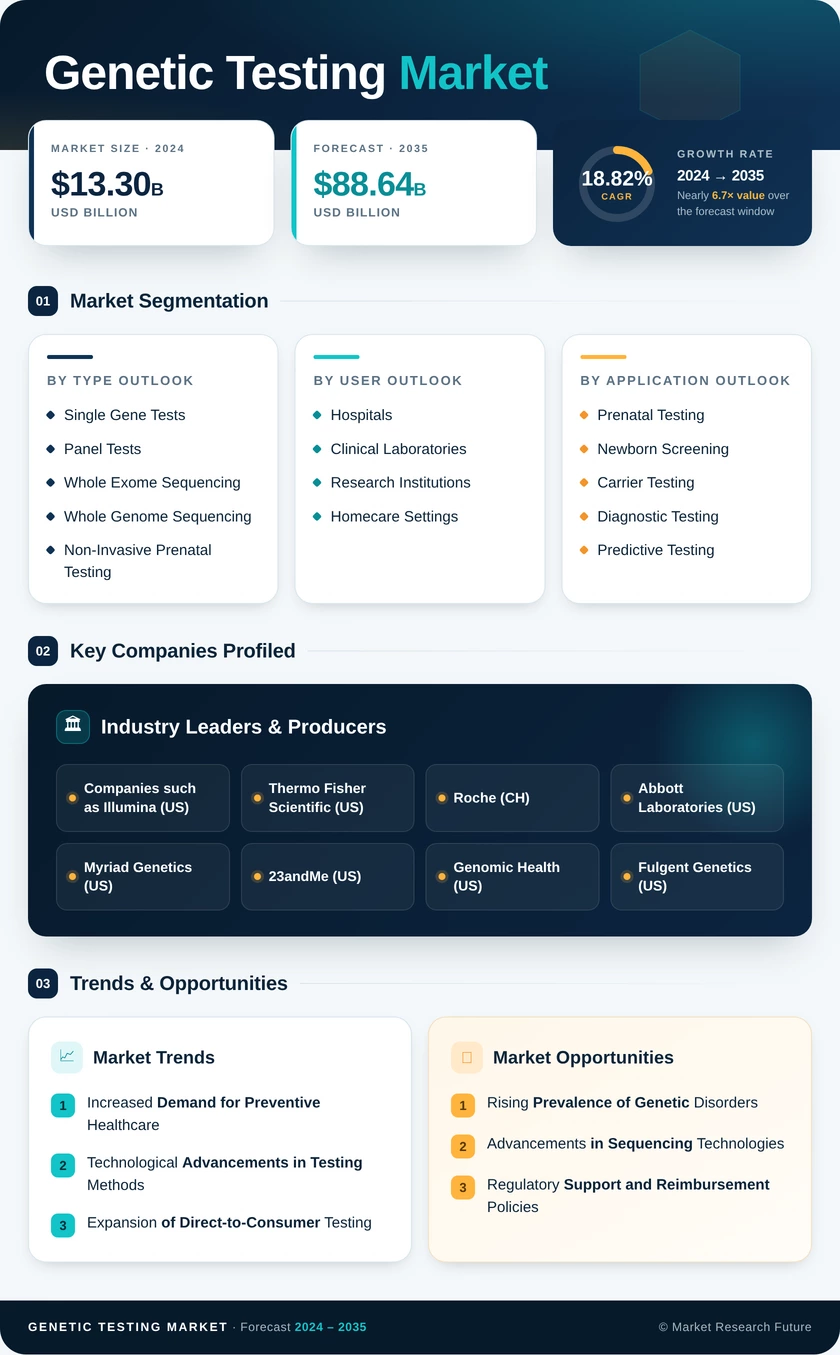
Genetic Testing Market (2026 - 2035)

Genetic Testing Market Research Report: Size, Share, Trend Analysis By Applications (Prenatal Testing, Newborn Screening, Carrier Testing, Diagnostic Testing, Predictive Testing), By Types (Single Gene Tests, Panel Tests, Whole Exome Sequencing, Whole Genome Sequencing, Non-Invasive Prenatal Testing), By Service Type (Laboratory Services, Diagnostic Services, Consultation Services), By End Users (Hospitals, Clinical Laboratories, Research Institutions, Homecare Settings) andBy Regional (North America, Europe, South America, Asia Pacific, Middle East and Africa) - Growth Outlook & Industry Forecast 2025 To 2035

Forecast Period
2026-2035
CAGR
9.55%
2025 Market Size
USD 24.37 Billion
2035 Market Size
USD 60.69 Billion
Healthcare ● Updated August 2026 Report ID: MRFR/HC/1477-CR | Pages: 150 | Author: Satyendra Maurya, Rahul Gotadki
  1. 1 Market Summary |
    1. 1.1 Study Assumptions & Market Definition |
    2. 1.2 Scope of the Study |
    3. 1.3 Research Methodology
  2. 2 Key Report Takeaways |
    1. 2.1 By Technology |
    2. 2.2 By Application |
    3. 2.3 By Region
  3. 3 Market Size & Forecast (2021–2035) |
    1. 3.1 Historical Market Size (2021–2025) |
    2. 3.2 Current & Forecast Market Size (2026–2035) |
    3. 3.3 Year-over-Year Growth Analysis
  4. 4 Driver Impact Analysis |
    1. 4.1 Sequencing Cost Decline |
    2. 4.2 Oncology Precision-Medicine Mandates |
    3. 4.3 National Population Genomics Programs |
    4. 4.4 Expanded Payer Coverage
  5. 5 Restraints Impact Analysis |
    1. 5.1 Reimbursement Uncertainty for Novel Assays |
    2. 5.2 EU IVDR Compliance Cost |
    3. 5.3 Variant-of-Uncertain-Significance Burden |
    4. 5.4 Genetic Privacy & Data Governance |
    5. 5.5 Clinical Workforce Shortage
  6. 6 Opportunities |
    1. 6.1 Long-Read Sequencing for Undiagnosed Disease |
    2. 6.2 Emerging-Market Infrastructure Build-Out |
    3. 6.3 Data Monetization Through Curated Genomic Cohorts |
    4. 6.4 Hereditary Risk Programs in Primary Care |
    5. 6.5 Pharmacogenomics at Prescription Point-of-Care
  7. 7 Regional Market Share & Country-Level Analysis |
    1. 7.1 North America | |
      1. 7.1.1 United States | |
      2. 7.1.2 Canada | |
      3. 7.1.3 Mexico |
    2. 7.2 Europe | |
      1. 7.2.1 Germany | |
      2. 7.2.2 United Kingdom | |
      3. 7.2.3 France | |
      4. 7.2.4 Italy | |
      5. 7.2.5 Spain | |
      6. 7.2.6 Nordic Countries | |
      7. 7.2.7 Russia | |
      8. 7.2.8 Rest of Europe |
    3. 7.3 Asia-Pacific | |
      1. 7.3.1 China | |
      2. 7.3.2 India | |
      3. 7.3.3 Japan | |
      4. 7.3.4 South Korea | |
      5. 7.3.5 ASEAN | |
      6. 7.3.6 Rest of Asia-Pacific |
    4. 7.4 South America | |
      1. 7.4.1 Brazil | |
      2. 7.4.2 Argentina | |
      3. 7.4.3 Rest of South America |
    5. 7.5 Middle East & Africa | |
      1. 7.5.1 Saudi Arabia | |
      2. 7.5.2 UAE | |
      3. 7.5.3 South Africa | |
      4. 7.5.4 Egypt | |
      5. 7.5.5 Rest of Middle East & Africa
  8. 8 Future Outlook (2026–2035) |
    1. 8.1 AI-Assisted Interpretation |
    2. 8.2 Platform Economics & Subscription Models |
    3. 8.3 Multi-Omics Convergence |
    4. 8.4 Data Sovereignty & Regional Processing
  9. 9 Market Segmentation Analysis |
    1. 9.1 By Product & Service | |
      1. 9.1.1 Consumables and Reagents | |
      2. 9.1.2 Equipment and Instruments | |
      3. 9.1.3 Software and Services |
    2. 9.2 By Test Type | |
      1. 9.2.1 Diagnostic Testing | |
      2. 9.2.2 Prenatal & Newborn Testing | |
      3. 9.2.3 Predictive & Presymptomatic Testing | |
      4. 9.2.4 Carrier Testing | |
      5. 9.2.5 Nutrigenomic Testing | |
      6. 9.2.6 Pharmacogenomic Testing | |
      7. 9.2.7 Relationship & Ancestry Testing |
    3. 9.3 By Technology | |
      1. 9.3.1 Next-Generation Sequencing | |
      2. 9.3.2 Polymerase Chain Reaction | |
      3. 9.3.3 Array Technology | |
      4. 9.3.4 Sanger Sequencing | |
      5. 9.3.5 Fluorescence In Situ Hybridization | |
      6. 9.3.6 Other Technologies |
    4. 9.4 By Application | |
      1. 9.4.1 Oncology | |
      2. 9.4.2 Genetic Disease Diagnosis | |
      3. 9.4.3 Reproductive Health | |
      4. 9.4.4 Cardiovascular | |
      5. 9.4.5 Infectious Disease | |
      6. 9.4.6 Other Applications |
    5. 9.5 By End User | |
      1. 9.5.1 Hospitals & Clinics | |
      2. 9.5.2 Diagnostic Laboratories | |
      3. 9.5.3 Research & Academic Institutes | |
      4. 9.5.4 Direct-to-Consumer | |
      5. 9.5.5 Other End Users
  10. 10 Competitive Landscape |
    1. 10.1 Market Concentration Analysis (2026) |
    2. 10.2 Competitive Benchmarking Matrix |
    3. 10.3 Company Profiles | |
      1. 10.3.1 Illumina, Inc. | |
      2. 10.3.2 Thermo Fisher Scientific | |
      3. 10.3.3 F. Hoffmann-La Roche | |
      4. 10.3.4 Laboratory Corporation of America | |
      5. 10.3.5 Quest Diagnostics | |
      6. 10.3.6 QIAGEN N.V. | |
      7. 10.3.7 Myriad Genetics | |
      8. 10.3.8 Natera, Inc. | |
      9. 10.3.9 BGI Genomics | |
      10. 10.3.10 Agilent Technologies | |
      11. 10.3.11 Eurofins Scientific | |
      12. 10.3.12 Revvity, Inc.
  11. 11 Recent News & Developments
  12. 12 Report Scope & Methodology |
    1. 12.1 Study Period & Base Year |
    2. 12.2 Data Sources & Triangulation |
    3. 12.3 Abbreviations
  13. 13 Detailed Sources & Citations
  14. 14 Frequently Asked Questions
  15. 15 LIST OF TABLES |
  16. TABLE 1 Global Genetic Testing Market Size & Forecast, by Revenue (USD Billion), 2021–2035 |
  17. TABLE 2 Global Genetic Testing Market – Year-over-Year Growth Analysis, 2021–2035 |
  18. TABLE 3 Driver Impact Analysis Matrix, 2026–2035 |
  19. TABLE 4 Restraint Impact Analysis Matrix, 2026–2035 |
  20. TABLE 5 Global Market Size, by Region, 2021–2035 (USD Billion) |
  21. TABLE 6 North America Market Size, by Country, 2021–2035 (USD Billion) |
  22. TABLE 7 Europe Market Size, by Country, 2021–2035 (USD Billion) |
  23. TABLE 8 Asia-Pacific Market Size, by Country, 2021–2035 (USD Billion) |
  24. TABLE 9 South America Market Size, by Country, 2021–2035 (USD Billion) |
  25. TABLE 10 Middle East & Africa Market Size, by Country, 2021–2035 (USD Billion) |
  26. TABLE 11 Global Market Size, by Product & Service, 2021–2035 (USD Billion) |
  27. TABLE 12 Global Market Size, by Test Type, 2021–2035 (USD Billion) |
  28. TABLE 13 Global Market Size, by Technology, 2021–2035 (USD Billion) |
  29. TABLE 14 Global Market Size, by Application, 2021–2035 (USD Billion) |
  30. TABLE 15 Global Market Size, by End User, 2021–2035 (USD Billion) |
  31. TABLE 16 North America Market Size, by Technology, 2021–2035 (USD Billion) |
  32. TABLE 17 Europe Market Size, by Application, 2021–2035 (USD Billion) |
  33. TABLE 18 Asia-Pacific Market Size, by Test Type, 2021–2035 (USD Billion) |
  34. TABLE 19 South America Market Size, by End User, 2021–2035 (USD Billion) |
  35. TABLE 20 Middle East & Africa Market Size, by Product & Service, 2021–2035 (USD Billion) |
  36. TABLE 21 Competitive Benchmarking Matrix, 2026 |
  37. TABLE 22 Company Profiles – Key Players |
  38. TABLE 23 Recent Developments & Strategic Announcements, 2023–2025 |
  39. TABLE 24 Report Scope & Methodology Summary |
  40. TABLE 25 Detailed Sources & Citations Index
  41. 16 LIST OF FIGURES |
  42. FIGURE 1 Market Dynamics – Drivers, Restraints, Opportunities and Challenges |
  43. FIGURE 2 Industry Value Chain Analysis |
  44. FIGURE 3 Porter's Five Forces Analysis |
  45. FIGURE 4 Global Market Size Trend and Forecast, 2021–2035 (USD Billion) |
  46. FIGURE 5 Year-over-Year Growth Trajectory, 2022–2035 (%) |
  47. FIGURE 6 Market Share by Product & Service, 2025 vs 2035 (%) |
  48. FIGURE 7 Market Share by Test Type, 2025 (%) |
  49. FIGURE 8 Market Share by Technology, 2025 vs 2035 (%) |
  50. FIGURE 9 Market Share by Application, 2025 (%) |
  51. FIGURE 10 Market Share by End User, 2025 (%) |
  52. FIGURE 11 Regional Revenue Share, 2025 (%) |
  53. FIGURE 12 Regional CAGR Comparison, 2026–2035 (%) |
  54. FIGURE 13 North America Country-Level Revenue Split, 2025 (%) |
  55. FIGURE 14 Asia-Pacific Country-Level Growth Comparison, 2026–2035 (%) |
  56. FIGURE 15 Competitive Landscape – Estimated Revenue Share Bands, 2026 |
  57. FIGURE 16 Strategic Positioning Map – Platform Scale vs Clinical Menu Breadth |
  58. FIGURE 17 Reimbursement Coverage Maturity by Region, 2025 |
  59. FIGURE 18 Sequencing Cost per Genome Trend, 2015–2035
Share::
Request Free Sample

Segmentation Quick Reference

DimensionSub-SegmentsDominant SegmentFastest Growing Segment
By Product & ServiceConsumables and Reagents; Equipment and Instruments; Software and ServicesConsumables and ReagentsSoftware and Services
By Test TypeDiagnostic; Prenatal & Newborn; Predictive & Presymptomatic; Carrier; Nutrigenomic; Pharmacogenomic; Relationship & AncestryDiagnostic TestingPredictive & Presymptomatic Testing
By TechnologyNGS; PCR; Array Technology; Sanger Sequencing; FISH; Other TechnologiesNext-Generation SequencingNext-Generation Sequencing
By ApplicationOncology; Genetic Disease Diagnosis; Reproductive Health; Cardiovascular; Infectious Disease; Other ApplicationsOncologyReproductive Health
By End UserHospitals & Clinics; Diagnostic Laboratories; Research & Academic Institutes; Direct-to-Consumer; Other End UsersHospitals & ClinicsDirect-to-Consumer
By RegionNorth America; Europe; Asia-Pacific; South America; Middle East & AfricaNorth AmericaAsia-Pacific


Market Segmentation Overview

By Product & Service

Sub-SegmentKey Trend
Consumables and ReagentsPer-test reagent pricing compresses while unit volume expands, protecting absolute revenue
Equipment and InstrumentsBenchtop systems decentralize capacity into mid-volume hospital laboratories
Software and ServicesInterpretation outsourcing and informatics licensing convert to recurring revenue


Product economics increasingly favour recurring streams. Instrument vendors accept thin hardware margins to secure downstream reagent lock-in, and the fastest-growing line item is now the software layer that converts raw sequence into a clinically usable report.

By Test Type

Sub-SegmentKey Trend
Diagnostic TestingStrongest reimbursement position; anchors laboratory revenue stability
Prenatal & Newborn TestingCell-free DNA screening approaching universal adoption in high-income systems
Predictive & Presymptomatic TestingCascade testing after index cases multiplies volume per family
Carrier TestingExpanded preconception panels replace ethnicity-based screening
Nutrigenomic TestingConsumer wellness demand with limited clinical reimbursement
Pharmacogenomic TestingPreemptive panels integrated into electronic prescribing workflows
Relationship & Ancestry TestingDiscretionary consumer spending; sensitive to macroeconomic cycles


Test-type mix is shifting from reactive to anticipatory. Diagnostic volumes remain the revenue base, but the growth story sits with predictive, carrier, and newborn categories where a single index case generates repeat testing across a family or cohort.

By Technology

Sub-SegmentKey Trend
Next-Generation SequencingCost curve continues downward; long-read adds structural variant resolution
Polymerase Chain ReactionRetains dominance where sub-day turnaround is clinically required
Array TechnologyStable cytogenetic niche with below-market growth
Sanger SequencingConfirmatory role shrinking as sequencing accuracy improves
Fluorescence In Situ HybridizationEntrenched in haematological malignancy workflows
Other TechnologiesOptical mapping and methylation profiling entering clinical validation


Chemistry choice now follows clinical urgency rather than capability. Sequencing takes the comprehensive cases, amplification-based methods take the time-critical ones, and legacy cytogenetic techniques persist where regulatory validation makes replacement costly.

By Application

Sub-SegmentKey Trend
OncologyCompanion diagnostic mandates convert guidelines directly into test orders
Genetic Disease DiagnosisHealth-economic evidence on diagnostic odyssey reduction drives payer support
Reproductive HealthPreimplantation and prenatal screening expand across private and public channels
CardiovascularInherited cardiomyopathy and arrhythmia panels gain guideline traction
Infectious DiseasePathogen genomics and antimicrobial resistance profiling scale post-pandemic
Other ApplicationsNeurology, ophthalmology, and immunology panels build indication-specific evidence


Applications with a clear therapeutic consequence attract reimbursement first. Oncology proved that link, and cardiovascular and reproductive health are following the same evidence-to-coverage sequence.

By End User

Sub-SegmentKey Trend
Hospitals & ClinicsIn-house molecular pathology build-out reduces send-out dependency
Diagnostic LaboratoriesScale economics and payer contract depth sustain reference volumes
Research & Academic InstitutesGrant-funded cohort sequencing supports instrument demand
Direct-to-ConsumerChannel maturing under tighter privacy and consent scrutiny
Other End UsersPharmaceutical and contract research organisations expand trial-linked testing


Buyer power is migrating toward integrated delivery networks that can insource high-volume assays while outsourcing complex ones. Reference laboratories are responding by competing on menu depth and interpretation quality rather than price alone.

By Region

Sub-SegmentKey Trend
North AmericaReimbursement breadth sustains leadership despite per-test price pressure
EuropeIVDR compliance reshapes supplier mix toward certified commercial kits
Asia-PacificDomestic instrument manufacturing and national programs accelerate volume
South AmericaPublic molecular pathology hubs extend access beyond major metros
Middle East & AfricaSovereign genome programs anchor demand ahead of commercial channels


Geographic momentum is diverging from geographic scale. North America still books the most revenue, but the incremental growth increasingly originates from Asia-Pacific and Gulf programs where public funding, not private insurance, sets the pace.




Share::
Request Free Sample
Download PDF ×

We do not share your information with anyone. However, we may send you emails based on your report interest from time to time. You may contact us at any time to opt-out.