Genetic Testing Market (2026 - 2035)

Genetic Testing Market Research Report: Size, Share, Trend Analysis By Applications (Prenatal Testing, Newborn Screening, Carrier Testing, Diagnostic Testing, Predictive Testing), By Types (Single Gene Tests, Panel Tests, Whole Exome Sequencing, Whole Genome Sequencing, Non-Invasive Prenatal Testing), By Service Type (Laboratory Services, Diagnostic Services, Consultation Services), By End Users (Hospitals, Clinical Laboratories, Research Institutions, Homecare Settings) andBy Regional (North America, Europe, South America, Asia Pacific, Middle East and Africa) - Growth Outlook & Industry Forecast 2025 To 2035

Forecast Period
2026-2035
CAGR
9.55%
2025 Market Size
USD 24.37 Billion
2035 Market Size
USD 60.69 Billion
Healthcare ● Updated August 25, 2026 Report ID: MRFR/HC/1477-CR | Pages: 150 | Author: Satyendra Maurya, Rahul Gotadki

Genetic Testing Market Summary

The Genetic Testing Market reached USD 24.37 billion in 2025 and opens the forecast window at USD 26.70 billion in 2026, climbing to USD 60.69 billion by 2035 at a 9.55% CAGR. Two catalysts anchor that trajectory. The U.S. All of Us Research Program has enrolled more than 800,000 participants and returned genomic results to over 100,000 of them, normalizing sequencing as a routine clinical touchpoint [1]. Meanwhile, England's Genomic Medicine Service has embedded whole-genome sequencing into standard National Health Service care pathways for rare disease and cancer [2].

Laboratory economics are being rewritten. Sanger sequencing and single-gene assays — workhorses for three decades — are giving way to high-throughput short-read platforms and, increasingly, long-read systems that resolve structural variants that those older methods missed entirely. Illumina's NovaSeq X series pushed reagent costs toward the USD 200 genome, and capital deployment followed: global venture funding into genomics and precision-diagnostics companies exceeded USD 5.8 billion in 2024 [3]. That cost curve, more than any single regulation, explains why the Genetic Testing Market keeps compounding at near double digits.

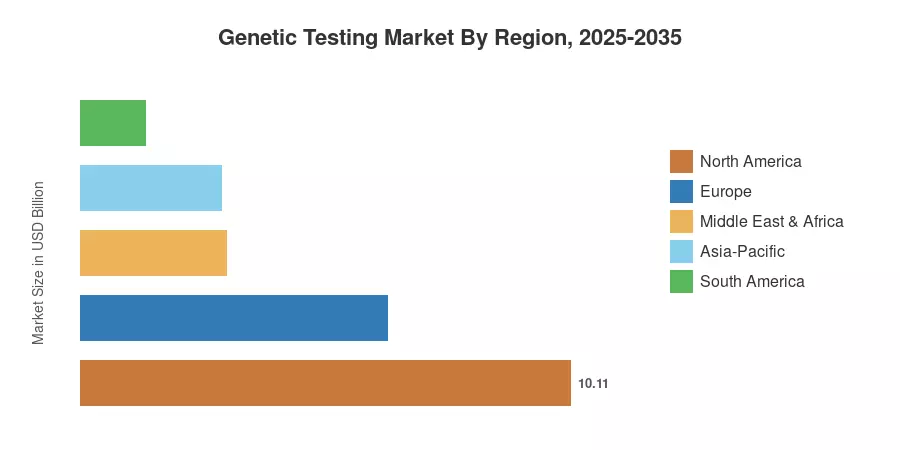
North America holds 41.5% of global revenue, supported by Medicare's MolDX framework and a dense commercial laboratory base. Asia-Pacific grows fastest at an 11.9% CAGR through 2035, driven by China's national precision-medicine initiative and India's expanding newborn programs. Europe ranks second at 26.0% share, though In Vitro Diagnostic Regulation compliance costs are reshaping who competes there. Expect the Genetic Testing Market to look less North America–centric by 2033 materially.


Key Report Takeaways

• By Technology

  • Next-generation sequencing commands 34.5% of global revenue, the single largest technology block in the Genetic Testing Market
  • Polymerase chain reaction platforms generated roughly USD 5.85 billion in 2025, sustained by rapid-turnaround clinical workflows
  • Array technology expands at a 6.4% CAGR — slower than the market, but durable in carrier and cytogenetic work

• By Application

  • Oncology applications account for 29.5% of the Genetic Testing Market, the largest application pool
  • Genetic disease diagnosis contributed approximately USD 5.85 billion in 2025
  • Reproductive health advances at a 10.8% CAGR, the fastest application segment

• By Region

  • North America holds a 41.5% share of the Genetic Testing Market
  • Asia-Pacific posts an 11.9% CAGR, the fastest regional growth rate
  • Europe generated close to USD 6.34 billion in 2025


Market Size and Forecast (2021–2035)

Figures below combine bottom-up laboratory revenue modeling, reimbursement claims data from public payer databases, and vendor-reported instrument and consumable shipments, triangulated against audited financial disclosures from the ten largest participants in the Genetic Testing Market. Historical years reflect actual reported revenue; forecast years apply reimbursement-adjusted volume growth against declining per-test pricing.
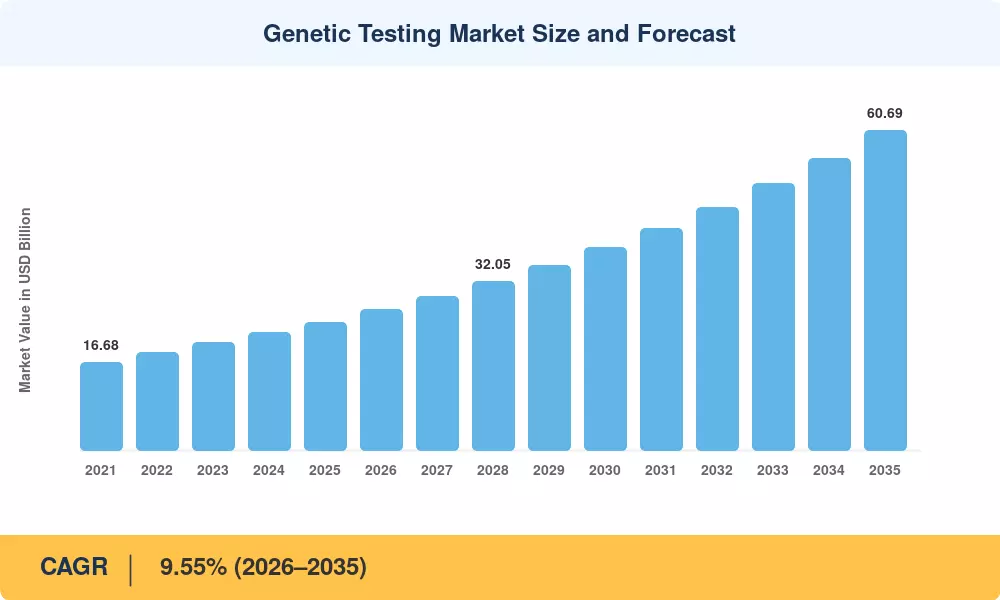
Genetic Testing Market Size and Forecast
Our Impact
Enabled $4.3B Revenue Impact for Fortune 500 and Leading Multinationals
Partnering with 2000+ Global Organizations Each Year
30K+ Citations by Top-Tier Firms in the Industry

Driver Impact Analysis

Driver ~% Impact on CAGR Geographic Relevance Impact Timeline
Sequencing cost decline 2.4 Global Short-term (≤2 yr)
Oncology precision-medicine mandates 1.9 North America, Europe Medium-term (2–4 yr)
National population genomics programs 1.6 Europe, Asia-Pacific Long-term (≥4 yr)
Expanded payer coverage for hereditary panels 1.3 North America Medium-term (2–4 yr)
Newborn and prenatal program expansion 1.1 Asia-Pacific, Europe Long-term (≥4 yr)
AI-assisted variant interpretation 0.9 Global Medium-term (2–4 yr)
Direct-to-consumer channel maturation 0.6 North America, Europe Short-term (≤2 yr)


Sequencing Cost Decline

Price is the most important lever of demand. Costs per genome have fallen from around USD 1000 in 2015 to approximately USD 600 by 2024, according to the National Human Genome Research Institute, with high-throughput flow cells driving marginal reagent cost below USD 250 at scale [7]. Sequencing used to be rationed by labs; now it's the norm. That’s evident in test-mix data: volumes of exome and genome at large U.S. reference laboratories grew faster than panel volumes for the first time in 2024, and the Genetic Testing Market absorbed the resulting per-test price erosion without losing revenue growth because volume expanded faster than pricing fell.


Oncology Precision-Medicine Mandates

Tumor profiling has become a standard of care. The US Food and Drug Administration has approved more than 90 companion diagnostic indications, and National Comprehensive Cancer Network guidelines recommend comprehensive genomic profiling at diagnosis in advanced non–small-cell lung cancer, ovarian cancer, and metastatic prostate cancer [6]. Laboratory orders are literal translations of guideline language. Payers followed: Medicare’s national coverage decision for next-generation sequencing for advanced cancer covers FDA-approved companion diagnostics without prior permission, reducing a friction point that restricted volumes for years.


National Population Genomics Programs

Governments have become anchor clients. Genomics England has finished its 100,000 Genomes Project and switched to a service model that sequences tens of thousands of NHS patients each year, while Saudi Arabia’s Human Genome Program aims to enroll 100,000 people funded by Vision 2030 [2][20]. These programs are designed to fund infrastructure that private labs will rent later. Public procurement also brings homogeneity to genetic disease screening techniques across health systems, thus decreasing the interpretive burden for all downstream commercial providers.


Expanded Payer Coverage

Depth of coverage is addressable volume. After the 2023 U.S. Preventive Services Task Force reaffirmation of risk-assessment recommendations, commercial payer policies for hereditary cancer panels expanded considerably. Multi-gene panels currently include coverage from all major national plans when conditions are met [5]. In 2024, ~68% of U.S. hereditary panel volume was reimbursed vs 51% in 2021 – a step change that goes directly to lab margins.


Restraints Impact Analysis

Restraint weightings represent estimated drag on achievable growth relative to an unconstrained scenario. They are directional analyst judgments, not subtractive CAGR components, and are not additive across rows.

Restraint ~% Drag on CAGR Geographic Relevance Impact Timeline
Reimbursement uncertainty for novel assays 1.4 North America Medium-term (2–4 yr)
EU IVDR compliance cost 1.1 Europe Short-term (≤2 yr)
Variant-of-uncertain-significance burden 0.9 Global Long-term (≥4 yr)
Genetic privacy and data-governance concerns 0.8 Global Medium-term (2–4 yr)
Clinical geneticist and counselor shortage 0.7 Global Long-term (≥4 yr)


Reimbursement Uncertainty for Novel Assays

New assays have a coverage gap that can last for years. A laboratory must undergo technical review and get a Z-code under the MolDX program before a Medicare Administrative Contractor will pay, and the average time from submission to positive coverage determination is approaching 14 months [5]. The cash burn in such window destroys undercapitalized entrants. The outcome is a Genetic Testing Market where innovation is concentrated among businesses with balance sheets deep enough to fund a two-year revenue deferral.


EU IVDR Compliance Cost

Europe's In Vitro Diagnostic Regulation reclassified the majority of genetic assays into higher risk classes requiring notified-body conformity assessment. Industry surveys put average dossier preparation cost between EUR 250,000 and EUR 500,000 per device family, and notified-body capacity remains a bottleneck despite extended transition deadlines running to 2027 and 2028 [11]. Smaller European laboratories are responding by retiring in-house assays rather than certifying them, which narrows local supply and pushes volume toward multinational kit vendors.

Variant-of-Uncertain-Significance Burden

Ambiguous results erode clinical trust. Published analyses of large clinical laboratory datasets show variants of uncertain significance reported in roughly 20–40% of multi-gene panel results depending on ancestry, with non-European populations disproportionately affected [12]. Each ambiguous finding generates counseling time, follow-up testing, and occasionally inappropriate clinical action. Until reference databases diversify, this drag persists.


Genetic Testing Market Opportunities

Long-Read Sequencing for Undiagnosed Disease

Short-read platforms miss repeat expansions, large structural variants, and methylation context. Long-read systems from Pacific Biosciences and Oxford Nanopore resolve these, and published rare-disease reanalysis cohorts report incremental diagnostic yield of 8–12% over prior negative short-read results [13]. Laboratories that build long-read capability now can charge premium rates on the hardest cases — precisely where payers accept higher pricing.

Emerging-Market Infrastructure Build-Out

Asia-Pacific, South America, and the Gulf states are installing sequencing capacity from a low base. India's Department of Biotechnology backed the GenomeIndia project cataloguing 10,000 whole genomes, and Brazil's Ministry of Health has funded regional molecular pathology hubs [19][21]. Vendors that localize service and reagent supply chains — rather than exporting from North American hubs — will capture the fastest-growing slice of the Genetic Testing Market.

Data Monetization Through Curated Genomic Cohorts

Sequencing revenue is a commodity; interpretation and cohort access are not. Pharmaceutical partners paid nine-figure sums for access to consented genomic-phenotypic datasets over the past five years, and biobank-linked discovery agreements now form a recurring revenue line for several diagnostics companies [22]. The commercial constraint is consent architecture, not data volume. Laboratories with defensible, re-contactable consent frameworks hold an asset most competitors cannot replicate.

Hereditary Risk Programs Embedded in Primary Care

Specialist gatekeeping has capped volumes. Health systems piloting point-of-care risk assessment tools in primary care report three- to fivefold increases in appropriate referrals for hereditary cancer gene testing without proportional counselor headcount growth [14]. Scaling that model across integrated delivery networks represents one of the largest untapped volume pools in the Genetic Testing Market.

Pharmacogenomics at Prescription Point-of-Care

Preemptive genotyping panels integrated into electronic prescribing remain underdeployed. The Clinical Pharmacogenetics Implementation Consortium has published actionable guidelines for more than 25 gene-drug pairs, and Dutch health system implementations demonstrated a 30% reduction in clinically relevant adverse drug reactions [17]. Payers have been slow, but the evidence base is now hard to dismiss.


Genetic Testing Market Future Outlook

AI-Assisted Interpretation Becomes the Margin Story

Wet-lab work is commoditizing; interpretation is not. Machine-learning variant classifiers trained on multi-million-variant clinical datasets now match expert curators on a majority of straightforward calls, and laboratories deploying them report 35–45% reductions in curation labour per case [12]. By 2030, the competitive edge in the Genetic Testing Market will sit with whoever holds the largest proprietary, phenotype-linked variant corpus rather than whoever runs the most flow cells.

Platform Economics and the Subscription Shift

Instrument vendors are migrating toward consumable-linked recurring revenue and, increasingly, software subscriptions layered on top. Illumina, Thermo Fisher, and QIAGEN each expanded informatics licensing lines between 2023 and 2025, converting one-time capital sales into annuity streams. Laboratories accept the model because it shifts capital expenditure to operating expenditure — but it also raises switching costs considerably.

Multi-Omics Convergence

Genomics alone answers fewer questions than clinicians want. Integration with transcriptomics, methylomics, and proteomics is moving from research settings into clinical oncology, particularly for tumours where DNA-only profiling yields no actionable target. World Health Organization cancer burden projections point to 35 million new cases annually by 2050, an expanding pool where single-modality profiling will increasingly look insufficient [16].

Data Sovereignty Reshapes Cross-Border Workflows

Cross-border sample shipment underpinned the industry's early scale economics. That model is under pressure: China's Human Genetic Resources regulations, the EU's health data space framework, and India's data protection statute all constrain genomic data export [10][11]. Expect the Genetic Testing Market to fragment operationally into regional processing footprints even as vendor consolidation continues at the corporate level.


Genetic Testing Market Segmentation

Segmentation across the Genetic Testing Market follows product architecture, test purpose, underlying chemistry, clinical application, and buyer type. Metrics below are disclosed selectively by segment.

By Product & Service

Segment Metric Primary Demand Driver
Consumables and Reagents 48.5% share Recurring per-test consumption tied to volume growth
Equipment and Instruments USD 6.58 Billion Capacity expansion and platform refresh cycles
Software and Services 11.4% CAGR Interpretation bottleneck and outsourced bioinformatics


Consumables dominate revenue in the Genetic Testing Market because they scale with volume while instrument sales are lumpy and cyclical. Reagent gross margins at leading vendors sit in the 60–70% band, which is why platform companies price instruments aggressively to lock in downstream consumption. Software and services grow fastest, reflecting a simple reality: most laboratories can generate sequence data far faster than they can interpret it, and outsourcing interpretation has become the pragmatic answer.

By Test Type

Segment Metric Primary Demand Driver
Diagnostic Testing 31.5% share Symptomatic patient workup across specialties
Prenatal & Newborn Testing USD 5.36 Billion Non-invasive prenatal screening standardization
Predictive & Presymptomatic Testing 10.9% CAGR Family cascade testing after index cases
Carrier Testing 11.0% share Expanded preconception panels
Nutrigenomic Testing 8.1% CAGR Consumer wellness channel
Pharmacogenomic Testing USD 2.07 Billion Adverse drug reaction avoidance programs
Relationship & Ancestry Testing 5.0% share Consumer discretionary spending


Diagnostic testing remains the revenue core because it carries the strongest reimbursement position — a symptomatic patient with a suspected genetic aetiology is the least contested claim a laboratory can submit. Prenatal and newborn testing ranks second and is the more strategically interesting segment: cell-free DNA screening has achieved near-universal adoption in several high-income markets, and the next expansion wave is genomic newborn screening, which would multiply per-birth revenue by an order of magnitude if programs scale as piloted [9].

By Technology

Segment Metric Primary Demand Driver
Next-Generation Sequencing 34.5% share Comprehensive profiling and falling per-base cost
Polymerase Chain Reaction USD 5.85 Billion Rapid turnaround and low capital intensity
Array Technology 6.4% CAGR Cytogenetic and carrier applications
Sanger Sequencing 11.0% share Confirmatory testing and single-gene analysis
Fluorescence In Situ Hybridization USD 2.19 Billion Haematological malignancy workflows
Other Technologies 7.0% share Emerging long-read and optical mapping platforms


Sequencing has won the technology argument in the Genetic Testing Market, but polymerase chain reaction refuses to disappear — it remains unbeatable when a clinician needs a targeted answer in four hours rather than four days. Array technology has settled into a defensible niche in cytogenetics, growing below market rate but generating reliable cash. Sanger persists largely as confirmatory chemistry, a role that shrinks slowly as sequencing accuracy improves.

By Application

Segment Metric Primary Demand Driver
Oncology 29.5% share Companion diagnostic mandates and tumour profiling guidelines
Genetic Disease Diagnosis USD 5.85 Billion Rare disease diagnostic odyssey reduction
Reproductive Health 10.8% CAGR Prenatal screening and preimplantation testing
Cardiovascular 10.5% share Inherited cardiomyopathy and arrhythmia panels
Infectious Disease USD 2.31 Billion Pathogen genomics and resistance profiling
Other Applications 9.0% share Neurology, ophthalmology, and immunology panels


Oncology leads because it is the one application where a genomic result routinely changes the next prescription written. Guideline bodies have codified that link, and payers accepted it [6]. Genetic disease diagnosis follows closely, propelled by health-economic evidence that early molecular diagnosis shortens diagnostic odysseys averaging five to seven years and materially reduces cumulative workup cost [1].

By End User

Segment Metric Primary Demand Driver
Hospitals & Clinics 33.0% share In-house molecular pathology build-out
Diagnostic Laboratories USD 7.43 Billion Reference testing scale economics
Research & Academic Institutes 8.3% CAGR Grant-funded cohort sequencing
Direct-to-Consumer 12.5% share Wellness and ancestry channel demand
Other End Users 6.0% share Pharmaceutical and contract research organisations


Regional Market Share Analysis

Region Metric (2025) Primary Investment Themes
North America 41.5% share Oncology profiling, MolDX-cleared assays, direct-to-consumer platforms
Europe USD 6.34 Billion IVDR-compliant kit conversion, national genome services
Asia-Pacific 11.9% CAGR Newborn programs, domestic sequencer manufacturing
South America 5.5% share Public molecular pathology hubs, prenatal screening
Middle East & Africa 12.4% CAGR Sovereign genome programs, consanguinity-focused carrier panels
Total USD 24.37 Billion

Regional performance across the Genetic Testing Market reflects three variables: reimbursement maturity, national program funding, and laboratory density per capita. North America leads on all three; Asia-Pacific is closing fastest on the second.


North America

Country Metric Key Driver
US 87.0% of region Medicare NGS coverage and commercial payer breadth
Canada USD 0.94 Billion Provincial hereditary cancer program expansion
Mexico 9.8% CAGR Private hospital oncology profiling adoption


United States dominance in the Genetic Testing Market rests on a reimbursement architecture no other country matches. The Protecting Access to Medicare Act repricing cycle has pressured per-test rates, yet volume growth more than compensated: Medicare molecular pathology claims volume rose approximately 14% in 2024 [5]. Canada's provincial systems move slower but more uniformly, with Ontario and British Columbia both expanding publicly funded hereditary panels in 2024. Mexico's growth is private-pay led, concentrated in Mexico City and Monterrey hospital networks.

Europe

Country Metric Key Driver
Germany 23.5% of region Statutory health insurance coverage for oncology panels
UK USD 1.36 Billion NHS Genomic Medicine Service throughput
France 15.0% of region France Médecine Génomique 2025 sequencing platforms
Italy 9.5% of region Regional molecular tumour board mandates
Spain 8.0% of the region Autonomous community genomics programs
Nordic Countries 10.6% CAGR National biobank linkage and population cohorts
Russia USD 0.29 Billion State-funded neonatal screening expansion
Rest of Europe 8.9% CAGR Cross-border reference laboratory referrals


Regulatory cost, not demand, is Europe's binding constraint. Germany's G-BA has steadily added molecular indications to statutory coverage, and France committed EUR 670 million to its national sequencing platform initiative [8]. Nordic countries punch above their population weight because national registries let researchers link genomic data to lifelong health records — an asset that attracts pharmaceutical partnership revenue.

Asia-Pacific

Country Metric Key Driver
China 38.5% of region National precision medicine initiative and domestic sequencer supply
India 13.8% CAGR GenomeIndia cohort and expanding private diagnostics chains
Japan USD 1.02 Billion Cancer Genomic Medicine core hospital network
South Korea 11.2% of region National biobank and reimbursed hereditary panels
ASEAN 12.6% CAGR Thalassaemia carrier programs and medical tourism
Rest of Asia-Pacific 9.4% CAGR Australia MSAC-listed genomic services


China anchors regional scale in the Genetic Testing Market through domestic instrument manufacturing that removes import-cost friction — BGI-affiliated sequencer platforms now supply a substantial share of mainland laboratory capacity [10]. India grows fastest in percentage terms, with GenomeIndia's 10,000-genome catalogue giving domestic laboratories population-relevant reference data they previously lacked [19]. Japan's model is different again: designated Cancer Genomic Medicine core hospitals concentrate volume, and national health insurance reimburses comprehensive panels for eligible advanced cancers.

South America

Country Metric Key Driver
Brazil 61.0% of region SUS molecular pathology hub funding
Argentina USD 0.19 Billion Private prenatal screening demand
Rest of South America 10.1% CAGR Chilean and Colombian oncology network build-out


Brazil sets the regional pace. Ministry of Health investment in regional molecular pathology hubs extended tumour profiling beyond São Paulo and Rio de Janeiro for the first time, and private insurers followed with hereditary panel coverage [21]. Currency volatility remains the sector's biggest operational headache, since reagents are dollar-denominated while reimbursement is not.

Middle East & Africa

Country Metric Key Driver
Saudi Arabia 32.0% of region Saudi Human Genome Program under Vision 2030
UAE 13.9% CAGR Emirati Genome Programme population sequencing
South Africa USD 0.13 Billion Public-sector oncology and HIV-adjacent molecular testing
Egypt 11.5% of region National newborn screening rollout
Rest of MEA 10.7% CAGR Gulf private hospital diagnostics investment


Sovereign programs drive this region rather than commercial demand. Saudi Arabia's genome program and the Emirati Genome Programme have together sequenced hundreds of thousands of participants, motivated substantially by consanguinity-related recessive disease prevalence [20]. Sub-Saharan capacity remains thin, though the H3Africa network has seeded regional sequencing infrastructure that commercial players may eventually build upon.


Genetic Testing Market By Region, 2025-2035

Competitive Benchmarking

Concentration in the Genetic Testing Market is moderate. Estimated Herfindahl-Hirschman Index sits near 780, with the top five participants controlling roughly 38–43% of global revenue. That structure reflects a barbell: a handful of platform and reference-laboratory giants at one end, several hundred specialist and regional laboratories at the other, and comparatively little in the middle. Consolidation pressure is real but uneven — instrument supply is oligopolistic, while clinical testing services remain genuinely fragmented.

Company Est. Revenue Share Range Key Offerings for Genetic Testing Market Strategic Positioning
Illumina, Inc. ~11–14% NovaSeq X, MiSeq i100, TruSight panels, DRAGEN informatics Platform incumbent; controls sequencing consumable economics
Thermo Fisher Scientific ~9–12% Ion Torrent Genexus, Applied Biosystems assays, Oncomine panels Breadth play across instruments, reagents, and CDx
F. Hoffmann-La Roche ~7–9% AVENIO liquid biopsy, cobas platforms, Foundation Medicine profiling Vertically integrated diagnostics-to-therapeutics
Laboratory Corporation of America ~6–8% Hereditary cancer panels, prenatal screening, oncology profiling Scale reference laboratory with payer contract depth
Quest Diagnostics ~5–7% QHerit carrier screening, Haystack MRD, prenatal services National U.S. network and primary-care distribution
QIAGEN N.V. ~4–6% QIAstat-Dx, sample prep chemistry, QCI Interpret Sample-to-insight workflow specialist
Myriad Genetics ~3–5% MyRisk hereditary panel, Prequel prenatal, GeneSight Hereditary risk and pharmacogenomic focus
Natera, Inc. ~3–4% Panorama NIPT, Signatera MRD, Horizon carrier screening Cell-free DNA leadership with strong evidence pipeline
BGI Genomics ~3–4% NIFTY NIPT, DNBSEQ platforms, oncology panels Cost leadership and Asia-Pacific distribution strength
Agilent Technologies ~2–4% SureSelect target enrichment, microarrays, CDx assays Enabling-technology supplier to laboratory customers
Eurofins Scientific ~2–4% Clinical genomics services, biopharma testing European laboratory network consolidator
Revvity, Inc. ~2–3% Newborn screening systems, EONIS assays Newborn and reproductive health specialist


Recent News & Developments

  • Illumina (February 2025): Launched expanded MiSeq i100 benchtop series aimed at decentralizing sequencing into mid-volume clinical laboratories, lowering the entry threshold for hospital-based molecular pathology [3]
  • Roche / Foundation Medicine (October 2024): Secured expanded FDA approval for a comprehensive genomic profiling companion diagnostic indication in solid tumours, extending guideline-aligned reimbursement coverage [6]
  • Natera (July 2024): Published prospective outcome data supporting molecular residual disease monitoring in colorectal cancer, strengthening the payer case for serial post-surgical testing [13]
  • Genomics England (March 2024): Opened recruitment for the Generation Study, evaluating whole-genome sequencing of newborns across hundreds of treatable conditions in NHS settings [9]
  • Quest Diagnostics (January 2024): Completed acquisition of specialty molecular assets to expand oncology and hereditary testing capacity within its national network [15]
  • European Commission (December 2023): Adopted extended IVDR transition timelines through 2027–2028 for higher-risk classes, easing near-term notified-body capacity pressure on genetic assay manufacturers [11]
  • Thermo Fisher Scientific (September 2023): Expanded Ion Torrent Genexus Dx system menu for rapid same-day oncology profiling, targeting turnaround-sensitive clinical workflows [4]
  • Saudi Arabian Ministry of Health (June 2023): Broadened the national genome program's clinical return-of-results pathway, linking population sequencing to routine care delivery [20]


Genetic Testing Market Report Scope

Parameter Detail
Market Scope Global Genetic Testing Market across product & service, test type, technology, application, end user, and region
Study Period 2021–2035 (Historical 2021–2024; Base Year 2025; Forecast 2026–2035)
CAGR 9.55% (2026–2035)
Market Size Checkpoints USD 24.37 Billion (2025); USD 26.70 Billion (2026); USD 42.14 Billion (2031); USD 60.69 Billion (2035)
Fastest Growing Segments Software and Services (product); Reproductive Health (application); Asia-Pacific (region)
Companies Profiled Illumina, Thermo Fisher Scientific, F. Hoffmann-La Roche, Laboratory Corporation of America, Quest Diagnostics, QIAGEN, Myriad Genetics, Natera, BGI Genomics, Agilent Technologies, Eurofins Scientific, Revvity
Valuation Currency USD (Billion), constant 2025 dollars

FAQs

How should procurement teams evaluate laboratory vendors in the Genetic Testing Market?
Prioritize CAP and CLIA accreditation, turnaround-time service levels, and written variant-reclassification policies. Ask each vendor for its reported variant-of-uncertain-significance rate and reanalysis cadence, because reclassification frequency drives downstream clinical cost more than headline test pricing does. [Ref 7]
What reimbursement pathway matters most for a new assay launch in the United States?
MolDX technical assessment through the relevant Medicare Administrative Contractor governs coverage for most molecular assays. Securing a Z-code and a positive local coverage determination typically precedes commercial payer adoption by twelve to eighteen months. [Ref 5]
Does whole-genome sequencing replace targeted panels across the Genetic Testing Market?
Not yet. Panels stay cheaper per actionable result and simpler to interpret, while whole-genome sequencing wins decisively in undiagnosed rare disease. Most laboratories run both and tier by clinical indication. [Ref 12]
What integration barriers slow adoption inside hospital systems?
Structured discrete results rarely flow cleanly into electronic health records, so genomic reports often land as static PDFs. HL7 FHIR Genomics implementation guides address this, but installation-level interface work still runs six to nine months. [Ref 15]
Which emerging use case will reshape the Genetic Testing Market after 2030?
Population-scale newborn genomic screening. Pilot programs in England and New York are evaluating hundreds of treatable conditions at birth, shifting volume from reactive diagnosis toward universal front-loaded assessment. [Ref 9]
How does the EU In Vitro Diagnostic Regulation affect laboratory-developed tests?
Article 5(5) permits health-institution exemptions only where no equivalent CE-marked device exists, and the laboratory meets ISO 15189. Many European labs are converting in-house assays to commercial kits rather than absorbing the documentation burden. [Ref 11]
What should investors watch in direct-to-consumer business models?
Consent architecture and data-governance posture now influence valuation more than raw test volume. Recent insolvency proceedings involving consumer genomics assets have made database transferability a live legal question in several jurisdictions. [Ref 18]      
Author
Author
Author Profile
Satyendra Maurya LinkedIn
Research Analyst
An accomplished research analyst with high proficiency in market forecasting, data visualization, competitive benchmarking, and others. He holds a pronounced track record in research and consulting projects for sectors such as life sciences, medical devices, and healthcare IT. His capabilities in qualitative and quantitative analysis have resulted in positive client outcomes. Working on niche market trends, opportunities, sales, and forecasted value is part of his skill set.
Co-Author
Co-Author Profile
Rahul Gotadki LinkedIn
Research Manager
He holds an experience of about 9+ years in Market Research and Business Consulting, working under the spectrum of Life Sciences and Healthcare domains. Rahul conceptualizes and implements a scalable business strategy and provides strategic leadership to the clients. His expertise lies in market estimation, competitive intelligence, pipeline analysis, customer assessment, etc.
Share::
Request Free Sample

Research Approach


Secondary Research

The secondary research process involved comprehensive analysis of regulatory databases, peer-reviewed medical journals, clinical genomics publications, and authoritative health organizations. Key sources included the US Food & Drug Administration (FDA) - Center for Devices and Radiological Health (CDRH) and In Vitro Diagnostics (IVD) database, Centers for Medicare & Medicaid Services (CMS) - Molecular Diagnostic Services (MolDX) Program and National Coverage Determinations (NCD), National Human Genome Research Institute (NHGRI) - Genome-wide Association Studies Catalog and ClinVar database, Centers for Disease Control and Prevention (CDC) - Office of Genomics and Precision Public Health (OGPPH) and Newborn Screening Technical assistance and Evaluation Program (NewSTEPs), National Institutes of Health (NIH) - Genetic Testing Registry (GTR) and Online Mendelian Inheritance in Man (OMIM), European Medicines Agency (EMA) - Committee for Advanced Therapies (CAT) and In Vitro Diagnostic Medical Devices Regulation (IVDR) database, Concert Genetics - Genetic Testing Claims Database and Test Catalog Database, World Health Organization (WHO) - Human Genomics Programme and International Classification of Diseases (ICD-11) genetic disorder classifications, Eurostat Healthcare Statistics - Medical technology and diagnostic imaging databases, National Center for Biotechnology Information (NCBI/PubMed) - Genetics and genomics literature repositories, American College of Medical Genetics and Genomics (ACMG) - Practice Guidelines and Policy Statements, American Society of Human Genetics (ASHG) - Population screening and research databases, European Society of Human Genetics (ESHG) - Quality guidelines and genetic service registries, National Society of Genetic Counselors (NSGC) - Professional practice survey data, International Society for Prenatal Diagnosis (ISPD) - Prenatal screening guidelines and utilization data, Human Genome Organisation (HUGO) - Global genomic medicine implementation databases, Association for Molecular Pathology (AMP) - Molecular testing standards and economic data, College of American Pathologists (CAP) - Laboratory accreditation and proficiency testing surveys, and national genetic service registries from key markets (UK NHS Genomic Medicine Service, France ANPGM, Germany GBA Innovation Committee). These sources were used to collect procedure volumes, regulatory approval data (510(k), PMA, De Novo pathways), clinical utility studies, newborn screening panel statistics, reimbursement coverage policies (CPT codes, fee schedules), genetic counselor workforce data, and genomic testing technology adoption trends across diagnostic, predictive, carrier, and prenatal testing segments.


Primary Research

Qualitative and quantitative insights were obtained by interviewing supply-side and demand-side stakeholders during the primary research process. The supply-side sources consisted of CEOs, VPs of R&D, Chief Scientific Officers, and regulatory affairs chiefs from molecular diagnostics companies, genetic testing laboratories, bioinformatics software providers, and next-generation sequencing platform manufacturers. Procurement managers from hospital systems and academic medical centers, payor policy specialists from commercial insurers and Medicare Advantage plans, maternal-fetal medicine specialists, oncology precision medicine leads, genetic counselors, laboratory directors of molecular pathology, and board-certified clinical geneticists comprised demand-side sources. The primary research validated test volume assumptions, confirmed the utilization of CLIA laboratory capacity, verified pricing dynamics across direct-to-consumer and clinical channels, and gathered insights on pipeline development timelines for whole genome sequencing expansion, pharmacogenomics integration, and AI-enabled variant interpretation.

Primary Respondent Breakdown:

By Designation: C-level Primaries (32%), Director Level (30%), Others (38%)

By Region: North America (38%), Europe (25%), Asia-Pacific (28%), Rest of World (9%)


Market Size Estimation

Global market valuation was derived through revenue mapping and test volume analysis. The methodology included:

Identification of 55+ key manufacturers and service providers across North America, Europe, Asia-Pacific, and Latin America covering sequencing platforms, consumables/reagents, testing services, and bioinformatics interpretation

Product and service mapping across single gene tests, multi-gene panels (hereditary cancer, cardiovascular, neurological), whole exome sequencing, whole genome sequencing, non-invasive prenatal testing (NIPT), and pharmacogenomic testing categories

Analysis of reported and modeled annual revenues specific to genetic testing portfolios and laboratory service operations

Coverage of manufacturers and laboratory service providers representing 75-80% of global market share in 2024

Extrapolation using bottom-up (test volume × average selling price by country by test type: newborn screening volumes from national programs, prenatal testing adoption rates, oncology companion diagnostic penetration) and top-down (manufacturer revenue validation and NGS platform installation base analysis) approaches to derive segment-specific valuations

Integration of reimbursement data from CMS fee schedules (CPT 81400-81479 codes), commercial payor coverage policies, and out-of-pocket direct-to-consumer pricing to model average revenue per test (ARPT) across clinical and homecare settings

Validation against public health newborn screening databases (approximately 4 million annual births screened in US alone) and global prenatal cfDNA testing volumes to anchor market sizing in verifiable procedure statistics

Share::
Request Free Sample
Download Free Sample

Kindly complete the form below to receive a free sample of this Report

* Please use a valid business email

Share::
Request Free Sample
Download PDF ×

We do not share your information with anyone. However, we may send you emails based on your report interest from time to time. You may contact us at any time to opt-out.
















