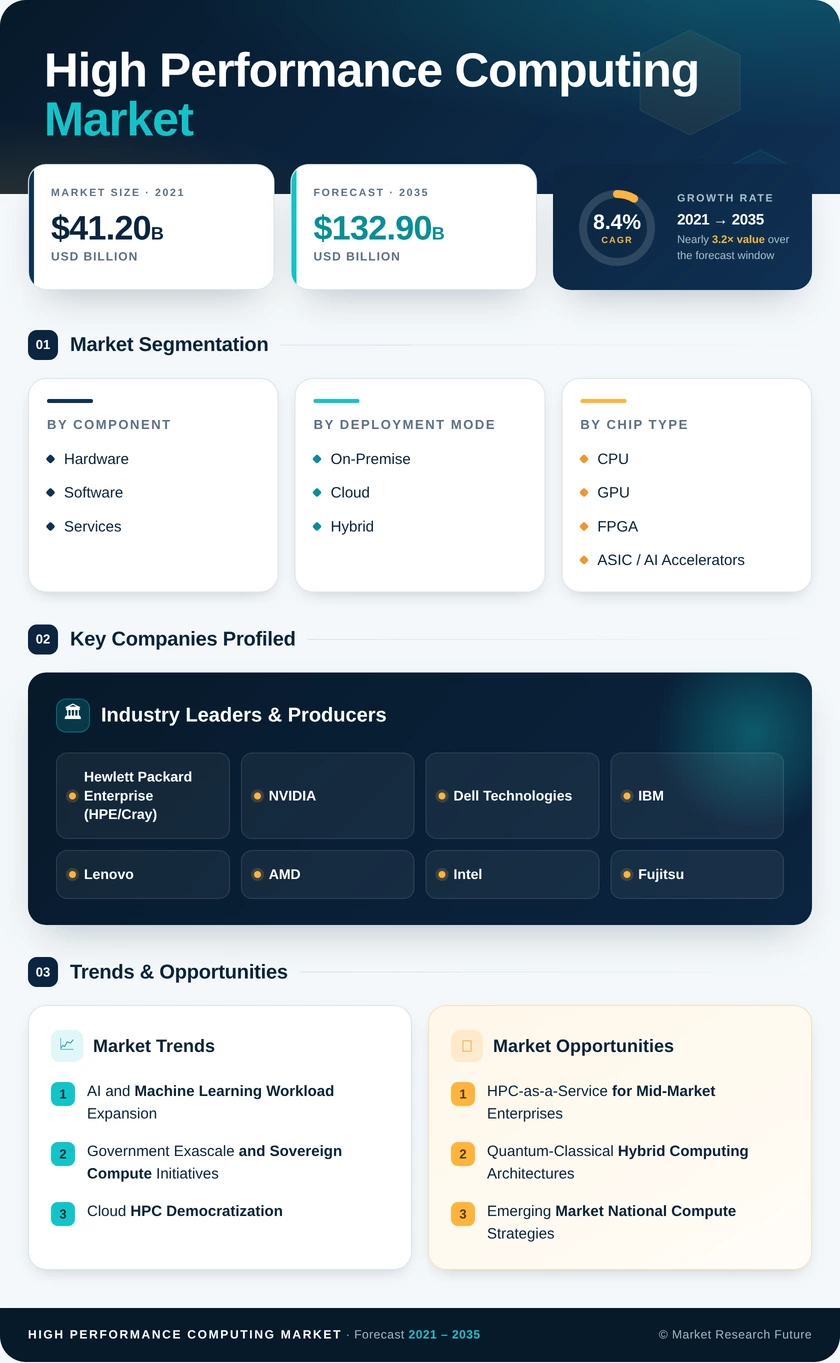
High Performance Computing Market (2026 - 2035)

ID: MRFR/ICT/2005-CR
100 Pages
Aarti Dhapte
Last Updated: July 28, 2026
High Performance Computing Market Size, Share and Research Report Information By Component (Hardware, Software and Services), Hardware (Server, Storage and Networking Device), Software (Analytics, Database Management, Operating System), Services (Professional Services and Managed Services), Deployment (On-premise and Cloud), By Vertical (BFSI, IT, Manufacturing, Healthcare, Retail, Energy, Oil and Gas, Transportation Logistics, Chemicals, Pharmaceuticals, Defense), Region (North America, Europe, Asia-Pacific, Middle East & Africa) - Forecast Till 2035
High Performance Computing Market
Market Size
Forecast Period2026-2035
CAGR (2026-2035)8.4%
2025 Market SizeUSD 59.35 Billion
2035 Market SizeUSD 132.9 Billion
Key Players
Hewlett Packard Enterprise
NVIDIA
Dell Technologies
IBM
Lenovo
AMD
Opportunities
  • HPC-as-a-Service for Mid-Market Enterprises
  • Quantum-Classical Hybrid Computing Architectures
  • Emerging Market National Compute Strategies
  1. 1 Market Overview |
    1. 1.1 Study Assumptions & Market Definition |
    2. 1.2 Scope of the Study |
    3. 1.3 Research Methodology
  2. 2 Market Summary & Key Takeaways
  3. 3 Market Dynamics |
    1. 3.1 Market Drivers Analysis | |
      1. 3.1.1 AI and Machine Learning Workload Expansion | |
      2. 3.1.2 Government Exascale and Sovereign Compute Initiatives | |
      3. 3.1.3 Cloud HPC Democratization | |
      4. 3.1.4 Life Sciences and Pharmaceutical R&D | |
      5. 3.1.5 Climate Modeling and Weather Prediction Mandates | |
      6. 3.1.6 Financial Services Risk Modeling | |
      7. 3.1.7 Autonomous Vehicle Simulation and Digital Twins |
    2. 3.2 Market Restraints Analysis | |
      1. 3.2.1 Power Consumption and Cooling Infrastructure Costs | |
      2. 3.2.2 Semiconductor Export Controls | |
      3. 3.2.3 Workforce Scarcity | |
      4. 3.2.4 Data Security and Sovereignty Compliance | |
      5. 3.2.5 High Total Cost of Ownership |
    3. 3.3 Market Opportunity Analysis | |
      1. 3.3.1 HPC-as-a-Service for Mid-Market Enterprises | |
      2. 3.3.2 Quantum-Classical Hybrid Computing Architectures | |
      3. 3.3.3 Emerging Market National Compute Strategies | |
      4. 3.3.4 Sustainability-Driven Infrastructure Modernization | |
      5. 3.3.5 Data Monetization and Simulation-as-a-Service |
    4. 3.4 Industry Value Chain Analysis |
    5. 3.5 Porter's Five Forces Analysis
  4. 4 Global High Performance Computing Market Size & Forecast (2021–2035) |
    1. 4.1 Historical Market Size (2021–2025) |
    2. 4.2 Current & Forecast Market Size (2026–2035) |
    3. 4.3 Market Size by Revenue (USD Billion) |
    4. 4.4 Year-over-Year Growth Analysis
  5. 5 Segmentation Analysis |
    1. 5.1 By Component | |
      1. 5.1.1 Hardware | |
      2. 5.1.2 Software | |
      3. 5.1.3 Services |
    2. 5.2 By Deployment Mode | |
      1. 5.2.1 On-Premise | |
      2. 5.2.2 Cloud | |
      3. 5.2.3 Hybrid |
    3. 5.3 By Chip Type | |
      1. 5.3.1 CPU | |
      2. 5.3.2 GPU | |
      3. 5.3.3 FPGA | |
      4. 5.3.4 ASIC / AI Accelerators |
    4. 5.4 By Industrial Application | |
      1. 5.4.1 Government and Defense | |
      2. 5.4.2 Academic and Research Institutions | |
      3. 5.4.3 BFSI | |
      4. 5.4.4 Manufacturing and Automotive Engineering | |
      5. 5.4.5 Other (Energy, Healthcare, Media)
  6. 6 Regional Analysis |
    1. 6.1 North America | |
      1. 6.1.1 United States | |
      2. 6.1.2 Canada | |
      3. 6.1.3 Mexico |
    2. 6.2 Europe | |
      1. 6.2.1 Germany | |
      2. 6.2.2 United Kingdom | |
      3. 6.2.3 France | |
      4. 6.2.4 Italy | |
      5. 6.2.5 Spain | |
      6. 6.2.6 Nordic Countries | |
      7. 6.2.7 Russia | |
      8. 6.2.8 Rest of Europe |
    3. 6.3 Asia-Pacific | |
      1. 6.3.1 China | |
      2. 6.3.2 Japan | |
      3. 6.3.3 India | |
      4. 6.3.4 South Korea | |
      5. 6.3.5 ASEAN | |
      6. 6.3.6 Rest of Asia-Pacific |
    4. 6.4 South America | |
      1. 6.4.1 Brazil | |
      2. 6.4.2 Argentina | |
      3. 6.4.3 Rest of South America |
    5. 6.5 Middle East & Africa | |
      1. 6.5.1 Saudi Arabia | |
      2. 6.5.2 UAE | |
      3. 6.5.3 South Africa | |
      4. 6.5.4 Egypt | |
      5. 6.5.5 Rest of MEA
  7. 7 Competitive Landscape |
    1. 7.1 Market Share Analysis (2025) |
    2. 7.2 Competitive Benchmarking Matrix |
    3. 7.3 Company Profiles | |
      1. 7.3.1 Hewlett Packard Enterprise (HPE/Cray) | |
      2. 7.3.2 NVIDIA | |
      3. 7.3.3 Dell Technologies | |
      4. 7.3.4 IBM | |
      5. 7.3.5 Lenovo | |
      6. 7.3.6 AMD | |
      7. 7.3.7 Intel | |
      8. 7.3.8 Fujitsu | |
      9. 7.3.9 Atos / Eviden | |
      10. 7.3.10 Microsoft Azure
  8. 8 Future Outlook & Strategic Recommendations (2026–2035) |
    1. 8.1 AI-Native HPC Infrastructure |
    2. 8.2 Quantum Integration Pathways |
    3. 8.3 Energy Efficiency and Sustainable Computing |
    4. 8.4 Democratization Through Platform Economics
  9. 9 Recent Developments & News
  10. 10 Frequently Asked Questions (FAQs)
  11. 11 Report Scope & Methodology |
    1. 11.1 Study Period & Base Year |
    2. 11.2 Data Sources & Citations |
    3. 11.3 Abbreviations
  12. 12 LIST OF TABLES |
  13. TABLE 1 Global High Performance Computing Market Size & Forecast, by Revenue (USD Billion), 2021–2035 |
  14. TABLE 2 Global High Performance Computing Market — Year-over-Year Growth Analysis, 2021–2035 |
  15. TABLE 3 Global High Performance Computing Market — Driver Impact Analysis |
  16. TABLE 4 Global High Performance Computing Market — Restraint Impact Analysis |
  17. TABLE 5 Global High Performance Computing Market Size, by Component, 2021–2035 (USD Billion) |
  18. TABLE 6 Global High Performance Computing Market Size, by Deployment Mode, 2021–2035 (USD Billion) |
  19. TABLE 7 Global High Performance Computing Market Size, by Chip Type, 2021–2035 (USD Billion) |
  20. TABLE 8 Global High Performance Computing Market Size, by Industrial Application, 2021–2035 (USD Billion) |
  21. TABLE 9 Global High Performance Computing Market Size, by Region, 2021–2035 (USD Billion) |
  22. TABLE 10 North America High Performance Computing Market Size, by Country, 2021–2035 (USD Billion) |
  23. TABLE 11 Europe High Performance Computing Market Size, by Country, 2021–2035 (USD Billion) |
  24. TABLE 12 Asia-Pacific High Performance Computing Market Size, by Country, 2021–2035 (USD Billion) |
  25. TABLE 13 South America High Performance Computing Market Size, by Country, 2021–2035 (USD Billion) |
  26. TABLE 14 Middle East & Africa High Performance Computing Market Size, by Country, 2021–2035 (USD Billion) |
  27. TABLE 15 Competitive Benchmarking Matrix — Global High Performance Computing Market, 2025 |
  28. TABLE 16 Company Profiles — Key Players, Global High Performance Computing Market |
  29. TABLE 17 Recent Developments & Strategic Announcements, 2024–2025 |
  30. TABLE 18 North America High Performance Computing Market Size, by Component, 2021–2035 (USD Billion) |
  31. TABLE 19 North America High Performance Computing Market Size, by Deployment Mode, 2021–2035 (USD Billion) |
  32. TABLE 20 North America High Performance Computing Market Size, by Chip Type, 2021–2035 (USD Billion) |
  33. TABLE 21 North America High Performance Computing Market Size, by Industrial Application, 2021–2035 (USD Billion) |
  34. TABLE 22 Europe High Performance Computing Market Size, by Component, 2021–2035 (USD Billion) |
  35. TABLE 23 Europe High Performance Computing Market Size, by Deployment Mode, 2021–2035 (USD Billion) |
  36. TABLE 24 Europe High Performance Computing Market Size, by Chip Type, 2021–2035 (USD Billion) |
  37. TABLE 25 Europe High Performance Computing Market Size, by Industrial Application, 2021–2035 (USD Billion) |
  38. TABLE 26 Asia-Pacific High Performance Computing Market Size, by Component, 2021–2035 (USD Billion) |
  39. TABLE 27 Asia-Pacific High Performance Computing Market Size, by Deployment Mode, 2021–2035 (USD Billion) |
  40. TABLE 28 Asia-Pacific High Performance Computing Market Size, by Chip Type, 2021–2035 (USD Billion) |
  41. TABLE 29 Asia-Pacific High Performance Computing Market Size, by Industrial Application, 2021–2035 (USD Billion) |
  42. TABLE 30 South America High Performance Computing Market Size, by Component, 2021–2035 (USD Billion) |
  43. TABLE 31 South America High Performance Computing Market Size, by Deployment Mode, 2021–2035 (USD Billion) |
  44. TABLE 32 South America High Performance Computing Market Size, by Chip Type, 2021–2035 (USD Billion) |
  45. TABLE 33 South America High Performance Computing Market Size, by Industrial Application, 2021–2035 (USD Billion) |
  46. TABLE 34 Middle East & Africa High Performance Computing Market Size, by Component, 2021–2035 (USD Billion) |
  47. TABLE 35 Middle East & Africa High Performance Computing Market Size, by Deployment Mode, 2021–2035 (USD Billion) |
  48. TABLE 36 Middle East & Africa High Performance Computing Market Size, by Chip Type, 2021–2035 (USD Billion) |
  49. TABLE 37 Middle East & Africa High Performance Computing Market Size, by Industrial Application, 2021–2035 (USD Billion) |
  50. TABLE 38 Report Scope & Methodology Summary |
  51. TABLE 39 Detailed Sources and Citations
  52. 13 LIST OF FIGURES |
  53. FIGURE 1 Global High Performance Computing Market Dynamics — Drivers, Restraints, and Opportunities |
  54. FIGURE 2 Value Chain Analysis — High Performance Computing Market |
  55. FIGURE 3 Porter's Five Forces Analysis — High Performance Computing Market |
  56. FIGURE 4 Global High Performance Computing Market Size Trend (USD Billion), 2021–2035 |
  57. FIGURE 5 Global High Performance Computing Market Share, by Component (%), 2025 |
  58. FIGURE 6 Global High Performance Computing Market Share, by Deployment Mode (%), 2025 |
  59. FIGURE 7 Global High Performance Computing Market Share, by Chip Type (%), 2025 |
  60. FIGURE 8 Global High Performance Computing Market Share, by Industrial Application (%), 2025 |
  61. FIGURE 9 Global High Performance Computing Market Share, by Region (%), 2025 |
  62. FIGURE 10 North America High Performance Computing Market Size Trend (USD Billion), 2021–2035 |
  63. FIGURE 11 Europe High Performance Computing Market Size Trend (USD Billion), 2021–2035 |
  64. FIGURE 12 Asia-Pacific High Performance Computing Market Size Trend (USD Billion), 2021–2035 |
  65. FIGURE 13 South America High Performance Computing Market Size Trend (USD Billion), 2021–2035 |
  66. FIGURE 14 Middle East & Africa High Performance Computing Market Size Trend (USD Billion), 2021–2035 |
  67. FIGURE 15 Competitive Landscape — Market Share Analysis (%), 2025

Segmentation Quick Reference

DimensionSub-SegmentsDominant SegmentFastest Growing Segment
ComponentHardware, Software, ServicesHardwareSoftware
Deployment ModeOn-Premise, Cloud, HybridOn-PremiseCloud
Chip TypeCPU, GPU, FPGA, ASIC / AI AcceleratorsCPUASIC / AI Accelerators
Industrial ApplicationGovernment and Defense, Academic and Research Institutions, BFSI, Manufacturing and Automotive Engineering, OtherGovernment and DefenseManufacturing and Automotive Engineering
GeographyNorth America, Europe, Asia-Pacific, South America, Middle East & AfricaNorth AmericaAsia-Pacific


Market Segmentation Overview

By Component

Sub-SegmentKey Trend
HardwareShift from CPU-centric to GPU/accelerator-dense architectures driving higher average system prices
SoftwareGrowth in AI training frameworks, workload schedulers, and simulation platforms across verticals
ServicesExpansion of managed HPC, cloud migration consulting, and performance optimization engagements


Hardware spending is anchored by the transition to heterogeneous accelerator platforms, with GPU and ASIC shipments accounting for an increasing proportion of total system cost. Software and services are growing faster in percentage terms as enterprises seek managed solutions that abstract infrastructure complexity.

By Deployment Mode

Sub-SegmentKey Trend
On-PremiseContinued dominance in defense and classified research; legacy refresh cycles create stable demand
CloudRapid adoption driven by pay-per-use economics and elimination of capital expenditure barriers
HybridGrowing preference for burst-to-cloud architectures that balance cost control with peak capacity needs


Cloud deployment is reshaping how organizations access supercomputing, with major providers offering bare-metal HPC instances alongside managed Kubernetes-based job schedulers. On-premise remains essential where data sovereignty and low-latency requirements prevail.

By Chip Type

Sub-SegmentKey Trend
CPUSustained role in general-purpose scientific computing; ARM-based alternatives gaining share
GPUDominant accelerator for AI training; NVIDIA and AMD competing on memory bandwidth and power efficiency
FPGANiche but resilient demand in real-time signal processing, genomics, and low-latency financial applications
ASIC / AI AcceleratorsFastest-growing category as hyperscalers deploy custom inference silicon at scale


The chip landscape is bifurcating between flexible GPU platforms suited for diverse workloads and purpose-built ASICs optimized for specific inference or training tasks. This dual trajectory will define vendor strategies through 2035.

By Industrial Application

Sub-SegmentKey Trend
Government and DefenseExascale programs and national security simulation sustain multi-year procurement cycles
Academic and Research InstitutionsFederally funded shared computing networks expanding capacity and user base
BFSIRisk modeling, fraud detection, and algorithmic trading drive latency-sensitive HPC demand
Manufacturing and Automotive EngineeringEV design, crash simulation, and digital twin adoption accelerate compute requirements
Other (Energy, Healthcare, Media)Reservoir modeling, clinical genomics, and visual effects rendering create diversified demand


Government and defense procurement provides a stable demand floor, while commercial adoption — particularly in automotive engineering and financial services — is accelerating growth and broadening the market's end-user profile.




Download PDF ×

We do not share your information with anyone. However, we may send you emails based on your report interest from time to time. You may contact us at any time to opt-out.