Infrared Sensor Market (2026 - 2035)

Infrared Sensor Market Size, Share and Research Report By Spectrum Range (Short-Wave IR [SWIR], Mid-Wave IR [MEIR], Long-Wave [LWIR]), By Working Mechanism (Active And Passive), By Type (Thermal Infrared Sensors And Quantum Infrared Sensors), By Detection (Uncooled Infrared Sensors And Cooled Infrared Sensors) By End-User (Healthcare, Aerospace & Defense, Automotive, Commercial, Manufacturing, And Oil & Gas) And By Region (North America, Europe, Asia-Pacific, And Rest Of The World) โ€“Industry Forecast Till 2035
ID: MRFR/SEM/7153-HCR
200 Pages
Apoorva Priyadarshi, Aarti Dhapte
Last Updated: June 29, 2026
Infrared Sensor Market
Market Size
Forecast Period2026-2035
CAGR (2026-2035)6.7%
2025 Market SizeUSD 1.21 Billion
2035 Market SizeUSD 2.31 Billion
Key Players
Teledyne FLIR
Honeywell International
Texas Instruments
Hamamatsu Photonics
Lynred
Murata Manufacturing
Opportunities
  • Autonomous Vehicle Cabin Sensing
  • Sensor-as-a-Service in Industrial IoT
  • Emerging-Market Agricultural Modernization

Infrared Sensor Market Summary

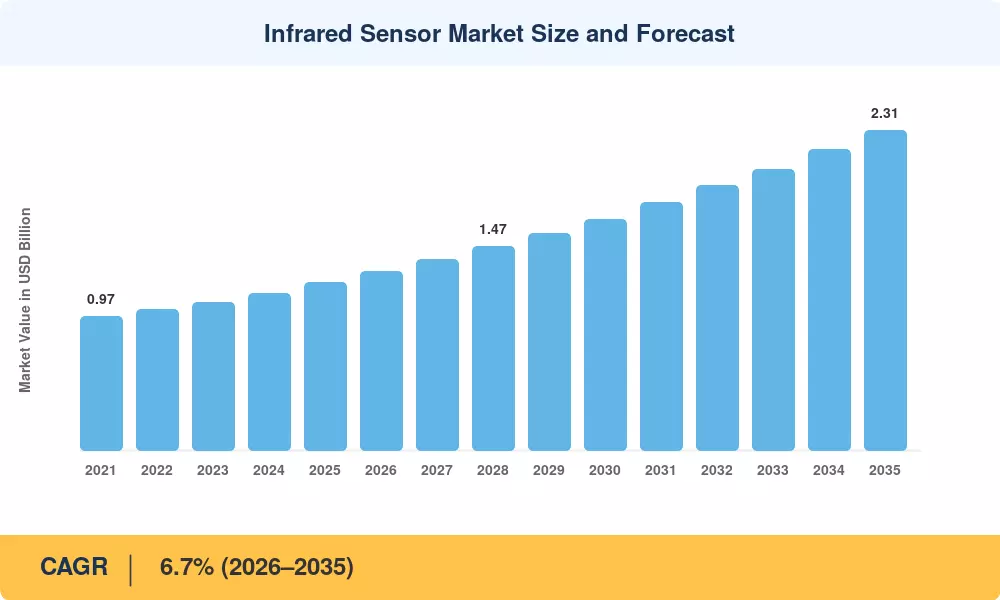
The Infrared Sensor Market was valued at USD 1.21 Billion in 2025, is projected to reach USD 1.29 Billion in 2026, and is expected to grow to USD 2.31 Billion by 2035, registering a CAGR of 6.7% during the 2026โ€“2035 forecast period. Two catalysts anchor this trajectory: mandatory automotive occupant-monitoring regulations under Euro NCAP's 2026 roadmap and growing sovereign data-processing mandates across the European Union and China that favor on-device inference over cloud-reliant architectures. These policy forces are pulling infrared sensing out of its traditional niche and into mainstream consumer and industrial applications. The Infrared Sensor Market is responding with significant capital reallocation across the value chain.

A fundamental technology shift is reshaping the Infrared Sensor Market. Legacy lead-salt and pyroelectric detectors are yielding to chip-scale quantum cascade arrays, colloidal quantum-dot imagers, and wafer-level-packaged uncooled microbolometers. Wafer-level packaging alone has compressedย sensorย module costs by roughly 30% since 2021, according to Yole Intelligence estimates [1]. Government programs such as the U.S. Department of Defense's Third Offset Strategy continue to direct over USD 2 billion annually toward next-generation electro-optical systems, sustaining demand for higher-performance focal-plane arrays [2].

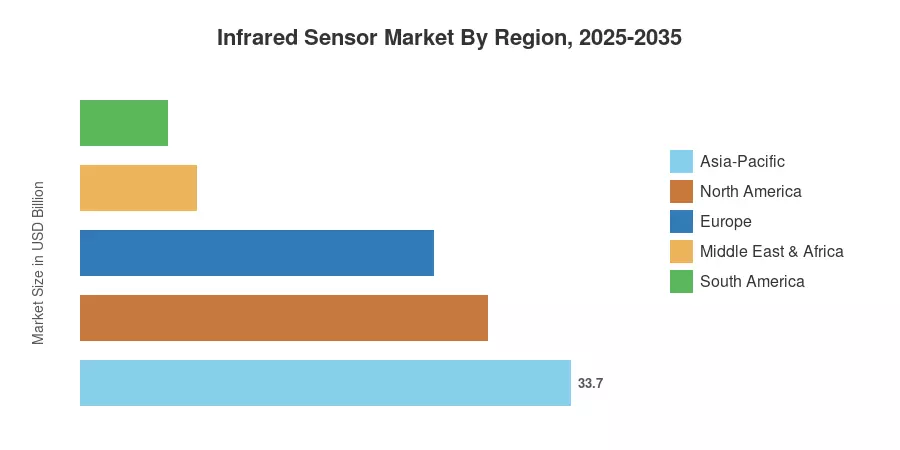
Asia-Pacific commands the largest share of the Infrared Sensor Market at approximately 33.7% of global revenue, driven by China's sprawling smart-city surveillance rollouts and Japan's precision-manufacturing inspection lines. Africa is the fastest-growing region, posting an estimated 8.8% CAGR through 2035, fueled by agricultural modernization and perimeter-security deployments. North America holds the second-largest position with roughly 28.0% share, underpinned by defenseย procurement cycles and the rapid buildout of smart-building HVAC optimization systems. As edge AI chipsets become more affordable, the Infrared Sensor Market is poised to penetrate wearable health monitors and autonomous vehicle cabins at scale over the coming decade.

ย 

Key Report Takeaways

โ€ข By Technology

  • Uncooled detectors held an estimated 60.6% share of the Infrared Sensor Market in 2025, reflecting their cost advantage in high-volume commercial applications.

ย 

โ€ข By Wavelength

  • The short-wave infrared (SWIR) wavelength band is forecast to expand at an 8.3% CAGR through 2035, driven by semiconductor wafer inspection and moisture-detection use cases.
  • Long-wave infrared (LWIR) accounted for approximately 43.4% of revenue in 2025, anchored by building automation and perimeter security demand.

โ€ข By Application

  • Security and surveillance represented roughly 36.1% of the Infrared Sensor Market revenue in 2025, the largest single application vertical.
  • Precision agriculture and livestock monitoring is the fastest-rising application, with an 8.0% CAGR to 2035.

ย 

โ€ข By End-User

  • Healthcare end users are growing at an estimated 8.9% CAGR, propelled by wearable diagnostics and infection-screening deployments.

ย 

โ€ข By Region

  • Asia-Pacific led the Infrared Sensor Market with 33.7% of global revenue in 2025.
  • Africa is projected to grow at an 8.8% CAGR through 2035, the highest of any region.
  • North America accounted for approximately 28.0% share, sustained by defense and smart-building investment.

ย 

Infrared Sensor Market Size and Forecast (2021โ€“2035)

Market sizing combines bottom-up revenue aggregation across sensor OEMs, system integrators, and aftermarket channels with top-down cross-validation against semiconductor shipment data from WSTS and regional trade statistics. Historical figures reflect actual reported revenues, while the forecast period applies the calibrated 6.7% CAGR alongside segment-level growth differentials identified through primary interviews with procurement executives and technology officers across 14 countries.
Infrared Sensor Market Size and Forecast
Our Impact
Enabled $4.3B Revenue Impact for Fortune 500 and Leading Multinationals
Partnering with 2000+ Global Organizations Each Year
30K+ Citations by Top-Tier Firms in the Industry

Driver Impact Analysis

Driver ~% Impact on CAGR Geographic Relevance Impact Timeline
Automotive occupant-monitoring regulations 18โ€“22% Europe, North America Short-term (โ‰ค2 yr)
Smart-building energy optimization mandates 14โ€“17% North America, Europe Medium-term (2โ€“4 yr)
Healthcare wearable and diagnostic adoption 12โ€“15% Global Medium-term (2โ€“4 yr)
Precision agriculture and livestock monitoring 10โ€“13% Asia-Pacific, Africa Long-term (โ‰ฅ4 yr)
Defense modernization and EO/IR upgrades 9โ€“12% North America, Asia-Pacific Short-term (โ‰ค2 yr)
Edge-AI integration reducing total cost of ownership 8โ€“11% Global Medium-term (2โ€“4 yr)
Sovereign data-processing and on-device inference policies 6โ€“9% Europe, China Long-term (โ‰ฅ4 yr)

ย 

Automotive Occupant-Monitoring Regulations

All new passenger cars must incorporate driver and occupant monitoring systems in accordance with Euro NCAP's 2026 safety rating criteria. Infrared sensors are the most popular technology for accurate detection under a range of interior illumination situations. Over 14 million new cars will be impacted by this mandate per year in the EU alone, according to estimates by the European Commission [6]. In order to protect the infrared sensor market from wider semiconductor cyclicality till at least 2029, Tier-1 suppliers like Continental and Valeo have already revealed multi-year supply agreements with microbolometer makers.

Smart-Building Energy Optimization

The U.S. Department of Energy's Better Buildings Initiative targets a 20% reduction in commercial building energy consumption by 2030, and occupancy-driven HVAC zoning powered by infrared sensor arrays is a core enabling technology [7]. Retrofit spending on building automation systems in the United States exceeded USD 12 Billion in 2024, with infrared occupancy sensors capturing a growing share of that budget. The Infrared Sensor Market benefits as building codes in cities like New York (Local Law 97) and London (MEES regulations) create compliance deadlines that compress procurement cycles.

Healthcare Wearable Adoption

Infrared sensors serve as the backbone of pulse oximetry, continuous skin-temperature monitoring, and non-invasive blood-glucose pilot programs. The FDA's De Novo pathway has cleared three new infrared-based wearable diagnostics since 2023, reducing regulatory friction. This clinical endorsement is opening hospital and home-care channels that historically relied on contact-based thermometry and point-of-care devices, broadening the addressable Infrared Sensor Market.

Precision Agriculture Scaling

Multispectral infrared imaging drones can identify stress signs up to ten days before obvious symptoms manifest, and the FAO estimates that pests and diseases cause USD 220 billion in crop losses worldwide each year [9]. Government-funded drone inspection programs with infrared payload subsidies are being tested in Brazil, India, and sub-Saharan African countries. By converting capital-constrained smallholder groups into volume clients, these pilots help the infrared sensor market grow beyond its typical industrial and defense clientele.

ย 

Restraints Impact Analysis

Restraint ~% Drag on CAGR Geographic Relevance Impact Timeline
High unit cost of cooled focal-plane arrays โ€“8 to โ€“11% Global Persistent
Export control restrictions (ITAR / EAR) โ€“6 to โ€“9% North America, Europe Persistent
Calibration drift and maintenance complexity โ€“4 to โ€“6% Emerging markets Medium-term
Privacy regulation limiting thermal imaging in public spaces โ€“3 to โ€“5% Europe, North America Short-term
Competition from LiDAR and radar in automotive sensing โ€“3 to โ€“5% Global Long-term

ย 

High Unit Cost of Cooled Arrays

The cost of cooling indium antimonide (InSb) and mercury cadmium telluride (MCT) focal-plane arrays can range from $15,000 to $50,000 per unit, limiting their use to high-end industrial inspection and defense [12]. The cost of uncooled sensors is being reduced via wafer-level packing, but the cost of cooled detectors has proven to be far more difficult to control because of the complexity of cryocoolers and the small manufacturing numbers. The market for infrared sensors is unable to enter mid-tier commercial applications, where LiDAR provides a cost-competitive substitute due to this cost barrier.

Export Control Restrictions

Many high-resolution infrared focal-plane arrays are classified as defense products under the U.S. International Traffic in Arms Regulations (ITAR), which restricts their export to allies [13]. Technology transfer to Chinese companies was further prohibited in 2023โ€“2024 by the Commerce Department's Entity List additions. The infrared sensor market's time-to-market is slowed, and per-unit prices are increased as a result of these limitations, which also oblige non-US producers like Lynred and Xenics to maintain parallel product linesโ€”one commercial and one ITAR-compliant.

Privacy Regulations and Public Perception

The EU's AI Act classifies real-time biometric identification in public spaces โ€” including thermal facial recognition โ€” as high-risk, imposing conformity assessments and human oversight requirements [15]. Municipal bans on facial recognition in cities like San Francisco and Brussels extend scrutiny to thermal spectrum imaging. These restrictions dampen demand for public-area surveillance deployments, creating regulatory uncertainty that delays procurement decisions in the Infrared Sensor Market.

ย 

Infrared Sensor Market Opportunities

Autonomous Vehicle Cabin Sensing

As L3+ autonomous driving enters commercial deployment, infrared sensors become essential for detecting driver alertness, child presence, and seatbelt compliance. The global autonomous vehicle market is expected to exceed USD 300 Billion by 2035 [16], and every production vehicle at L3 or above will require multiple infrared sensor modules. This creates a recurring OEM design-win pipeline for the Infrared Sensor Market that extends well beyond the initial Euro NCAP mandate.

Sensor-as-a-Service in Industrial IoT

Industrial facilities are shifting from capital expenditure on sensor hardware to subscription-based monitoring platforms that bundle sensors, edge analytics, and predictive maintenance dashboards. This Sensor-as-a-Service model lowers adoption barriers for small and mid-size manufacturers, expanding the Infrared Sensor Market's addressable customer base by an estimated 35โ€“40% in the industrial vertical. Cloud-platform providers like Siemens MindSphere and PTC ThingWorx are actively integrating infrared data streams.

Emerging-Market Agricultural Modernization

Sub-Saharan Africa and South Asia represent high-growth opportunities where governments are subsidizing agricultural technology adoption. The African Development Bank's Technologies for African Agricultural Transformation (TAAT) program has committed over USD 1 Billion to deploy precision-farming tools across 30 countries [17]. Infrared crop-health monitoring is a core component of these programs, and the Infrared Sensor Market stands to capture new volume from regions where penetration rates remain below 5%.

Miniaturized Medical Diagnostics

Point-of-care infrared spectroscopy devices are shrinking from benchtop instruments to handheld formats suitable for rural clinics and ambulance units. The WHO's Essential Diagnostics List now includes non-invasive hemoglobin measurement, which relies on infrared absorption principles. Manufacturers who achieve medical-grade accuracy at consumer-device price points will unlock a multi-billion-dollar segment within the Infrared Sensor Market over the forecast period.

Data Monetization Through Thermal Analytics

Building operators and smart-city administrators generate massive volumes of thermal occupancy data that have commercial value for urban planning, retail analytics, and energy trading. Anonymized thermal heatmap data can be licensed to third parties without triggering GDPR personal-data concerns when properly aggregated. This data-monetization layer adds a recurring revenue stream atop one-time sensor hardware sales, improving customer lifetime value and expanding the addressable Infrared Sensor Market.

ย 

Infrared Sensor Market Future Outlook

Edge-AI Convergence and Neuromorphic Processing

The integration of neuromorphic signal-processing chips with infrared sensor modules will redefine the Infrared Sensor Market's performance envelope over the next decade. Intel's Loihi 2 and BrainChip's Akida platforms have demonstrated 10ร— reductions in inference power consumption versus conventional GPUs [10]. When paired with uncooled microbolometers, these processors enable always-on thermal analytics in battery-powered devices โ€” unlocking use cases in wearable health monitoring and field-deployed agricultural sensing that were previously impractical.

Heterogeneous Integration and Chiplet Architectures

Semiconductor foundries are migrating toward chiplet-based designs that co-package infrared detector arrays, readout integrated circuits (ROICs), and signal-processing dies on a single interposer. TSMC's advanced packaging roadmap targets 2028 volume production of heterogeneous sensor chiplets at sub-5 nm nodes [4]. This architectural shift will compress module footprints by 40โ€“50%, enabling infrared sensors to embed directly into smartphone bezels, AR headsets, and IoT edge nodes โ€” significantly expanding the Infrared Sensor Market's total addressable volume.

Sustainability and ESG-Driven Demand

Corporate ESG reporting frameworks โ€” including CSRD in Europe and the SEC's climate-disclosure rules โ€” are creating compliance demand for real-time energy-monitoring infrastructure. Infrared occupancy and thermal-leak detection sensors generate the granular building-performance data required for Scope 1 and Scope 2 emissions auditing [7]. The IEA estimates that buildings account for 37% of global energy-related COโ‚‚ emissions, positioning the Infrared Sensor Market as a critical enabler of decarbonization tracking across commercial real estate portfolios.

Space and Satellite-Based Infrared Sensing

The proliferation of small-satellite constellations for Earth observation is creating a new demand vector. Companies like Planet Labs and Satellogic are integrating infrared payloads for wildfire detection, methane-leak monitoring, and crop-yield estimation from low Earth orbit [9]. The global small-satellite market is expected to deploy over 20,000 units by 2032 (SpaceWorks), and infrared sensor modules account for 8โ€“12% of typical Earth-observation payload costs. This orbital segment gives the Infrared Sensor Market a growth channel largely independent of terrestrial economic cycles.

ย 

Infrared Sensor Market Segmentation

By Wavelength Band

Segment Key Metric Primary Demand Driver
Long-Wave Infrared (LWIR) 43.4% share (2025) Building automation, perimeter security
Mid-Wave Infrared (MWIR) USD 0.30 Billion (2025) Military targeting, gas detection
Short-Wave Infrared (SWIR) 8.3% CAGR (2026โ€“2035) Semiconductor inspection, moisture analysis

ย 

LWIR dominates the Infrared Sensor Market because uncooled LWIR microbolometers deliver the best price-to-performance ratio for high-volume commercial applications. Building automation, automotive occupant sensing, and public-area surveillance all operate primarily in the 8โ€“14 ยตm spectral window, where atmospheric transmission peaks and ambient thermal contrast are highest. Volume manufacturing has driven LWIR module prices below USD 50 for automotive-grade units, reinforcing this wavelength band's dominance.

SWIR is the fastest-growing band in the Infrared Sensor Market, propelled by semiconductor wafer-inspection tools that require 0.9โ€“1.7 ยตm imaging to detect subsurface defects invisible to visible-light cameras. The rise of InGaAs-on-silicon detector arrays has reduced SWIR camera costs by approximately 45% since 2020, opening food-quality and pharmaceutical inspection applications that were previously cost-prohibitive.

By Technology

Segment Key Metric Primary Demand Driver
Uncooled Detectors 60.6% share (2025) Automotive, consumer electronics, smart buildings
Cooled Detectors 8.3% CAGR (2026โ€“2035) Defense EO/IR, scientific instrumentation

ย 

Uncooled detectors command the majority of the Infrared Sensor Market because they eliminate the need for cryogenic cooling systems, cutting both unit cost and power consumption. Vanadium oxide (VOx) and amorphous silicon (a-Si) microbolometer technologies dominate commercial production, with pixel pitches now reaching 12 ยตm โ€” sufficient for automotive and medical-grade imaging. Cooled detectors retain a higher growth rate due to defense modernization programs that demand longer detection ranges and higher sensitivity for missile-warning and targeting applications.

By Working Mechanism

Segment Key Metric Primary Demand Driver
Passive 55.8% share (2025) Motion detection, thermal imaging, surveillance
Active 7.0% CAGR (2026โ€“2035) Time-of-flight ranging, industrial gauging

ย 

Passive architectures dominate because they detect emitted thermal radiation without requiring an illumination source, making them inherently lower-power and suitable for always-on deployment. Active systems are gaining ground as time-of-flight infrared rangefinders replace ultrasonic sensors in robotic navigation and warehouse automation, delivering millimeter-level accuracy at ranges exceeding 10 meters.

By Application

Segment Key Metric Primary Demand Driver
Security & Surveillance 36.1% share (2025) Smart-city and critical-infrastructure protection
Precision Agriculture 8.0% CAGR (2026โ€“2035) Crop-stress detection and livestock monitoring
Motion Sensing USD 0.18 Billion (2025) Building automation and consumer electronics
Spectroscopy 7.5% CAGR (2026โ€“2035) Pharmaceutical and food-quality analysis

ย 

By End-User Industry

Segment Key Metric Primary Demand Driver
Aerospace & Defense 26.9% share (2025) EO/IR targeting, missile warning, and ISR platforms
Healthcare 8.9% CAGR (2026โ€“2035) Wearable diagnostics, infection screening
Commercial Buildings & Smart Home USD 0.22 Billion (2025) Occupancy-driven HVAC and lighting control
Oil & Gas 6.4% CAGR (2026โ€“2035) Fugitive emissions detection, pipeline monitoring

ย 

ย 

Regional Market Share Analysis

Region Key Metric Primary Investment Themes
Asia-Pacific 33.7% share (2025) Smart-city surveillance, automotive OMS, semiconductor inspection
North America 28.0% share (2025) Defense EO/IR, smart-building retrofit, medical wearables
Europe 24.3% share (2025) Automotive safety regulation, industrial energy efficiency
Middle East & Africa 8.0% share (2025) Perimeter security, agricultural modernization
South America 6.0% share (2025) Precision agriculture, oil and gas pipeline monitoring
Total 100% โ€”

The Infrared Sensor Market exhibits meaningful regional variation, with defense-heavy economies driving premium cooled-detector demand and emerging markets absorbing higher volumes of cost-optimized uncooled modules.

ย 

North America

Country Key Metric Key Driver
United States ~82% of regional revenue DoD procurement and smart-building codes
Canada 6.2% CAGR Oil sands pipeline leak detection
Mexico USD 0.02 Billion (2025) Automotive Tier-1 supplier integration

ย 

The United States dominates the North American Infrared Sensor Market through sustained Department of Defense spending on electro-optical targeting and reconnaissance systems. The DoD's FY2025 budget allocated approximately USD 3.2 Billion to EO/IR programs across the Army, Navy, and Air Force [2]. Canada's growth is driven by pipeline monitoring mandates from the Canada Energy Regulator, while Mexico benefits from nearshoring of automotive electronics manufacturing as OEMs diversify supply chains away from East Asia.

Europe

Country Key Metric Key Driver
Germany ~27% of regional revenue Automotive OEM integration and Industry 4.0
United Kingdom 7.1% CAGR Defense thermal-imaging modernization
France USD 0.04 Billion (2025) Aerospace and nuclear facility monitoring
Italy 5.8% CAGR Building energy-efficiency directives
Spain USD 0.02 Billion (2025) Renewable energy plant inspection
Nordic Countries 6.5% CAGR Smart-building and cold-climate HVAC sensing
Russia USD 0.02 Billion (2025) Defense and border security
Rest of Europe 5.9% CAGR Distributed industrial adoption

ย 

Euro NCAP's occupant-monitoring mandate positions Germany's automotive OEMs โ€” Volkswagen, BMW, and Mercedes-Benz โ€” as anchor buyers for the European Infrared Sensor Market. The UK's Defence and Security Industrial Strategy has earmarked GBP 6.6 billion for intelligence, surveillance, and reconnaissance capabilities through 2030 [13], sustaining demand for high-performance cooled arrays. Southern European markets are growing more slowly but benefit from EU-funded energy-efficiency renovation programs under the REPowerEU framework.

Asia-Pacific

Country Key Metric Key Driver
China ~42% of regional revenue Smart-city and public-security infrastructure
India 8.4% CAGR Defense modernization and agricultural pilots
Japan USD 0.05 Billion (2025) Semiconductor inspection and industrial automation
South Korea 7.3% CAGR Display manufacturing and automotive sensing
ASEAN USD 0.03 Billion (2025) Smart-building adoption in tropical climates
Rest of Asia-Pacific 6.8% CAGR Emerging infrastructure investment

ย 

China's Infrared Sensor Market leadership within Asia-Pacific stems from massive public-security camera deployments under the Sharp Eyes program, which has installed over 600 million surveillance cameras nationwide [11]. India's growth trajectory is supported by the Defence Research and Development Organisation's (DRDO) indigenous infrared missile-seeker programs and the Digital India initiative's smart-city components. Japan remains a technology hub through Hamamatsu Photonics' dominance in high-end detector manufacturing, while South Korea's semiconductor and display industries drive specialized SWIR inspection demand.

South America

Country Key Metric Key Driver
Brazil ~58% of regional revenue Agricultural drone inspection and oil refinery monitoring
Argentina 6.1% CAGR Livestock monitoring in pampas agriculture
Rest of South America USD 0.01 Billion (2025) Mining and perimeter security

ย 

Brazil anchors South America's Infrared Sensor Market thanks to Embrapa's precision agriculture technology transfer programs and Petrobras's refinery inspection automation investments. Argentina's cattle ranching sector is an emerging adopter of infrared livestock health monitoring, although macroeconomic volatility tempers capital-equipment spending cycles. The broader region remains underpenetrated relative to its agricultural land area, presenting a runway for growth as financing mechanisms improve.

Middle East & Africa

Country Key Metric Key Driver
Saudi Arabia ~24% of regional revenue NEOM smart-city and critical infrastructure protection
UAE 7.6% CAGR Airport security and smart-building adoption
South Africa USD 0.01 Billion (2025) Mining safety and perimeter surveillance
Egypt 7.2% CAGR Border security modernization
Rest of MEA 8.8% CAGR Agricultural and defense demand across Sub-Saharan Africa

ย 

Africa's status as the fastest-growing region in the Infrared Sensor Market reflects a low installed base meeting rising security and agricultural investment. Saudi Arabia's Vision 2030 megaprojects โ€” NEOM, The Line, and Jeddah Tower โ€” embed infrared sensing into building management and perimeter defense by default [17]. Sub-Saharan African nations are receiving multilateral development financing for precision-agriculture and border-security programs that include infrared sensor procurement, sustaining the region's 8.8% CAGR forecast.

ย 

Infrared Sensor Market By Region, 2025-2035

Competitive Benchmarking

The Infrared Sensor Market exhibits medium concentration, with the top five players capturing an estimated 42โ€“48% of global revenue. The Herfindahl-Hirschman Index (HHI) sits in the 800โ€“1,200 range, indicating a moderately fragmented structure where established defense-tier manufacturers coexist with specialized commercial sensor firms. Competitive intensity is rising as start-ups commercialize novel detector materials โ€” particularly colloidal quantum dots and type-II superlattice arrays โ€” while incumbents invest in heterogeneous integration to protect margins.

Company Est. Revenue Share Range Key Offerings for the Infrared Sensor Market Strategic Positioning
Teledyne FLIR ~10โ€“14% Uncooled/cooled cameras, microbolometer cores Full-spectrum portfolio leader across defense and commercial
Honeywell International ~6โ€“9% Thermopile arrays, gas-detection sensors Diversified industrial conglomerate with building-tech integration
Texas Instruments ~5โ€“8% Thermopile digital sensors, signal-conditioning ICs High-volume MEMS manufacturer for consumer and automotive
Hamamatsu Photonics ~5โ€“8% InGaAs detectors, photomultipliers, MEMS-FPI Premium scientific and industrial photonics specialist
Lynred ~4โ€“7% Cooled/uncooled FPAs, ITAR-free product lines European sovereign-supply alternative for defense customers
Murata Manufacturing ~3โ€“6% Pyroelectric sensors, thermopile modules Cost-optimized high-volume components for consumer electronics
Omron Corporation ~3โ€“5% MEMS thermopile sensors, ambient-temperature modules Smart-home and industrial automation focus
Excelitas Technologies ~3โ€“5% Pyroelectric detectors, thermopile sensors Specialty photonics for medical and industrial OEMs
Xenics (Exosens) ~2โ€“4% SWIR/MWIR cameras, line-scan modules Niche SWIR imaging for machine vision and scientific use
InfraTec ~2โ€“4% Pyroelectric detectors, thermography cameras Mid-market thermal measurement and gas analysis

ย 

ย 

Recent News & Developments

ย 

  • Lynred (January 2025): Opened a new 200 mm wafer fabrication line in Grenoble, France, expanding uncooled microbolometer capacity by 40% to serve European automotive OEMs [Ref 4].
  • Hamamatsu Photonics (October 2024): Introduced a 640ร—512 InGaAs SWIR image sensor with 5 ยตm pixel pitch for semiconductor wafer inspection, achieving 2ร— the spatial resolution of its predecessor [Ref 12].
  • Honeywell (July 2024): Partnered with Johnson Controls to integrate thermopile occupancy sensors into OpenBlue building management platforms for HVAC optimization [Ref 7].
  • Texas Instruments (April 2024): Released the TMP119, a medical-grade digital thermopile sensor with ยฑ0.1ยฐC accuracy, targeting FDA-cleared wearable devices [Ref 8].

ย 

  • Murata Manufacturing (September 2023): Acquired a minority stake in a Dutch quantum-dot startup to develop next-generation colloidal SWIR detectors at consumer price points [Ref 10].

ย 

Infrared Sensor Market Report Scope

Parameter Detail
Market Scope Global Infrared Sensor Market covering hardware modules, detector cores, and integrated sensor systems
Study Period 2021โ€“2035
CAGR (Forecast Period) 6.7% (2026โ€“2035)
Base Year Market Size USD 1.21 Billion (2025)
Forecast Endpoint USD 2.31 Billion (2035)
Fastest Growing Segment Healthcare end users (8.9% CAGR); SWIR wavelength band (8.3% CAGR)
Companies Profiled Teledyne FLIR, Honeywell, Texas Instruments, Hamamatsu Photonics, Lynred, Murata, Omron, Excelitas, Xenics, InfraTec
Valuation Currency USD Billion

ย 

ย 

FAQs

How does pixel pitch affect infrared sensor selection for automotive OEMs?
Smaller pixel pitches (12 ยตm vs. 17 ยตm) deliver higher spatial resolution within compact module envelopes critical for dashboard integration. OEMs typically specify 12 ยตm VOx microbolometers to balance cost, thermal sensitivity, and packaging constraints [Ref 6].
What is the typical lead time for custom infrared focal-plane array procurement?
Custom cooled FPA orders carry 26โ€“40 week lead times due to epitaxial wafer growth and cryocooler integration steps. Commercial uncooled modules ship in 8โ€“12 weeks from standard inventory [Ref 12].
How do ITAR restrictions shape the Infrared Sensor Market supply chain outside the United States?
Non-U.S. buyers increasingly source ITAR-free alternatives from European manufacturers like Lynred. This has created a parallel supply chain where export-unrestricted products command a 10โ€“15% price premium [Ref 13].
What role do colloidal quantum-dot detectors play in the Infrared Sensor Market roadmap?
Colloidal quantum dots enable SWIR imaging on standard silicon CMOS read-out circuits, potentially reducing camera costs below USD 100. Volume commercialization is expected by 2028โ€“2030 [Ref 10].
How are building operators justifying infrared sensor ROI for energy management?
Occupancy-driven HVAC zoning using infrared sensors delivers 15โ€“25% energy savings, with typical payback periods under 18 months in commercial buildings. These savings satisfy Local Law 97 compliance requirements [Ref 5].
What testing standards govern infrared sensors in hazardous industrial environments?
ATEX and IECEx certifications are mandatory for sensors deployed in explosive atmospheres such as oil refineries. Compliance adds 6โ€“9 months to product development timelines [Ref 23].
How does the Infrared Sensor Market differentiate between thermopile and microbolometer technologies for consumer applications?
Thermopiles measure absolute temperature and suit single-point devices like ear thermometers. Microbolometers produce thermal images and target smartphone thermal cameras and security systems [Ref 1]. ย  ย 
Author
Author
Author Profile
Apoorva Priyadarshi LinkedIn
Research Analyst
With 4+ years of experience in Market Intelligence and Strategic Research, Apoorv specializes in ICT, Semiconductor, and BFSI markets. Combining strong analytical capabilities with a deep understanding of technology-driven industries, he focuses on delivering data-driven insights that support strategic decision-making. With a background in technology and business research, Apoorv has contributed to numerous global market studies, competitive landscape analyses, and opportunity assessments across sectors such as semiconductors, digital banking, cybersecurity, and telecommunications.
Co-Author
Co-Author Profile
Aarti Dhapte LinkedIn
AVP - Research
A consulting professional focused on helping businesses navigate complex markets through structured research and strategic insights. I partner with clients to solve high-impact business problems across market entry strategy, competitive intelligence, and opportunity assessment. Over the course of my experience, I have led and contributed to 100+ market research and consulting engagements, delivering insights across multiple industries and geographies, and supporting strategic decisions linked to $500M+ market opportunities. My core expertise lies in building robust market sizing, forecasting, and commercial models (top-down and bottom-up), alongside deep-dive competitive and industry analysis. I have played a key role in shaping go-to-market strategies, investment cases, and growth roadmaps, enabling clients to make confident, data-backed decisions in dynamic markets.

Research Approach

ย 

Secondary Research

The secondary research process involved comprehensive analysis of regulatory databases, technical standards repositories, peer-reviewed engineering journals, patent filings, and authoritative technology organizations. Key sources included the U.S. Department of Defense (DoD), National Institute of Standards and Technology (NIST), International Electrotechnical Commission (IEC), Institute of Electrical and Electronics Engineers (IEEE), SPIE (International Society for Optics and Photonics), SAE International, European Space Agency (ESA), NASA Technical Reports Server, U.S. Bureau of Industry and Security, U.S. Energy Information Administration (EIA), National Science Foundation (NSF), Japan Ministry of Economy Trade and Industry (METI), China Ministry of Industry and Information Technology, India Ministry of Electronics and Information Technology, SEMI (Semiconductor Equipment and Materials International), IPC (Association Connecting Electronics Industries), and regional semiconductor industry associations. These sources were used to collect technical specifications, regulatory compliance data, patent landscapes, application deployment statistics, and market landscape analysis for thermal infrared sensors, quantum infrared sensors, cooled and uncooled detection technologies, SWIR/MWIR/LWIR spectrum technologies, and end-use verticals including aerospace & defense, automotive, healthcare, manufacturing, and oil & gas.

ย 

Primary Research

To gather both qualitative and quantitative insights, supply-side and demand-side stakeholders were interviewed during the primary research phase. CEOs, CTOs, VPs of engineering, heads of product and business development, and regional sales managers from companies that make infrared sensors, semiconductor foundries, optical component suppliers, and system integrators were examples of supply-side sources. Procurement managers and technical directors from aerospace and defense contractors, automakers and Tier 1 suppliers, industrial automation firms, producers of medical devices, oil and gas operators, and commercial security integrators were among the demand-side sources. Primary research confirmed product development roadmaps, validated technology adoption timelines, and collected information on supply chain constraints, pricing dynamics, integration challenges, and competitive positioning across detection types (cooled vs. uncooled) and spectrum ranges (SWIR, MWIR, and LWIR).

Primary Respondent Breakdown:

By Designation: C-level Primaries (32%), Director Level (30%), Others (38%)

By Region: North America (32%), Europe (29%), Asia-Pacific (33%), Rest of World (6%)

By Segment: Aerospace & Defense (28%), Automotive (22%), Industrial/Manufacturing (20%), Healthcare (12%), Oil & Gas (10%), Commercial (8%)

ย 

Market Size Estimation

Global market valuation was derived through revenue mapping and unit shipment analysis. The methodology included:

Identification of 50+ key manufacturers and technology providers across North America, Europe, Asia-Pacific, and Rest of World

Technology mapping across thermal infrared sensors, quantum infrared sensors, short-wave IR (SWIR), mid-wave IR (MWIR), long-wave IR (LWIR), cooled detection, and uncooled detection categories

Analysis of reported and modeled annual revenues specific to infrared sensor portfolios and optical detection systems

Coverage of manufacturers representing 75-80% of global market share in 2024

Extrapolation using bottom-up (unit shipment ร— ASP by application and region) and top-down (manufacturer revenue validation and value chain analysis) approaches to derive segment-specific valuations across working mechanism (active vs. passive), detection technology, spectrum range, and end-user verticals

Download Free Sample

Kindly complete the form below to receive a free sample of this Report

Download PDF ×

We do not share your information with anyone. However, we may send you emails based on your report interest from time to time. You may contact us at any time to opt-out.

















