Intelligent Virtual Assistant (IVA) Market (2025 - 2035)

ID: MRFR/SEM/0641-HCR
200 Pages
Ankit Gupta
Last Updated: August 04, 2026
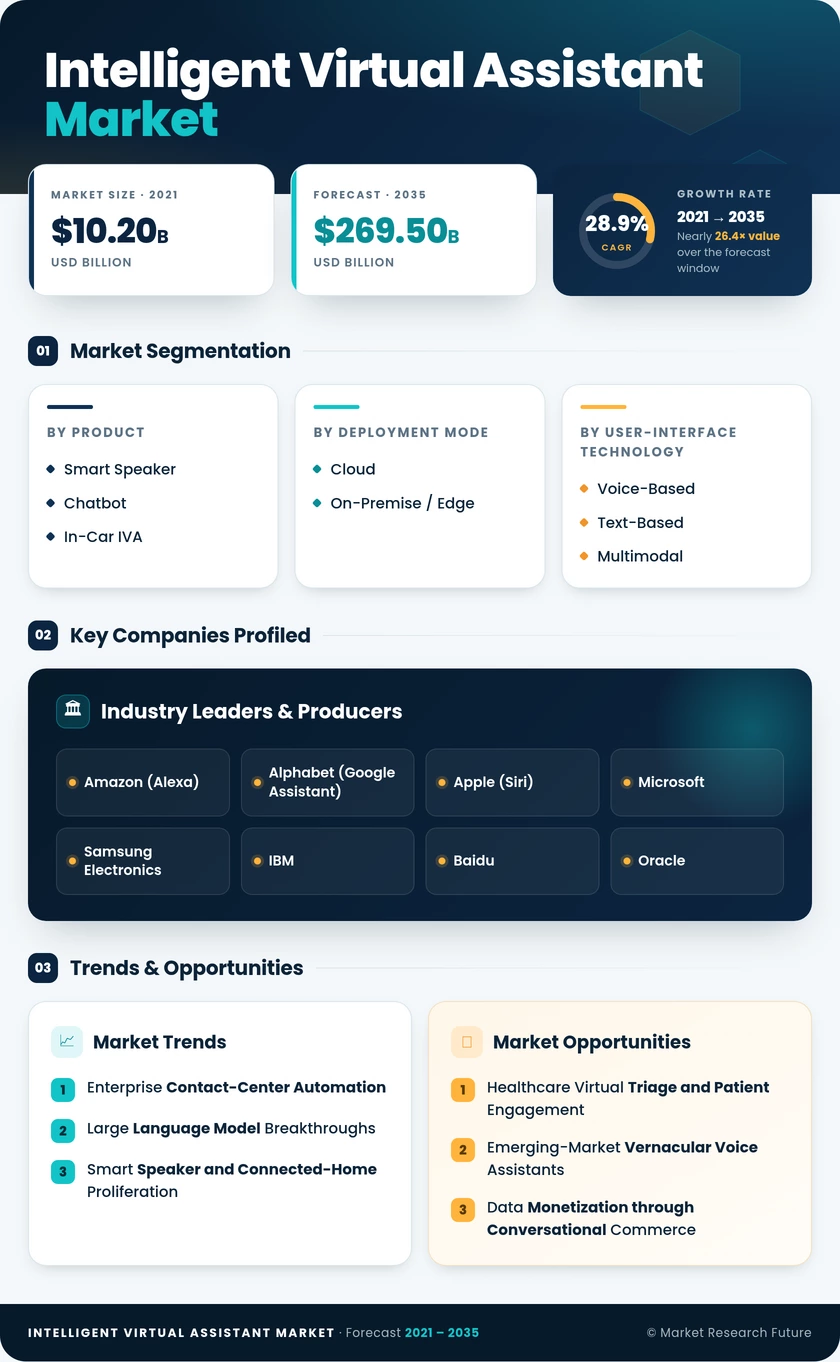
Intelligent Virtual Assistant Market Size, Share and Research Report By Product (Smart Speaker, Chatbot, In-Car IVA), By Deployment Mode (Cloud, On-Premise / Edge), By User-Interface Technology (Voice-Based (ASR + TTS), Text-Based (Text-to-Text), Multimodal (Voice-Visual)), By End-User (Retail & eCommerce, BFSI, Healthcare, Telecom & IT) and By Region (North America, Europe, Asia-Pacific, South America, Middle East & Africa) – Industry Forecast to 2035.
Intelligent Virtual Assistant (IVA) Market
Market Size
Forecast Period2025-2035
CAGR (2025-2035)28.9%
2025 Market SizeUSD 21.0 billion
2035 Market SizeUSD 269.5 billion
Key Players
Amazon
Alphabet
Apple
Microsoft
Samsung Electronics
IBM
Opportunities
  • Healthcare Virtual Triage and Patient Engagement
  • Emerging-Market Vernacular Voice Assistants
  • Data Monetization through Conversational Commerce
  1. 1 Market Overview |
    1. 1.1 Study Assumptions & Market Definition |
    2. 1.2 Scope of the Study |
    3. 1.3 Research Methodology
  2. 2 Market Summary & Key Takeaways
  3. 3 Market Dynamics |
    1. 3.1 Market Drivers Analysis | |
      1. 3.1.1 Enterprise Contact-Center Automation Mandates | |
      2. 3.1.2 Large Language Model Breakthroughs | |
      3. 3.1.3 Smart Speaker and Connected-Home Proliferation | |
      4. 3.1.4 On-Device AI Chip Cost Reductions | |
      5. 3.1.5 Government Digital-Economy and E-Governance Programs | |
      6. 3.1.6 Connected-Vehicle Infotainment Standards | |
      7. 3.1.7 Privacy Regulation Driving On-Premise Deployments |
    2. 3.2 Market Restraints Analysis | |
      1. 3.2.1 NLP Accuracy Gaps in Low-Resource Languages | |
      2. 3.2.2 Data Privacy and AI-Governance Compliance Costs | |
      3. 3.2.3 Integration Complexity with Legacy Enterprise Systems | |
      4. 3.2.4 Consumer Trust and AI Hallucination Concerns | |
      5. 3.2.5 High Upfront Cost for On-Premise Deployments |
    3. 3.3 Market Opportunity Analysis | |
      1. 3.3.1 Healthcare Virtual Triage and Patient Engagement | |
      2. 3.3.2 Emerging-Market Vernacular Voice Assistants | |
      3. 3.3.3 Data Monetization through Conversational Commerce | |
      4. 3.3.4 Connected-Vehicle In-Cabin Assistants | |
      5. 3.3.5 IVA-as-a-Service for SMEs |
    4. 3.4 Industry Value Chain Analysis |
    5. 3.5 Porter's Five Forces Analysis
  4. 4 Global Intelligent Virtual Assistant Market Size & Forecast (2021–2035) |
    1. 4.1 Historical Market Size (2021–2025) |
    2. 4.2 Current & Forecast Market Size (2026–2035) |
    3. 4.3 Market Size by Revenue (USD billion) |
    4. 4.4 Year-over-Year Growth Analysis
  5. 5 Segmentation Analysis |
    1. 5.1 By Product | |
      1. 5.1.1 Smart Speaker | |
      2. 5.1.2 Chatbot | |
      3. 5.1.3 In-Car IVA |
    2. 5.2 By Deployment Mode | |
      1. 5.2.1 Cloud | |
      2. 5.2.2 On-Premise / Edge |
    3. 5.3 By User-Interface Technology | |
      1. 5.3.1 Voice-Based (ASR + TTS) | |
      2. 5.3.2 Text-Based (Text-to-Text) | |
      3. 5.3.3 Multimodal (Voice-Visual) |
    4. 5.4 By End-User | |
      1. 5.4.1 Retail & eCommerce | |
      2. 5.4.2 BFSI | |
      3. 5.4.3 Healthcare | |
      4. 5.4.4 Telecom & IT
  6. 6 Regional Analysis |
    1. 6.1 North America | |
      1. 6.1.1 United States | |
      2. 6.1.2 Canada | |
      3. 6.1.3 Mexico |
    2. 6.2 Europe | |
      1. 6.2.1 Germany | |
      2. 6.2.2 United Kingdom | |
      3. 6.2.3 France | |
      4. 6.2.4 Italy | |
      5. 6.2.5 Spain | |
      6. 6.2.6 Nordic Countries | |
      7. 6.2.7 Russia | |
      8. 6.2.8 Rest of Europe |
    3. 6.3 Asia-Pacific | |
      1. 6.3.1 China | |
      2. 6.3.2 India | |
      3. 6.3.3 Japan | |
      4. 6.3.4 South Korea | |
      5. 6.3.5 ASEAN | |
      6. 6.3.6 Rest of Asia-Pacific |
    4. 6.4 South America | |
      1. 6.4.1 Brazil | |
      2. 6.4.2 Argentina | |
      3. 6.4.3 Rest of South America |
    5. 6.5 Middle East & Africa | |
      1. 6.5.1 Saudi Arabia | |
      2. 6.5.2 UAE | |
      3. 6.5.3 South Africa | |
      4. 6.5.4 Egypt | |
      5. 6.5.5 Rest of MEA
  7. 7 Competitive Landscape |
    1. 7.1 Market Share Analysis (2025) |
    2. 7.2 Competitive Benchmarking Matrix |
    3. 7.3 Company Profiles | |
      1. 7.3.1 Amazon (Alexa) | |
      2. 7.3.2 Alphabet (Google Assistant) | |
      3. 7.3.3 Apple (Siri) | |
      4. 7.3.4 Microsoft | |
      5. 7.3.5 Samsung Electronics | |
      6. 7.3.6 IBM | |
      7. 7.3.7 Baidu | |
      8. 7.3.8 Oracle | |
      9. 7.3.9 Salesforce | |
      10. 7.3.10 SAP
  8. 8 Future Outlook & Strategic Recommendations (2026–2035) |
    1. 8.1 Autonomous AI Agents and Agentic Workflows |
    2. 8.2 Multimodal and Embodied Interfaces |
    3. 8.3 Edge-First Architecture and Privacy-by-Design |
    4. 8.4 Sustainability and Green-AI Considerations
  9. 9 Recent Developments & News
  10. 10 Frequently Asked Questions (FAQs)
  11. 11 Report Scope & Methodology |
    1. 11.1 Study Period & Base Year |
    2. 11.2 Data Sources & Citations |
    3. 11.3 Abbreviations
  12. 12 LIST OF TABLES |
  13. TABLE 1 Global Intelligent Virtual Assistant Market Size & Forecast, by Revenue (USD billion), 2021–2035 |
  14. TABLE 2 Global Intelligent Virtual Assistant Market – Year-over-Year Growth Analysis, 2021–2035 |
  15. TABLE 3 Global Intelligent Virtual Assistant Market – Driver Impact Analysis |
  16. TABLE 4 Global Intelligent Virtual Assistant Market – Restraint Impact Analysis |
  17. TABLE 5 Global Intelligent Virtual Assistant Market Size, by Product, 2021–2035 (USD billion) |
  18. TABLE 6 Global Intelligent Virtual Assistant Market Size, by Deployment Mode, 2021–2035 (USD billion) |
  19. TABLE 7 Global Intelligent Virtual Assistant Market Size, by User-Interface Technology, 2021–2035 (USD billion) |
  20. TABLE 8 Global Intelligent Virtual Assistant Market Size, by End-User, 2021–2035 (USD billion) |
  21. TABLE 9 Global Intelligent Virtual Assistant Market Size, by Region, 2021–2035 (USD billion) |
  22. TABLE 10 North America Intelligent Virtual Assistant Market Size, by Country, 2021–2035 (USD billion) |
  23. TABLE 11 Europe Intelligent Virtual Assistant Market Size, by Country, 2021–2035 (USD billion) |
  24. TABLE 12 Asia-Pacific Intelligent Virtual Assistant Market Size, by Country, 2021–2035 (USD billion) |
  25. TABLE 13 South America Intelligent Virtual Assistant Market Size, by Country, 2021–2035 (USD billion) |
  26. TABLE 14 Middle East & Africa Intelligent Virtual Assistant Market Size, by Country, 2021–2035 (USD billion) |
  27. TABLE 15 Competitive Benchmarking Matrix – Global Intelligent Virtual Assistant Market, 2025 |
  28. TABLE 16 Company Profiles – Key Players, Global Intelligent Virtual Assistant Market |
  29. TABLE 17 Recent Developments & Strategic Announcements, 2024–2025 |
  30. TABLE 18 Report Scope & Methodology Summary |
  31. TABLE 19 Detailed Sources and Citations
  32. 13 LIST OF FIGURES |
  33. FIGURE 1 Global Intelligent Virtual Assistant Market Dynamics – Drivers, Restraints, and Opportunities |
  34. FIGURE 2 Industry Value Chain Analysis – Intelligent Virtual Assistant Market |
  35. FIGURE 3 Porter's Five Forces Analysis – Intelligent Virtual Assistant Market |
  36. FIGURE 4 Global Intelligent Virtual Assistant Market Size Trend (USD billion), 2021–2035 |
  37. FIGURE 5 Intelligent Virtual Assistant Market Share, by Product, 2025 |
  38. FIGURE 6 Intelligent Virtual Assistant Market Share, by Deployment Mode, 2025 |
  39. FIGURE 7 Intelligent Virtual Assistant Market Share, by User-Interface Technology, 2025 |
  40. FIGURE 8 Intelligent Virtual Assistant Market Share, by End-User, 2025 |
  41. FIGURE 9 Intelligent Virtual Assistant Market Share, by Region, 2025 |
  42. FIGURE 10 North America Intelligent Virtual Assistant Market Share, by Country, 2025 |
  43. FIGURE 11 Europe Intelligent Virtual Assistant Market Share, by Country, 2025 |
  44. FIGURE 12 Asia-Pacific Intelligent Virtual Assistant Market Share, by Country, 2025 |
  45. FIGURE 13 South America Intelligent Virtual Assistant Market Share, by Country, 2025 |
  46. FIGURE 14 Middle East & Africa Intelligent Virtual Assistant Market Share, by Country, 2025 |
  47. FIGURE 15 Competitive Landscape – Global Intelligent Virtual Assistant Market, 2025

Segmentation Quick Reference

DimensionSub-SegmentsDominant SegmentFastest Growing Segment
By ProductSmart Speaker, Chatbot, In-Car IVASmart Speaker (48.5% share, 2025)In-Car IVA (30.5% CAGR)
By Deployment ModeCloud, On-Premise / EdgeCloud (72.0% share, 2025)On-Premise / Edge (31.3% CAGR)
By User-Interface TechnologyVoice-Based, Text-Based, MultimodalVoice-Based (52.5% share, 2025)Multimodal (35.2% CAGR)
By End-UserRetail & eCommerce, BFSI, Healthcare, Telecom & ITRetail & eCommerce (22.2% share, 2025)Healthcare (35.0% CAGR)


Market Segmentation Overview

By Product

Sub-SegmentKey Trend
Smart SpeakerHousehold penetration exceeding 42% in North America; voice-commerce growth accelerating
ChatbotGenerative-AI backends replacing rule-based decision trees across enterprise helpdesks.
In-Car IVAOEM integration mandated by the EU General Safety Regulation and China GB/T standards


Smart speakers continue to anchor consumer-facing revenue as voice-commerce transaction volumes grow at twice the rate of traditional eCommerce channels. Chatbots are transforming enterprise service delivery, while in-car IVAs represent the fastest-growth category driven by regulatory tailwinds and automaker partnerships.

By Deployment Mode

Sub-SegmentKey Trend
CloudElastic scaling and consumption-based pricing drive dominant adoption
On-Premise / EdgeData-sovereignty regulations and latency requirements fuel rapid expansion.


Cloud remains the default deployment for most organizations due to lower upfront costs and continuous model update capabilities. On-premise and edge solutions are gaining momentum in regulated verticals where data-residency mandates prohibit cross-border processing.

By User-Interface Technology

Sub-SegmentKey Trend
Voice-Based (ASR + TTS)Dominates through smart speakers and hands-free automotive use cases
Text-Based (Text-to-Text)Web and mobile chat support remain the primary enterprise channel
Multimodal (Voice-Visual)Spatial computing and AR/VR headsets are creating new interaction paradigms.


Voice-based interfaces lead due to their natural fit with consumer hardware form factors. Multimodal solutions combining voice, screen, and gesture are the fastest-growing category as AR/VR platforms mature.

By End-User

Sub-SegmentKey Trend
Retail & eCommerceConversational commerce driving product discovery and post-purchase support
BFSIFraud detection, account servicing, and robo-advisory IVA deployments scaling
HealthcareVirtual triage, medication adherence, and mental-health bots attracting venture capital
Telecom & ITSelf-service helpdesks and network-diagnostics assistants are reducing support costs.


Retail and eCommerce leads by revenue share as merchants embed assistants across the purchase journey. Healthcare is the fastest-growing vertical, with venture funding for AI-based clinical tools exceeding USD 2.1 billion in 2024.


 

Download PDF ×

We do not share your information with anyone. However, we may send you emails based on your report interest from time to time. You may contact us at any time to opt-out.