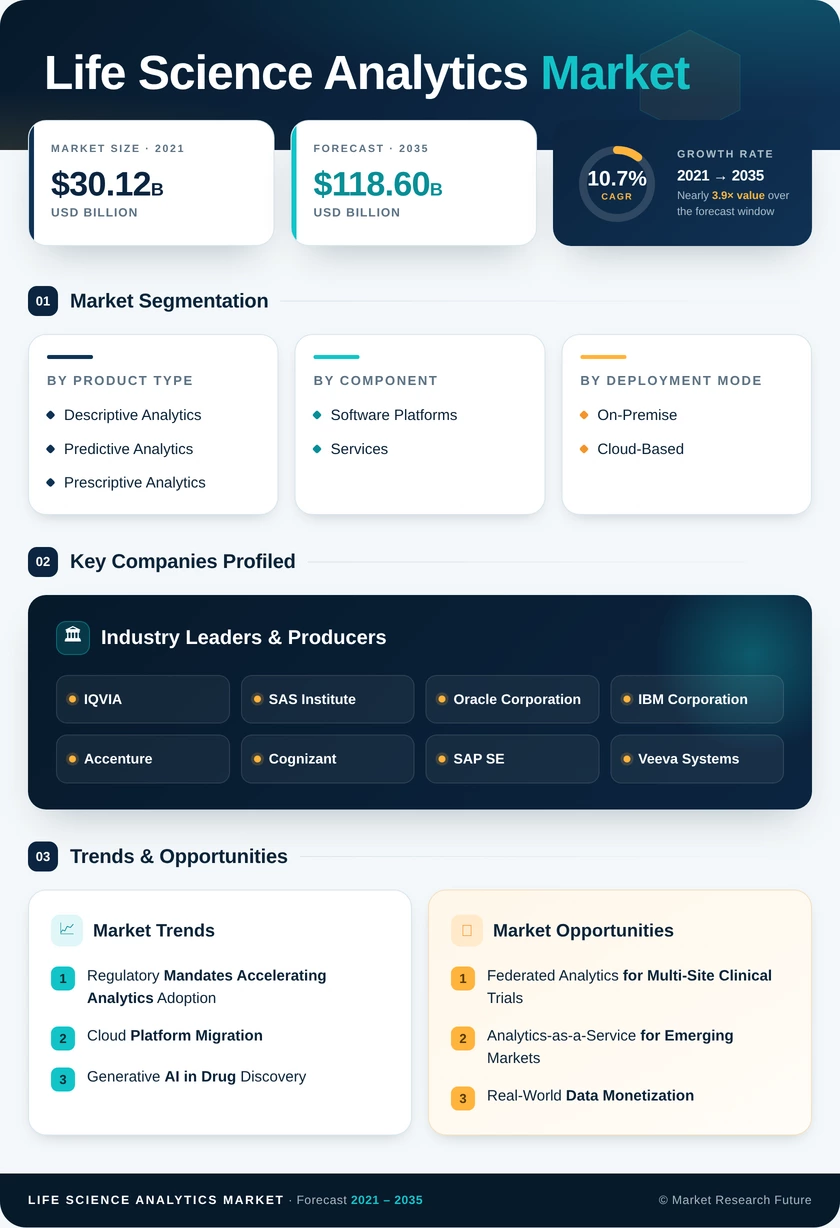
Life Science Analytics Market (2025 - 2035)

ID: MRFR/HC/7098-HCR
200 Pages
Satyendra Maurya
Last Updated: July 10, 2026
Life Science Analytics Market Research Report By Application (Drug Discovery, Clinical Trials, Genomic Data Analysis, Sales and Marketing Analytics, Regulatory Compliance), By Type (Descriptive Analytics, Predictive Analytics, Prescriptive Analytics, Cognitive Analytics), By Deployment Mode (On-Premise, Cloud-Based, Hybrid), By End User (Pharmaceutical Companies, Biotechnology Companies, Contract Research Organizations, Academic Institutions) and By Regional (North America, Europe, South America, Asia Pacific, Middle East and Africa) - Industry Forecast to 2035.
Life Science Analytics Market
Market Size
Forecast Period2025-2035
CAGR (2025-2035)10.7%
2025 Market SizeUSD 42.90 Billion
2035 Market SizeUSD 118.60 Billion
Key Players
IQVIA
SAS Institute
Oracle Corporation
IBM Corporation
Accenture
Cognizant
Opportunities
  • Federated Analytics for Multi-Site Clinical Trials
  • Analytics-as-a-Service for Emerging Markets
  • Real-World Data Monetization
  1. 1 Market Overview |
    1. 1.1 Study Assumptions & Market Definition |
    2. 1.2 Scope of the Study |
    3. 1.3 Research Methodology
  2. 2 Market Summary & Key Takeaways
  3. 3 Market Dynamics |
    1. 3.1 Market Drivers Analysis | |
      1. 3.1.1 FDA & EMA Real-World-Evidence Mandates | |
      2. 3.1.2 Cloud and SaaS Platform Migration | |
      3. 3.1.3 Generative AI Integration in Drug Discovery | |
      4. 3.1.4 Value-Based Reimbursement Pressure | |
      5. 3.1.5 Clinical Trial Globalization to Emerging Markets | |
      6. 3.1.6 Pharmacovigilance Automation Requirements | |
      7. 3.1.7 Connected Medical Device Data Proliferation |
    2. 3.2 Market Restraints Analysis | |
      1. 3.2.1 Data Privacy and Cross-Border Transfer Barriers | |
      2. 3.2.2 Talent Scarcity in Biostatistics and Data Science | |
      3. 3.2.3 Validation and Regulatory Qualification Complexity | |
      4. 3.2.4 Legacy System Integration Friction | |
      5. 3.2.5 High Upfront Implementation Costs for Mid-Size Firms |
    3. 3.3 Market Opportunity Analysis | |
      1. 3.3.1 Federated Analytics for Multi-Site Clinical Trials | |
      2. 3.3.2 Analytics-as-a-Service for Emerging Markets | |
      3. 3.3.3 Real-World Data Monetization | |
      4. 3.3.4 Connected Device and Digital Biomarker Analytics | |
      5. 3.3.5 ESG and Sustainability Reporting Analytics |
    4. 3.4 Industry Value Chain Analysis |
    5. 3.5 Porter's Five Forces Analysis
  4. 4 Global Life Science Analytics Market Size & Forecast (2021–2035) |
    1. 4.1 Historical Market Size (2021–2025) |
    2. 4.2 Current & Forecast Market Size (2026–2035) |
    3. 4.3 Market Size by Revenue (USD Billion) |
    4. 4.4 Year-over-Year Growth Analysis
  5. 5 Segmentation Analysis |
    1. 5.1 By Product Type | |
      1. 5.1.1 Descriptive Analytics | |
      2. 5.1.2 Predictive Analytics | |
      3. 5.1.3 Prescriptive Analytics |
    2. 5.2 By Component | |
      1. 5.2.1 Software Platforms | |
      2. 5.2.2 Services |
    3. 5.3 By Deployment Mode | |
      1. 5.3.1 On-Premise | |
      2. 5.3.2 Cloud-Based |
    4. 5.4 By Application | |
      1. 5.4.1 Research & Development | |
      2. 5.4.2 Pharmacovigilance | |
      3. 5.4.3 Sales, Marketing & Market Access |
    5. 5.5 By End User | |
      1. 5.5.1 Pharmaceutical & Biotechnology Companies | |
      2. 5.5.2 Medical Device Companies | |
      3. 5.5.3 Contract Research Organizations
  6. 6 Regional Analysis |
    1. 6.1 North America | |
      1. 6.1.1 United States | |
      2. 6.1.2 Canada | |
      3. 6.1.3 Mexico |
    2. 6.2 Europe | |
      1. 6.2.1 Germany | |
      2. 6.2.2 United Kingdom | |
      3. 6.2.3 France | |
      4. 6.2.4 Italy | |
      5. 6.2.5 Spain | |
      6. 6.2.6 Nordic Countries | |
      7. 6.2.7 Russia | |
      8. 6.2.8 Rest of Europe |
    3. 6.3 Asia-Pacific | |
      1. 6.3.1 China | |
      2. 6.3.2 India | |
      3. 6.3.3 Japan | |
      4. 6.3.4 South Korea | |
      5. 6.3.5 ASEAN | |
      6. 6.3.6 Rest of Asia-Pacific |
    4. 6.4 South America | |
      1. 6.4.1 Brazil | |
      2. 6.4.2 Argentina | |
      3. 6.4.3 Rest of South America |
    5. 6.5 Middle East & Africa | |
      1. 6.5.1 Saudi Arabia | |
      2. 6.5.2 UAE | |
      3. 6.5.3 South Africa | |
      4. 6.5.4 Egypt | |
      5. 6.5.5 Rest of MEA
  7. 7 Competitive Landscape |
    1. 7.1 Market Share Analysis (2025) |
    2. 7.2 Competitive Benchmarking Matrix |
    3. 7.3 Company Profiles | |
      1. 7.3.1 IQVIA | |
      2. 7.3.2 SAS Institute | |
      3. 7.3.3 Oracle Corporation | |
      4. 7.3.4 IBM Corporation | |
      5. 7.3.5 Accenture | |
      6. 7.3.6 Cognizant | |
      7. 7.3.7 SAP SE | |
      8. 7.3.8 Veeva Systems | |
      9. 7.3.9 Medidata Solutions (Dassault Systèmes) | |
      10. 7.3.10 Wipro
  8. 8 Future Outlook & Strategic Recommendations (2026–2035) |
    1. 8.1 Autonomous Analytics and Agentic AI |
    2. 8.2 Platform Consolidation and Ecosystem Economics |
    3. 8.3 Regulatory Convergence and Global Harmonization |
    4. 8.4 Precision Medicine and Companion Diagnostics Analytics
  9. 9 Recent Developments & News
  10. 10 Frequently Asked Questions (FAQs)
  11. 11 Report Scope & Methodology |
    1. 11.1 Study Period & Base Year |
    2. 11.2 Data Sources & Citations |
    3. 11.3 Abbreviations
  12. 12 LIST OF TABLES |
  13. TABLE 1 Global Life Science Analytics Market Size & Forecast, by Revenue (USD Billion), 2021–2035 |
  14. TABLE 2 Global Life Science Analytics Market – Year-over-Year Growth Analysis, 2021–2035 |
  15. TABLE 3 Market Driver Impact Analysis, 2026–2035 |
  16. TABLE 4 Market Restraint Impact Analysis, 2026–2035 |
  17. TABLE 5 Global Life Science Analytics Market Size, by Product Type, 2021–2035 (USD Billion) |
  18. TABLE 6 Global Life Science Analytics Market Size, by Component, 2021–2035 (USD Billion) |
  19. TABLE 7 Global Life Science Analytics Market Size, by Deployment Mode, 2021–2035 (USD Billion) |
  20. TABLE 8 Global Life Science Analytics Market Size, by Application, 2021–2035 (USD Billion) |
  21. TABLE 9 Global Life Science Analytics Market Size, by End User, 2021–2035 (USD Billion) |
  22. TABLE 10 Global Life Science Analytics Market Size, by Region, 2021–2035 (USD Billion) |
  23. TABLE 11 North America Life Science Analytics Market Size, by Country, 2021–2035 (USD Billion) |
  24. TABLE 12 Europe Life Science Analytics Market Size, by Country, 2021–2035 (USD Billion) |
  25. TABLE 13 Asia-Pacific Life Science Analytics Market Size, by Country, 2021–2035 (USD Billion) |
  26. TABLE 14 South America Life Science Analytics Market Size, by Country, 2021–2035 (USD Billion) |
  27. TABLE 15 Middle East & Africa Life Science Analytics Market Size, by Country, 2021–2035 (USD Billion) |
  28. TABLE 16 Competitive Benchmarking Matrix – Global Life Science Analytics Market, 2025 |
  29. TABLE 17 Company Profiles – Key Players, Global Life Science Analytics Market |
  30. TABLE 18 Recent Developments & Strategic Announcements, 2023–2025 |
  31. TABLE 19 North America Life Science Analytics Market Size, by Product Type, 2021–2035 (USD Billion) |
  32. TABLE 20 North America Life Science Analytics Market Size, by Component, 2021–2035 (USD Billion) |
  33. TABLE 21 North America Life Science Analytics Market Size, by Deployment Mode, 2021–2035 (USD Billion) |
  34. TABLE 22 North America Life Science Analytics Market Size, by Application, 2021–2035 (USD Billion) |
  35. TABLE 23 North America Life Science Analytics Market Size, by End User, 2021–2035 (USD Billion) |
  36. TABLE 24 Europe Life Science Analytics Market Size, by Product Type, 2021–2035 (USD Billion) |
  37. TABLE 25 Europe Life Science Analytics Market Size, by Component, 2021–2035 (USD Billion) |
  38. TABLE 26 Europe Life Science Analytics Market Size, by Deployment Mode, 2021–2035 (USD Billion) |
  39. TABLE 27 Europe Life Science Analytics Market Size, by Application, 2021–2035 (USD Billion) |
  40. TABLE 28 Europe Life Science Analytics Market Size, by End User, 2021–2035 (USD Billion) |
  41. TABLE 29 Asia-Pacific Life Science Analytics Market Size, by Product Type, 2021–2035 (USD Billion) |
  42. TABLE 30 Asia-Pacific Life Science Analytics Market Size, by Component, 2021–2035 (USD Billion) |
  43. TABLE 31 Asia-Pacific Life Science Analytics Market Size, by Deployment Mode, 2021–2035 (USD Billion) |
  44. TABLE 32 Asia-Pacific Life Science Analytics Market Size, by Application, 2021–2035 (USD Billion) |
  45. TABLE 33 Asia-Pacific Life Science Analytics Market Size, by End User, 2021–2035 (USD Billion) |
  46. TABLE 34 South America Life Science Analytics Market Size, by Product Type, 2021–2035 (USD Billion) |
  47. TABLE 35 South America Life Science Analytics Market Size, by Component, 2021–2035 (USD Billion) |
  48. TABLE 36 South America Life Science Analytics Market Size, by Deployment Mode, 2021–2035 (USD Billion) |
  49. TABLE 37 South America Life Science Analytics Market Size, by Application, 2021–2035 (USD Billion) |
  50. TABLE 38 South America Life Science Analytics Market Size, by End User, 2021–2035 (USD Billion) |
  51. TABLE 39 Middle East & Africa Life Science Analytics Market Size, by Product Type, 2021–2035 (USD Billion) |
  52. TABLE 40 Middle East & Africa Life Science Analytics Market Size, by Component, 2021–2035 (USD Billion) |
  53. TABLE 41 Middle East & Africa Life Science Analytics Market Size, by Deployment Mode, 2021–2035 (USD Billion) |
  54. TABLE 42 Middle East & Africa Life Science Analytics Market Size, by Application, 2021–2035 (USD Billion) |
  55. TABLE 43 Middle East & Africa Life Science Analytics Market Size, by End User, 2021–2035 (USD Billion) |
  56. TABLE 44 Report Scope & Methodology Summary |
  57. TABLE 45 Detailed Sources and Citations
  58. 13 LIST OF FIGURES |
  59. FIGURE 1 Life Science Analytics Market Dynamics Overview |
  60. FIGURE 2 Industry Value Chain Analysis |
  61. FIGURE 3 Porter's Five Forces Analysis |
  62. FIGURE 4 Global Life Science Analytics Market Size Trend (USD Billion), 2021–2035 |
  63. FIGURE 5 Life Science Analytics Market Share, by Product Type (2025) |
  64. FIGURE 6 Life Science Analytics Market Share, by Component (2025) |
  65. FIGURE 7 Life Science Analytics Market Share, by Deployment Mode (2025) |
  66. FIGURE 8 Life Science Analytics Market Share, by Application (2025) |
  67. FIGURE 9 Life Science Analytics Market Share, by End User (2025) |
  68. FIGURE 10 Life Science Analytics Market Share, by Region (2025) |
  69. FIGURE 11 North America Life Science Analytics Market Share, by Country (2025) |
  70. FIGURE 12 Europe Life Science Analytics Market Share, by Country (2025) |
  71. FIGURE 13 Asia-Pacific Life Science Analytics Market Share, by Country (2025) |
  72. FIGURE 14 South America Life Science Analytics Market Share, by Country (2025) |
  73. FIGURE 15 Middle East & Africa Life Science Analytics Market Share, by Country (2025) |
  74. FIGURE 16 Competitive Landscape – Market Share of Key Players (2025) |
  75. FIGURE 17 Competitive Positioning Matrix

SEGMENTATION QUICK REFERENCE

DimensionSub-SegmentsDominant SegmentFastest Growing Segment
Product TypeDescriptive Analytics, Predictive Analytics, Prescriptive AnalyticsDescriptive AnalyticsPrescriptive Analytics
ComponentSoftware Platforms, ServicesServicesSoftware Platforms
Deployment ModeOn-Premise, Cloud-BasedOn-PremiseCloud-Based
ApplicationResearch & Development, Pharmacovigilance, Sales Marketing & Market AccessResearch & DevelopmentSales Marketing & Market Access
End UserPharmaceutical & Biotechnology Companies, Medical Device Companies, Contract Research OrganizationsPharmaceutical & Biotechnology CompaniesMedical Device Companies
GeographyNorth America, Europe, Asia-Pacific, South America, Middle East & AfricaNorth AmericaAsia-Pacific


MARKET SEGMENTATION OVERVIEW

By Product Type

Sub-SegmentKey Trend
Descriptive AnalyticsRemains essential for regulatory compliance reporting and safety-update submissions
Predictive AnalyticsGrowing adoption for adverse-event forecasting and demand-supply planning
Prescriptive AnalyticsEmerging as the high-growth category driven by automated decision-support engines


Descriptive analytics continues to serve as the foundational layer, satisfying mandatory regulatory reporting requirements. Prescriptive analytics is gaining rapid traction as sponsors demand platforms that recommend specific actions — from adjusting trial enrollment parameters to optimizing commercial territory allocation — rather than simply presenting historical summaries.

By Component

Sub-SegmentKey Trend
Software PlatformsSelf-service interfaces and embedded AI modules reducing consulting dependence
ServicesManaged analytics and integration consulting still dominate current spend


Services hold the majority of current revenue due to the complexity of implementing analytics within validated pharma environments. Software platforms are accelerating as vendors embed pre-trained models and no-code dashboards that empower business users without data-science expertise.

By Deployment Mode

Sub-SegmentKey Trend
On-PremisePreferred where data sovereignty and GxP validation are non-negotiable
Cloud-BasedRapid migration driven by cost savings, scalability, and hyperscaler GxP qualification


On-premise installations dominate installed base, particularly among large pharma companies with legacy validated environments. Cloud-based models are closing the gap as AWS, Azure, and GCP achieve regulatory-grade qualification, offering sponsors elastic compute without multi-year capital commitments.

By Application

Sub-SegmentKey Trend
Research & DevelopmentBiomarker analytics, trial design optimization, and real-world-evidence generation
PharmacovigilanceAutomated signal detection and case-processing workflow analytics
Sales, Marketing & Market AccessMultichannel HCP engagement analytics, pricing, and outcomes-based contracting


R&D applications remain the largest revenue contributor, reflecting the industry's focus on accelerating drug development timelines and reducing clinical attrition. Sales, marketing, and market access analytics represent the fastest-growing application area as payers demand continuous outcomes evidence and sponsors invest in omnichannel commercial strategies.

By End User

Sub-SegmentKey Trend
Pharmaceutical & Biotechnology CompaniesFull-spectrum analytics across pipeline management, manufacturing, and commercial
Medical Device CompaniesConnected-device data analytics and post-market surveillance requirements
Contract Research OrganizationsClient-facing analytics dashboards for trial monitoring and regulatory submissions


Pharmaceutical and biotechnology companies are the largest buyers, deploying analytics across the entire product lifecycle. Medical device companies are the fastest-growing end-user segment, driven by the data proliferation from connected devices and expanding post-market surveillance mandates.


 

Download PDF ×

We do not share your information with anyone. However, we may send you emails based on your report interest from time to time. You may contact us at any time to opt-out.