Municipal Solid Waste Management Market

Key Players: Veolia Environnement, Waste Management (WM), Republic Services, SUEZ (post-demerger units), Remondis, Biffa, Clean Harbors, Beijing Capital Group

Municipal Solid Waste Management Market

Municipal Solid Waste Management Market Size, Share & Growth Analysis Report By Treatment Method (Landfill, Recycling & Material Recovery, Composting & Biological Treatment, Incineration / Energy Recovery, Other (Open Dump, Informal)), By Waste Type (Organic / Food Waste, Paper & Cardboard, Plastics, Glass, Metals, Other / Mixed Residual), By Source (Residential, Commercial & Institutional, Industrial (Non-Hazardous MSW)) and By Regional (North America, Europe, South America, Asia Pacific, Middle East and Africa) - Trends & Industry Forecast to 2035
ID: MRFR/Equip/26931-HCR
111 Pages
Priya Nagrale
Last Updated: June 16, 2026

Municipal Solid Waste Management Market Summary

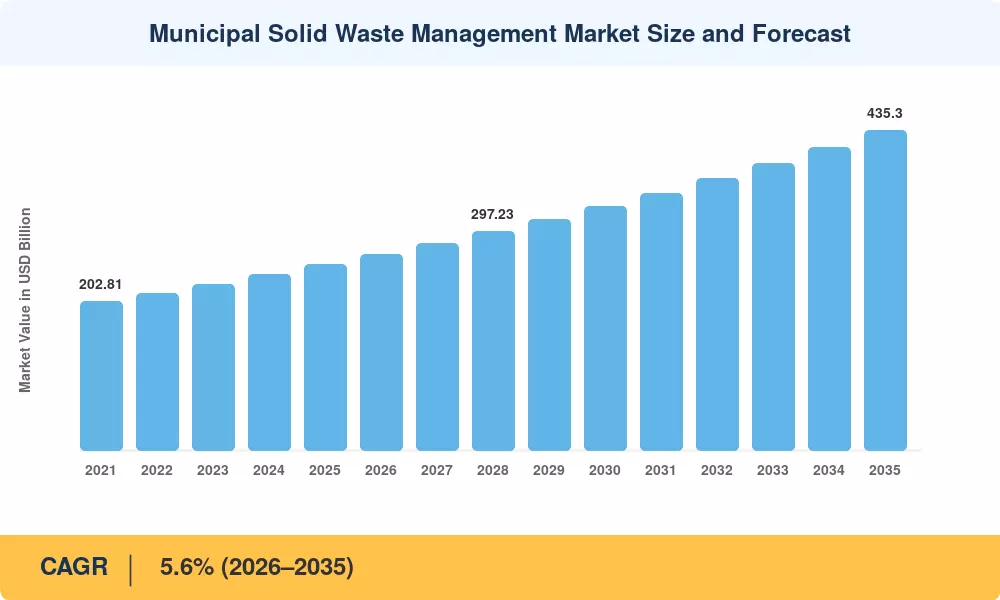
The Municipal Solid Waste Management Market reached an estimated USD 252.4 billion in 2025 and is projected to grow from USD 266.5 billion in 2026 to USD 435.3 billion by 2035, registering a CAGR of 5.6% during the forecast period (2026–2035). Two catalysts anchor this trajectory: China's "zero-waste city" pilot program—now spanning 113 cities with an aggregate investment exceeding USD 14 billion [1]—and the European Union's binding target to recycle 65% of municipal waste by 2035 under Directive 2018/851 [2]. These policy mandates have transformed what was once a basic municipal utility into a capital-intensive, technology-driven industry.

Legacy open-dump and uncontrolled landfill systems are rapidly being replaced by engineered treatment chains integrating mechanical-biological processing, sophisticated heat recovery and sensor-driven collection logistics. The World Bank projects that worldwide garbage generation would jump to 3.4 billion tonnes per year in 2050 from 2.01 billion in 2016 [3], pushing communities to invest in scalable infrastructure today. Private-sector participation in terms of build-operate-transfer (BOT) concessions exceeded USD 9.2 billion in new contract value in 2024 alone [4].

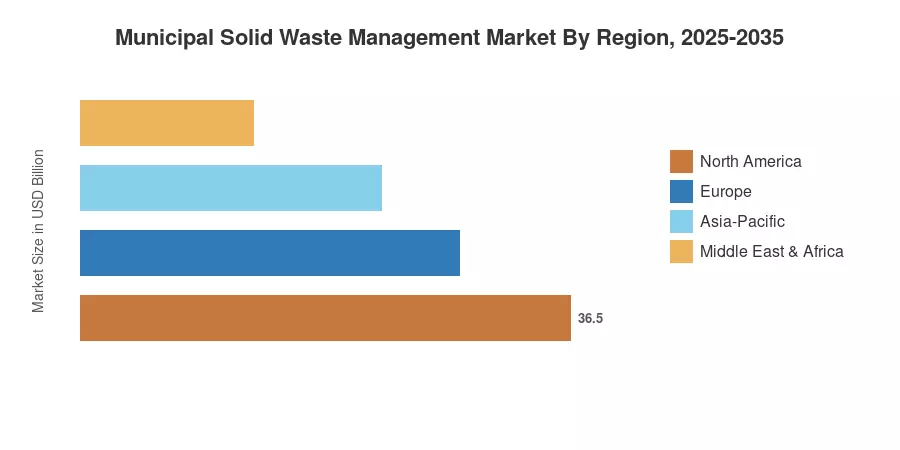
Asia-Pacific leads the Municipal Solid Waste Management Market with around 38% of the worldwide revenue, due to the high rates of urbanization, which are greater than 2.3% each year in India and Southeast Asia. This region also accounts for the fastest expanding opportunity with a projected CAGR of 6.9%. North America is the second largest, with about 27%, supported by strict EPA subtitle D restrictions and a developed recycling infrastructure [5]. Circular-economy mandates drive Europe’s share of about 23%. The Municipal Solid Waste Management Market will structurally continue to grow through 2035 as landfill prohibitions increase and carbon pricing mechanisms tighten.

Key Report Takeaways

• By Treatment Method

  • Landfill operations account for the largest revenue share at approximately 41% of the Municipal Solid Waste Management Market, though regulatory pressure is steadily contracting new capacity additions.
  • Recycling and material-recovery operations are growing at the fastest segment CAGR of 7.1%, fueled by extended producer responsibility (EPR) legislation across 48 countries.
  • Thermal treatment (incineration and energy recovery) generated roughly USD 52.6 billion in 2025, reflecting rising adoption in land-scarce economies.

• By Waste Type

  • Organic waste constitutes approximately 44% of total MSW volume globally and commands the highest treatment expenditure within the Municipal Solid Waste Management Market.
  • Plastic waste segments are posting a CAGR of 6.8%, driven by chemical recycling investment and single-use plastic bans.

• By Region

  • Asia-Pacific leads the Municipal Solid Waste Management Market at 38% share, with China and India contributing over 60% of regional revenue.
  • The Middle East & Africa region is expected to grow at a CAGR of 7.3%, the highest among non-APAC regions, as Gulf states invest in modern waste infrastructure.
  • North America's market value is projected to reach approximately USD 112.8 billion by 2035, supported by federal infrastructure grants.


Municipal Solid Waste Management Market Size and Forecast (2021–2035)

Market-sizing combines bottom-up revenue summation from municipal contract databases, waste authority filings, and publicly stated operating revenue of prominent operators. Top-down validation cross-links World Bank, OECD and UNEP waste-generation figures with per-tonne treatment cost benchmarks to derive regional and worldwide revenue projections for the Municipal Solid Waste Management Market.

Municipal Solid Waste Management Market Size and Forecast
Our Impact
Enabled $4.3B Revenue Impact for Fortune 500 and Leading Multinationals
Partnering with 2000+ Global Organizations Each Year
30K+ Citations by Top-Tier Firms in the Industry

Driver Impact Analysis

Driver ~% Impact on CAGR Geographic Relevance Impact Timeline
Accelerating urbanization and population growth +1.4% Global, strongest in APAC & Africa Long-term (≥4 yr)
Stringent landfill diversion and recycling mandates +1.2% EU, North America, Japan Medium-term (2–4 yr)
Extended producer responsibility (EPR) expansion +0.9% EU, India, Canada Medium-term (2–4 yr)
Private-sector participation via PPP/BOT models +0.8% APAC, LATAM, MEA Short-term (≤2 yr)
Technology integration (AI sorting, IoT fleet management) +0.7% North America, Europe, China Medium-term (2–4 yr)
Carbon pricing and emissions trading schemes +0.4% EU, South Korea, California Long-term (≥4 yr)
Rising public health and environmental awareness +0.3% Global Long-term (≥4 yr)


Urbanization and Waste Generation Growth

The World Bank projects that the global urban population will reach 6.7 billion by 2050, up from 4.4 billion in 2020 [3]. Each percentage-point increase in urbanization correlates with a 1.04× rise in per-capita waste generation, according to UNEP analysis [13]. In Sub-Saharan Africa, urban populations are growing at 3.5% annually, yet formal waste collection coverage remains below 40% in most capital cities—creating a USD 8.2 billion infrastructure gap that governments and development banks are now actively financing [7].

Landfill Diversion and Recycling Mandates

The EU's Circular Economy Action Plan mandates that member states recycle 55% of municipal waste by 2025, 60% by 2030, and 65% by 2035, backed by infringement proceedings for non-compliance [2]. These binding targets have triggered over EUR 18 billion in announced recycling and composting plant investments between 2023 and 2026 [6]. In the United States, 27 states have enacted landfill diversion targets ranging from 50% to 90%, pushing operators within the Municipal Solid Waste Management Market toward material recovery and organic-processing alternatives [5].

Extended Producer Responsibility Expansion

EPR programs shift end-of-life management costs from municipalities to brand owners and importers. India's Plastic Waste Management Amendment Rules (2024) require producers to collect and recycle 100% of rigid plastic packaging by 2028 [9]. Canada's provincial EPR frameworks now cover printed paper, packaging, and hazardous household products across British Columbia, Ontario, and Quebec—representing combined producer obligations exceeding CAD 3.2 billion annually [14]. These schemes expand the addressable revenue pool within the Municipal Solid Waste Management Market by funding new collection and processing capacity.

Technology Integration and Digital Operations

AI-powered optical sorters can now classify 14 material streams at throughput rates exceeding 80 items per second, improving material-recovery facility yields by up to 25% [12]. IoT-enabled fill-level sensors in collection bins have reduced unnecessary truck dispatches by 30–40% in pilot deployments across Barcelona and Seoul [15]. The convergence of robotics, machine learning, and fleet telematics is reshaping operational economics for the Municipal Solid Waste Management Market, reducing per-tonne handling costs while improving environmental compliance.


Restraints Impact Analysis

The restraint impacts below are directional estimates of headwinds to Municipal Solid Waste Management Market growth. They do not net directly against driver impacts and should be read as qualitative severity indicators.

Restraint ~% Impact on CAGR Geographic Relevance Impact Timeline
High capital cost of modern treatment facilities –0.6% Emerging markets globally Long-term (≥4 yr)
Volatile recyclate commodity prices –0.5% Global Short-term (≤2 yr)
Informal waste-sector displacement challenges –0.4% APAC, Africa, LATAM Medium-term (2–4 yr)
NIMBY opposition to siting new facilities –0.3% North America, Europe Medium-term (2–4 yr)
Contamination rates undermining recycling economics –0.3% Global Short-term (≤2 yr)


Capital Intensity of Modern Infrastructure

A single large-scale mechanical-biological treatment facility costs between USD 120 million and USD 350 million, depending on throughput capacity and regional construction costs [7]. For municipalities in low-income countries—where per-capita waste management budgets average just USD 5–10 annually—such investments require concessional finance or development-bank guarantees. The IFC estimates that less than 15% of waste-sector PPP projects in Sub-Saharan Africa reach financial close, creating a persistent infrastructure deficit that constrains market expansion [7].

Recyclate Commodity Volatility

Global secondary-material prices swung by more than 40% between 2022 and 2024, driven by China's import restrictions, energy cost fluctuations, and demand shifts in downstream manufacturing [16]. Mixed-paper prices collapsed to USD 15 per tonne in early 2024 before recovering to USD 60 by year-end. These price swings make recycling-plant revenue projections unreliable, discouraging long-term capital commitments within the Municipal Solid Waste Management Market and pushing some operators back toward disposal-oriented models.

Informal Sector Integration

Approximately 20 million informal waste workers operate across Asia, Africa, and Latin America, recovering an estimated 15–20% of recyclable materials before formal collection systems reach them [3]. Formalizing this workforce is socially critical but operationally complex—displacement without integration risks both livelihood loss and reduced recycling rates. Programs in Colombia and India that provide informal workers with cooperative membership and guaranteed floor pricing have shown promise but remain difficult to scale [9].


Municipal Solid Waste Management Market Opportunities

Organic Waste Valorization at Scale

Organic fractions represent 40–60% of MSW in emerging economies yet remain overwhelmingly landfilled. Large-scale anaerobic-digestion parks that convert food waste into biogas and digestate fertilizer offer municipalities both diversion credit and energy revenue. India's GOBAR-Dhan scheme targets 500 community-scale biogas plants by 2027, representing an addressable opportunity exceeding USD 1.8 billion for technology suppliers and project developers [9].

Digital Fleet and Route Optimization

Smart-city platforms that integrate GPS tracking, fill-level sensors, and predictive analytics can reduce collection costs by 20–35% while cutting fleet carbon emissions. Municipalities in Scandinavian countries have demonstrated 28% fuel savings through dynamic routing [15]. As sensor costs fall below USD 25 per unit, adoption is becoming viable even in mid-tier cities across the Municipal Solid Waste Management Market.

Chemical and Advanced Recycling

Pyrolysis, gasification, and solvolysis technologies allow conversion of contaminated or mixed plastics into feedstock-grade hydrocarbons. Global announced chemical-recycling capacity exceeded 8 million tonnes annually by late 2024, with the American Chemistry Council tracking over 100 projects in development across the United States alone [11]. This emerging value chain expands recyclable material acceptance rates and creates premium revenue streams for operators in the Municipal Solid Waste Management Market.

Carbon-Credit Monetization

Landfill methane capture and destruction projects qualify for carbon credits under the Verified Carbon Standard and Gold Standard frameworks. With EU ETS allowance prices averaging EUR 68 per tonne in 2024 [10], operators who install gas-collection systems on existing landfills can generate significant ancillary revenue—estimated at USD 4–8 per tonne of waste managed, depending on methane yield and credit pricing.

Emerging-Market Greenfield Infrastructure

Sub-Saharan Africa and Southeast Asia collectively need over USD 40 billion in new waste-management infrastructure through 2035 to close the collection coverage gap [7]. Multilateral development banks, including the World Bank and the Asian Development Bank, have earmarked dedicated waste-sector lending windows. Operators who establish early concession positions in cities like Lagos, Dhaka, and Ho Chi Minh City stand to capture anchor shares of rapidly growing municipal budgets.


Municipal Solid Waste Management Market Future Outlook

AI-Enabled Autonomous Operations

Robotic sorting arms equipped with hyperspectral cameras and deep-learning classifiers are achieving purity rates above 95% for target material streams [12]. By 2030, autonomous refuse collection vehicles are expected to begin commercial deployment in controlled urban environments, drawing on the same lidar and mapping technologies proven in logistics. The Municipal Solid Waste Management Market will increasingly reward operators who integrate AI across the value chain—from predictive maintenance on compactors to dynamic pricing for recyclate sales.

Circular-Economy Platform Models

Digital waste-exchange platforms connecting generators, haulers, recyclers, and end-buyers are compressing traditional intermediation layers. Startups in Europe and India have raised over USD 1.5 billion in venture funding since 2022 for marketplace models that match waste streams with recycling demand in real time [21]. These platforms generate transaction data that enables dynamic pricing, demand forecasting, and ESG-reporting automation—transforming waste from a cost center into a data-rich commodity ecosystem within the Municipal Solid Waste Management Market.

Decarbonization of Thermal Treatment

Next-generation energy-from-waste plants incorporating carbon capture, utilization, and storage (CCUS) are in pilot across Scandinavia and Japan, with projected capture rates of 90% of stack CO₂ emissions [22]. The IEA estimates that waste-sector CCUS could abate 120 million tonnes of CO₂ annually by 2035, positioning compliant facilities for premium carbon-credit revenue [10]. This decarbonization pathway is critical for the Municipal Solid Waste Management Market as jurisdictions tighten emission caps on incineration.

ESG Reporting and Municipal Disclosure Standards

The ISSB's sustainability disclosure standards (IFRS S1 and S2) and the EU's Corporate Sustainability Reporting Directive (CSRD) are bringing waste-management metrics into mainstream financial reporting [23]. Municipalities and corporate generators alike must now disclose waste diversion rates, landfill methane emissions, and recycling performance against quantified targets. This transparency drives procurement preference toward operators with verified ESG credentials, reshaping competitive dynamics within the Municipal Solid Waste Management Market through 2035.


Municipal Solid Waste Management Market Segmentation

By Treatment Method

Segment Key Metric Primary Demand Driver
Landfill 41.2% share Default disposal pathway; dominant in developing economies
Recycling & Material Recovery CAGR 7.1% EPR mandates; rising secondary-material demand
Composting & Biological Treatment USD 28.4 B (2025) Organic-waste diversion regulations
Incineration / Energy Recovery CAGR 5.9% Land scarcity: renewable-energy classification in select markets
Other (open dump, informal) 6.3% share Declining share as formalization progresses


Landfill remains the single largest treatment category within the Municipal Solid Waste Management Market. However, its dominance is eroding as jurisdictions impose escalating landfill taxes and outright bans on biodegradable waste disposal. The United Kingdom's landfill tax of GBP 103.70 per tonne (2025) has made alternative treatment economically preferable for most waste streams [17]. Recycling and material recovery represent the fastest-growing segment, propelled by EPR fee pools that subsidize collection and processing infrastructure. Germany's dual-system model, which channels producer fees into a dedicated recycling network, processes over 18 million tonnes annually and serves as a legislative template adopted across the EU [6].

Thermal treatment through incineration and energy-recovery facilities is expanding rapidly in Asia-Pacific, where land constraints and high waste-generation density favor volume-reduction technologies. China alone commissioned over 80 new incineration plants between 2022 and 2024, adding approximately 150,000 tonnes per day of processing capacity [1]. Composting and biological treatment occupy a smaller but rapidly growing niche—particularly in countries that have enacted mandatory organic-waste separation, such as France (effective 2024) and South Korea.

By Waste Type

Segment Key Metric Primary Demand Driver
Organic / Food Waste 44.1% of volume Largest generation stream; anaerobic-digestion investment
Paper & Cardboard USD 32.7 B (2025) Established recycling infrastructure; packaging regulation
Plastics CAGR 6.8% Chemical-recycling growth; single-use bans
Glass 4.8% share Deposit-return scheme expansion
Metals CAGR 4.9% Stable scrap-market demand; magnetic separation ease
Other / Mixed Residual 11.3% share Declining as source-segregation improves


Organic waste dominates the Municipal Solid Waste Management Market by volume and is increasingly viewed as a resource rather than a disposal burden. Municipal food-waste collection programs have expanded from roughly 120 cities globally in 2018 to over 600 in 2025, unlocking biogas production capacity exceeding 12 GW thermal equivalent [8]. Plastics command outsized attention relative to their volume share due to environmental visibility and legislative momentum—over 90 countries have enacted some form of plastic-bag ban or single-use restriction, driving demand for advanced sorting and chemical recycling within the Municipal Solid Waste Management Market.

By Source

Segment Key Metric Primary Demand Driver
Residential 58.2% share Largest generation source: curbside collection contracts
Commercial & Institutional CAGR 6.3% Hospitality, retail, and office-complex waste obligations
Industrial (non-hazardous MSW) USD 23.8 B (2025) Manufacturing packaging waste; compliance reporting


Residential collection contracts form the revenue backbone of the Municipal Solid Waste Management Market, accounting for the majority of municipal procurement spending. Commercial generators—restaurants, hotels, office complexes, and retail chains—represent the fastest-growing source segment as corporate ESG commitments and CSRD compliance require auditable waste-diversion reporting. Large commercial generators increasingly sign direct service agreements with specialized operators rather than relying on municipal contracts, introducing competitive pressure that improves service quality and recycling rates.


Regional Market Share Analysis

Region Key Metric Primary Investment Themes
Asia-Pacific 38.1% share (2025) Urbanization-driven capacity build; PPP concessions
North America USD 68.1 B (2025) Landfill diversion compliance; advanced recycling
Europe CAGR 5.2% Circular-economy mandates; incineration-to-recycling shift
South America USD 14.9 B (2025) Formalization of collection; sanitary landfill upgrades
Middle East & Africa CAGR 7.3% Greenfield infrastructure; development-bank financing
Total USD 252.4 B (2025)

The Municipal Solid Waste Management Market exhibits significant regional variation driven by waste-generation volumes, regulatory maturity, and available treatment infrastructure.


Asia-Pacific

Country Key Metric Key Driver
China 42% of regional share Zero-waste city pilot; incineration capacity doubling
India CAGR 8.2% Swachh Bharat Mission 2.0; EPR enforcement
Japan USD 11.4 B (2025) Advanced thermal treatment; high recycling discipline
Southeast Asia CAGR 7.8% Rapid urbanization: ADB financing pipelines


China's Ministry of Ecology and Environment reported that urban domestic waste incineration capacity reached 1.04 million tonnes per day by end-2024, processing over 60% of the nation's collected MSW [1]. India's Municipal Solid Waste Management Market opportunity centers on closing the treatment gap—only 30% of collected waste currently undergoes scientific processing, leaving an estimated 95 million tonnes annually untreated [9]. Japan's mature system, anchored by stringent dioxin controls and high citizen participation, serves as a benchmark for thermal-treatment efficiency across the region.

North America

Country Key Metric Key Driver
United States 82% of regional share EPA subtitle D; state-level diversion mandates
Canada CAGR 5.8% Provincial EPR rollouts; organics bans
Mexico USD 4.1 B (2025) Federal Clean Mexico program; sanitary landfill conversion


The United States generated approximately 292 million tons of MSW in 2023, with a national recycling rate of 32% [5]. Federal infrastructure legislation allocated USD 3.5 billion in grants for solid-waste infrastructure between 2022 and 2026, catalyzing state matching programs. Canada's organics-diversion policies—particularly Ontario's Food and Organic Waste Policy Statement—are driving composting and anaerobic-digestion facility construction, reinforcing growth prospects for the Municipal Solid Waste Management Market in the region.

Europe

Country Key Metric Key Driver
Germany 24% of regional share Closed-loop packaging ordinance; deposit systems
France CAGR 5.4% Anti-Waste Law (AGEC); organic-waste separation mandate
United Kingdom USD 9.8 B (2025) Environment Act 2021; consistent collection reforms


Europe's Municipal Solid Waste Management Market is shaped by the most prescriptive regulatory environment globally. The EU Landfill Directive limits landfill acceptance to 10% of MSW by 2035 [2], effectively mandating that member states invest in recycling, composting, and energy-recovery capacity. Germany leads with a recycling rate exceeding 66%, while southern and eastern European states are accelerating infrastructure investment to close compliance gaps.

South America

Country Key Metric Key Driver
Brazil 61% of regional share National Solid Waste Policy (PNRS); landfill closure mandates
Argentina CAGR 6.1% Urban expansion; GIRSU federal program
Colombia USD 1.7 B (2025) Inclusive recycler cooperatives; green-bond issuance


Brazil's National Solid Waste Policy (PNRS) requires all municipalities to develop integrated waste-management plans and close open dumps. Yet, compliance remains partial—approximately 40% of waste still goes to irregular disposal sites [7]. Inter-American Development Bank financing and national green-bond frameworks are beginning to close this gap, positioning the Municipal Solid Waste Management Market in the region for accelerated investment over the next decade.

Middle East & Africa

Country Key Metric Key Driver
Saudi Arabia 31% of regional share Vision 2030; MWAN recycling targets
UAE CAGR 8.0% Abu Dhabi Waste Management Center; circular-economy strategy
South Africa USD 2.9 B (2025) National Waste Management Strategy; landfill tax
Nigeria CAGR 9.1% Lagos LAWMA reform; private-sector entry


The Middle East & Africa region represents the fastest-growing frontier within the Municipal Solid Waste Management Market outside Asia-Pacific. Saudi Arabia's MWAN (National Waste Management Center) targets 82% diversion from landfill by 2035 under Vision 2030, with PPP contracts valued at over USD 6 billion already tendered [20]. In Sub-Saharan Africa, population growth and urbanization are outpacing infrastructure development, but dedicated waste-sector bonds and DFI credit lines are emerging to bridge the funding gap.


Municipal Solid Waste Management Market By Region, 2025-2035

Competitive Benchmarking

The Municipal Solid Waste Management Market is moderately fragmented, with an estimated HHI of less than 500 and the top five players accounting for about 22-26% of global revenue. Concession frameworks at the regional and municipal level promote natural market segmentation. Cross-border consolidation intensified from 2022 to 2025 as financial sponsors sought platform acquisitions.

Company Est. Revenue Share Range Key Offerings for Municipal Solid Waste Management Market Strategic Positioning
Veolia Environnement ~7–9% Integrated collection, recycling and energy recovery Global full-service leader post-Suez acquisition
Waste Management (WM) ~6–8% Landfill, collection, recycling and renewable energy North America's dominant integrated operator
Republic Services ~4–6% Collection, transfer, landfill and sustainability services US-focused; polymer-center recycling investments
SUEZ (post-demerger units) ~3–5% Water-waste integrated treatment; WtE Strong in Europe and APAC concessions
Remondis ~2–4% Recycling, water services and industrial services Europe's largest private waste operator
Biffa ~1–3% Collection, industrial services, energy recovery UK market leader with anaerobic-digestion assets
Clean Harbors ~1–2% Environmental services, hazardous and MSW disposal Specialized compliance-driven positioning
Beijing Capital Group ~2–3% WtE, landfill, collection China's leading state-backed waste conglomerate
Covanta (now Reworld) ~1–3% Energy-from-waste, metals recovery Largest US WtE fleet
FCC Servicios Medio Ambiente ~2–3% Collection, treatment and street cleansing Iberian leader expanding in LATAM and MEA


Recent News & Developments


  • EU Commission (July 2024): Published implementing guidelines for the revised Waste Framework Directive, clarifying EPR fee modulation criteria that affect the Municipal Solid Waste Management Market across all 27 member states [Ref 6].


  • India CPCB (December 2023): Issued enforcement notices to 1,200 municipalities for non-compliance with Solid Waste Management Rules 2016, accelerating infrastructure procurement [Ref 9].


Municipal Solid Waste Management Market Report Scope

Parameter Detail
Market Scope Global Municipal Solid Waste Management Market covering collection, transportation, treatment, and disposal services
Study Period 2021–2035
CAGR (Forecast Period) 5.6% (2026–2035)
Market Size — Base Year (2025) USD 252.4 Billion
Market Size — End Year (2035) USD 435.3 Billion
Fastest Growing Segment Recycling & Material Recovery (CAGR 7.1%)
Companies Profiled 10 (Veolia, Waste Management, Republic Services, SUEZ, Remondis, Biffa, Clean Harbors, Beijing Capital Group, Covanta/Reworld, FCC)
Valuation Currency USD (Billion)


FAQs

How do landfill gas-to-energy projects affect operator margins?

Landfill gas capture typically adds USD 2–5 per tonne in ancillary revenue through electricity sales and carbon-credit monetization. Payback periods range from 4–7 years depending on gas yield and regional energy tariffs [Ref 10].

What due diligence factors matter most when evaluating waste-sector PPP concessions?

Host-government creditworthiness, tipping-fee escalation clauses, and force-majeure definitions carry the highest risk weighting. Concession tenure below 20 years rarely allows full capital recovery on treatment facilities [Ref 4].

How does contamination in single-stream recycling affect processing economics?

Contamination rates above 15% can reduce material-recovery revenue by 30–40%, often pushing facilities below breakeven. Dual-stream collection significantly lowers contamination but increases logistics costs [Ref 18].

Which emerging technologies pose a substitution risk to conventional incineration?

Hydrothermal carbonization and plasma gasification can process wet organic waste without pre-drying, reducing energy input by up to 40%. Both remain pre-commercial at the municipal scale as of 2025 [Ref 19].

How are carbon border adjustments influencing recycled-material trade flows?

The EU CBAM currently excludes waste-derived materials, but proposed scope expansions could impose carbon tariffs on imported recyclates produced with high-emission processes [Ref 10].

What role do deposit-return schemes play in improving collection quality?

Countries with bottle-deposit systems achieve 85–95% return rates for beverage containers versus 30–50% through curbside alone. Higher purity dramatically improves per-unit recycling economics [Ref 6].

How should investors assess stranded-asset risk for new landfill developments?

Accelerating diversion mandates in the EU and North America creates regulatory stranded-asset risk for greenfield landfills with planned lifespans beyond 2040. Diversified treatment portfolios mitigate this exposure [Ref 2].


Author
Author
Author Profile
Priya Nagrale LinkedIn
Senior Research Analyst
With an experience of over five years in market research industry (Chemicals & Materials domain), I gather and analyze market data from diverse sources to produce results, which are then presented back to a client. Also, provide recommendations based on the findings. As a Senior Research Analyst, I perform quality checks (QC) for market estimations, QC for reports, and handle queries and work extensively on client customizations. Also, handle the responsibilities of client proposals, report planning, report finalization, and execution

Research Approach


Secondary Research

The secondary research process involved comprehensive analysis of regulatory databases, environmental protection agency publications, waste management industry reports, and authoritative governmental organizations. Key sources included the US Environmental Protection Agency (EPA), European Environment Agency (EEA), Organisation for Economic Co-operation and Development (OECD) Environmental Statistics, World Bank What a Waste 2.0 Database, United Nations Environment Programme (UNEP), International Solid Waste Association (ISWA), US Energy Information Administration (EIA), Eurostat Waste Statistics, National Institute of Environmental Health Sciences (NIEHS), Interstate Waste Services Regulatory Database, California Department of Resources Recycling and Recovery (CalRecycle), UK Environment Agency, Japan Ministry of Environment 3R Initiative Reports, India Central Pollution Control Board (CPCB), China Ministry of Ecology and Environment, and Brazilian National Solid Waste Policy (PNRS) Implementation Reports. These sources were used to collect waste generation statistics, regulatory framework data, recycling rate benchmarks, landfill capacity trends, waste-to-energy facility metrics, and market landscape analysis for collection services, recycling & processing, disposal & landfill management, and waste-to-energy technologies.


Primary Research

In order to gather both qualitative and quantitative insights, supply-side and demand-side stakeholders were interviewed during the primary research process. CEOs, VPs of operations, sustainability directors, and heads of regulatory compliance from waste management service providers, equipment manufacturers, and technology vendors were examples of supply-side sources. Municipal solid waste directors, public works commissioners, procurement managers from local municipalities, county waste authorities, and commercial trash generators, such as retail chains and industrial sites, were examples of demand-side sources. In addition to gathering information on service acceptance trends, pricing structures, public-private partnership dynamics, and regulatory compliance costs, primary research validated market segmentation and infrastructure investment timetables.

Primary Respondent Breakdown:

Table

Copy

Category Breakdown

By Designation C-level Primaries (28%), Director Level (32%), Others (40%)

By Region North America (32%), Europe (30%), Asia-Pacific (28%), Rest of World (10%)


Market Size Estimation

Global market valuation was derived through revenue mapping and waste volume analysis. The methodology included:

Identification of 55+ key service providers and technology vendors across North America, Europe, Asia-Pacific, and Latin America

Service mapping across collection services, recycling & processing, disposal & landfill management, and waste-to-energy categories

Analysis of reported and modeled annual revenues specific to municipal solid waste management portfolios

Coverage of service providers representing 65-70% of global market share in 2024

Extrapolation using bottom-up (waste tonnage × service fee by country/region) and top-down (service provider revenue validation) approaches to derive segment-specific valuations

Integration of municipal budget allocations and tipping fee analysis across major metropolitan areas

Data Triangulation & Validation

Market estimates were validated through:

Cross-verification of waste generation per capita data against national statistics bureaus

Alignment of recycling rate projections with EU Circular Economy Action Plan targets and EPA Sustainable Materials Management goals

Calibration of waste-to-energy capacity forecasts against International Energy Agency (IEA) bioenergy statistics

Validation of landfill gas capture metrics with UNFCCC Clean Development Mechanism (CDM) project databases

Download Free Sample

Kindly complete the form below to receive a free sample of this Report

Download PDF ×

We do not share your information with anyone. However, we may send you emails based on your report interest from time to time. You may contact us at any time to opt-out.