SEGMENTATION QUICK REFERENCE
| Dimension | Sub-Segments | Dominant Segment | Fastest Growing Segment |
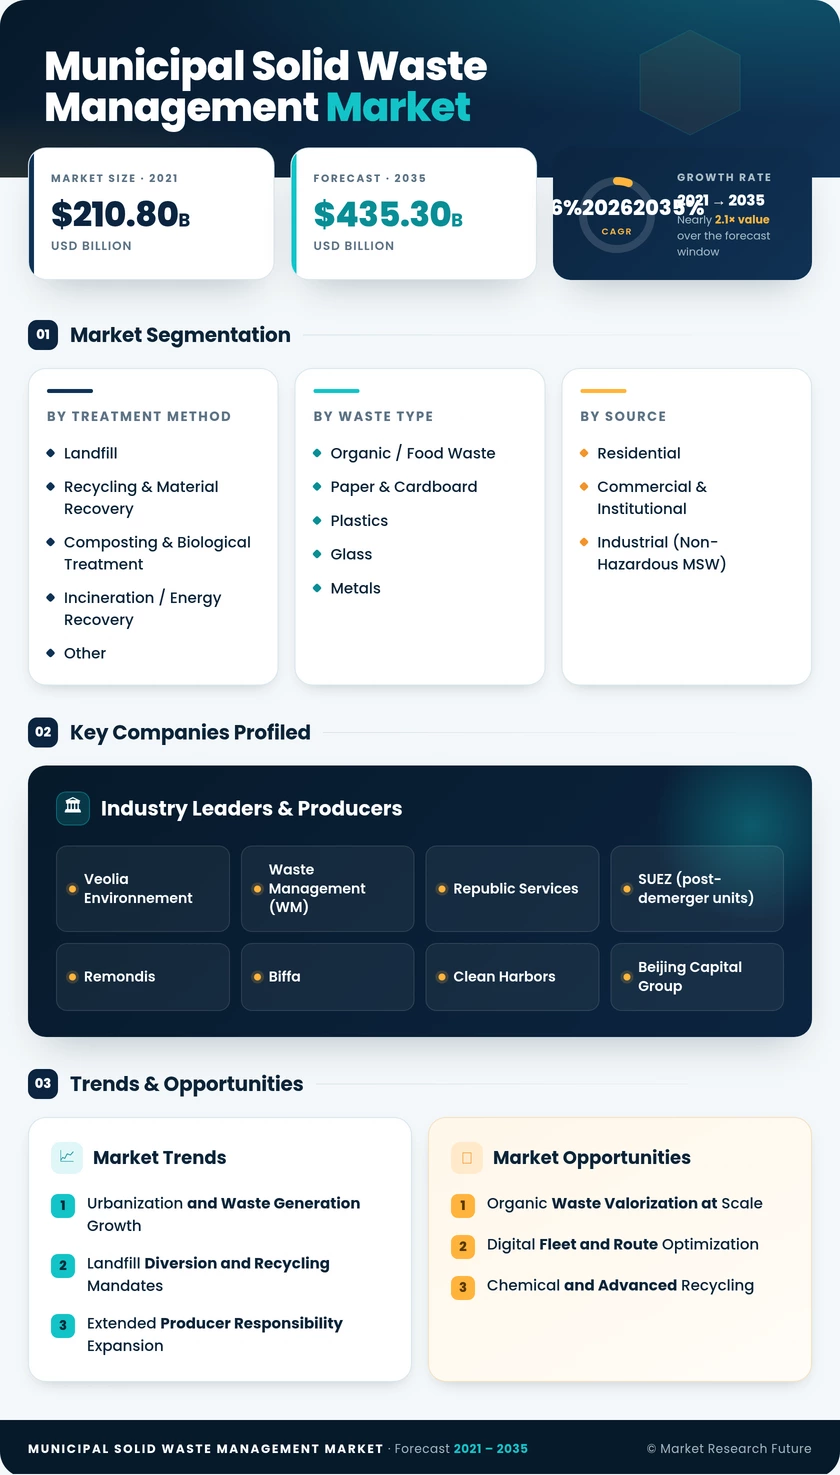
| By Treatment Method | Landfill; Recycling & Material Recovery; Composting & Biological Treatment; Incineration / Energy Recovery; Other | Landfill (41.2% share) | Recycling & Material Recovery (CAGR 7.1%) |
| By Waste Type | Organic / Food Waste; Paper & Cardboard; Plastics; Glass; Metals; Other / Mixed Residual | Organic / Food Waste (44.1% of volume) | Plastics (CAGR 6.8%) |
| By Source | Residential; Commercial & Institutional; Industrial (Non-Hazardous MSW) | Residential (58.2% share) | Commercial & Institutional (CAGR 6.3%) |
MARKET SEGMENTATION OVERVIEW
By Treatment Method
| Sub-Segment | Key Trend |
| Landfill | Landfill tax escalations and capacity restrictions are accelerating diversion and declining new-site approvals. |
| Recycling & Material Recovery | EPR fee pools and automated sorting technology are driving capacity expansion globally |
| Composting & Biological Treatment | Mandatory organic-waste separation laws expanding addressable volume in the EU and Asia |
| Incineration / Energy Recovery | Land-scarce Asian markets commissioning high-capacity WtE plants; CCUS pilots in Europe |
| Other (Open Dump, Informal) | Regulatory enforcement and development-bank financing are replacing informal systems with engineered alternatives. |
Landfill remains the default disposal pathway in emerging economies, but its share within the Municipal Solid Waste Management Market is declining as governments impose diversion mandates and escalating disposal taxes. Recycling and material recovery continue to attract the majority of new infrastructure investment globally, supported by expanding EPR frameworks and rising secondary-material demand from circular-economy commitments.
By Waste Type
| Sub-Segment | Key Trend |
| Organic / Food Waste | Anaerobic digestion and composting investment accelerating; food-waste collection programs expanding to 600+ cities |
| Paper & Cardboard | Stable recycling rates; packaging-design regulations shifting toward mono-material formats |
| Plastics | Chemical recycling commercializing; single-use bans and deposit-return schemes driving collection |
| Glass | Deposit-return programs achieving 85–95% capture rates were implemented. |
| Metals | Magnetic and eddy-current separation is mature; stable scrap-market pricing supports consistent recovery. |
| Other / Mixed Residual | Declining share as source-segregation programs improve material purity upstream. |
Organic waste generates the highest volume within the Municipal Solid Waste Management Market and represents the largest untapped valorization opportunity in developing regions. Plastics attract disproportionate policy attention and investment relative to volume share, with chemical-recycling capacity scaling rapidly across North America and Europe.
By Source
| Sub-Segment | Key Trend |
| Residential | Curbside collection modernization; pay-as-you-throw pricing models expanding |
| Commercial & Institutional | ESG-driven procurement; direct service agreements bypassing municipal contracts |
| Industrial (Non-Hazardous MSW) | Packaging-waste compliance reporting driving demand for auditable recycling services. |
Residential collection contracts account for the largest share of the Municipal Solid Waste Management Market by revenue and remain the primary channel through which municipalities procure waste services. Commercial and institutional sources represent the fastest-growing segment as corporate sustainability mandates and regulatory disclosure requirements compel generators to adopt higher-performing waste-management solutions.