Non-Lethal Weapons Market (2026 - 2035)

Non-Lethal Weapons Market Size, Share, Industry Trend & Analysis Report By Product Type (Ammunition, Area Denial, Directed-Energy Systems, Conducted-Energy Weapons, Chemical Agents, Acoustic Devices), By End User (Law Enforcement, Military), By Range (Short Range, Medium Range, Long Range), By Application (Crowd Control, Border Security, Personal Self-Defense, Perimeter Security) and By Region - Forecast to 2035
ID: MRFR/AD/0845-CR
103 Pages
Shubham Munde, Sejal Akre
Last Updated: July 28, 2026
Non-Lethal Weapons Market
Market Size
Forecast Period2026-2035
CAGR (2026-2035)7.25%
2025 Market SizeUSD 7.32 Billion
2035 Market SizeUSD 14.68 Billion
Key Players
Axon Enterprise
BAE Systems
Rheinmetall AG
Combined Systems Inc.
Safariland Group
Genasys Inc.
Opportunities
  • Emerging-Market Paramilitary Modernization
  • As-a-Service and Subscription Business Models
  • AI-Integrated Targeting and De-Escalation Systems

Non-Lethal Weapons Market Summary

The Non-Lethal Weapons Market was valued at USD 7.32 billion in 2025 and is projected to reach USD 7.82 billion in 2026 before expanding to USD 14.68 billion by 2035, registering a CAGR of 7.25% during the 2026–2035 forecast period. Rising civil liability exposure and mounting insurance premiums tied to excessive-force incidents have pushed procurement agencies worldwide toward proportional-force alternatives. Police reform legislation across North America and Europe now mandates minimum deployment ratios of less-lethal systems per patrol unit, anchoring baseline demand growth [1].

Technology modernization is reshaping the Non-Lethal Weapons Market at its core. Legacy kinetic-impact devices are being supplemented — and in some operational scenarios replaced — by beam-based incapacitation platforms and GPS-enabled smart munitions that allow precise standoff engagement. The U.S. Department of Defense allocated over USD 180 million in FY 2025 for Joint Non-Lethal Weapons Program research, accelerating the transition from indiscriminate crowd-dispersal tools to sensor-integrated, individually targeted systems [2]. Body-worn camera integration with conducted-energy weapons has become a standard bid requirement, linking discharge events to cloud-based evidence management.

North America retains its dominant position in the Non-Lethal Weapons Market with approximately 38% of 2025 revenue, driven by established procurement frameworks and the largest installed base of conducted-energy devices. Asia-Pacific represents the fastest-growing region at a projected CAGR of 9.10%, fueled by India's paramilitary modernization budget and China's internal-security spending. Europe holds the second-largest share at roughly 27%, supported by EU-wide policing harmonization directives. The convergence of homeland-security budgets and dual-use defense applications positions this market for sustained expansion through 2035.


Key Report Takeaways

• By Product Type

  • Ammunition accounted for approximately 28.8% of Non-Lethal Weapons Market revenue in 2025, reflecting broad adoption across law enforcement and military end users.
  • Directed-energy systems are forecast to register a 13.4% CAGR during 2026–2035, the fastest among all product categories.
  • Area-denial platforms reached USD 1.42 billion in 2025, driven by perimeter-security deployments.

• By End User

  • Law enforcement agencies commanded 69.2% of the Non-Lethal Weapons Market in 2025, underscoring the sector's dominance.
  • Military applications are advancing at a 7.65% CAGR as defense ministries embed less-lethal capability into rules-of-engagement protocols.

• By Region

Market Size and Forecast (2021–2035)

Market Research Future's estimates are constructed from a triangulation of top-down procurement budget analysis, bottom-up product shipment tracking, and vendor-reported revenue across 42 countries. Historical figures (2021–2024) reflect actual trade data; the base year (2025) is validated against customs declarations and defense-budget allocations. Forecast values (2026–2035) apply a calibrated compound growth model adjusted for policy, technology, and macroeconomic inputs.
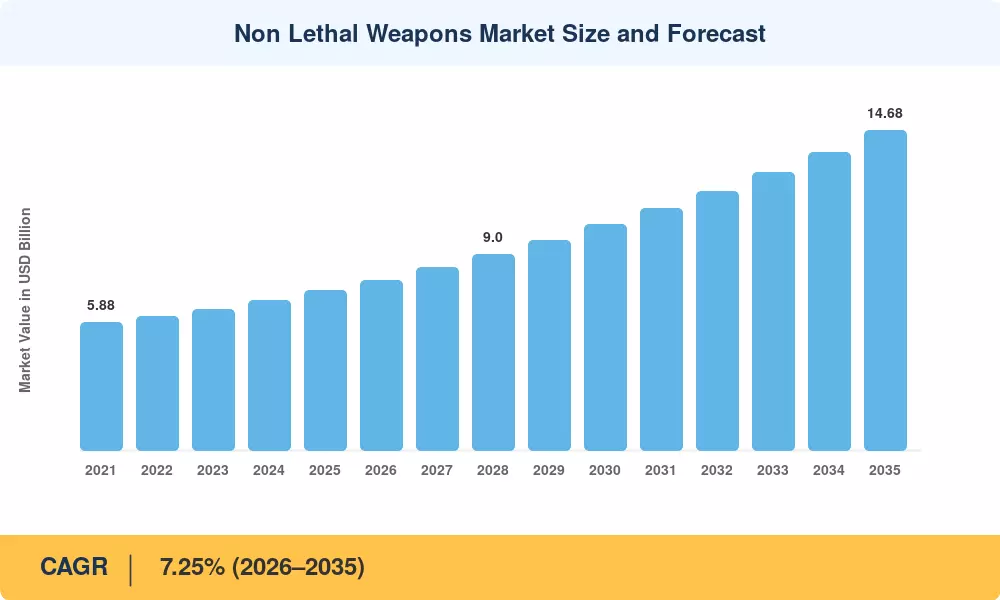
Non Lethal Weapons Market Size and Forecast
Our Impact
Enabled $4.3B Revenue Impact for Fortune 500 and Leading Multinationals
Partnering with 2000+ Global Organizations Each Year
30K+ Citations by Top-Tier Firms in the Industry

Driver Impact Analysis

Driver ~% Impact on CAGR Geographic Relevance Impact Timeline
Police-reform mandates and use-of-force legislation 1.8% North America, Europe Short-term (≤2 yr)
Directed-energy & smart-munition R&D investment 1.5% North America, Asia-Pacific Medium-term (2–4 yr)
Body-camera / evidence-management integration 1.2% Global Short-term (≤2 yr)
Civil-unrest frequency and homeland-security budgets 1.0% Global Long-term (≥4 yr)
Paramilitary & border-security modernization (APAC) 0.8% Asia-Pacific Medium-term (2–4 yr)
Dual-use defense adoption under NATO interoperability 0.6% Europe, North America Long-term (≥4 yr)
Insurance-premium reduction incentives 0.4% North America Short-term (≤2 yr)


Police-Reform Mandates and Use-of-Force Legislation

Legislative action across the United States and the European Union has established mandatory less-lethal deployment ratios that directly expand the addressable Non-Lethal Weapons Market. The George Floyd Justice in Policing Act framework and subsequent state-level statutes require agencies to document de-escalation tool availability before authorizing lethal force. Compliance audits now tie federal grant eligibility to minimum conducted-energy-weapon inventories, creating a procurement floor that did not exist before 2021 [1].

Directed-Energy and Smart-Munition R&D Investment

The U.S. Joint Non-Lethal Weapons Program committed over USD 180 million in FY 2025 to advance millimeter-wave and high-power-microwave systems for area denial [2]. These platforms offer standoff ranges exceeding 500 meters while minimizing collateral injury — a capability gap that conventional kinetic projectiles cannot fill. Israel and the United Kingdom have parallel programs accelerating beam-based systems through technology-readiness-level gates [10].

Body-Camera and Evidence-Management Integration

Procurement specifications now require conducted-energy weapons to auto-sync discharge data with body-worn cameras and cloud evidence platforms. Axon Enterprise reported that 87% of its TASER device sales in 2024 included bundled Axon Evidence licenses [13]. This integration requirement raises switching costs and favors vendors offering full hardware-software ecosystems within the Non-Lethal Weapons Market.

Civil-Unrest Frequency and Homeland-Security Budgets

Between 2020 and 2024, large-scale civil protests increased by an estimated 35% globally, according to the Armed Conflict Location & Event Data Project [4]. Governments have responded by earmarking riot-management line items within homeland-security budgets, creating sustained demand for scalable crowd-management systems that reduce litigation risk.


Restraints Impact Analysis

The restraint impact estimates below follow the same directional methodology described in Section 4. Negative values represent downward pressure on baseline growth.

Restraint ~% Impact on CAGR Geographic Relevance Impact Timeline
Regulatory bans on specific less-lethal munitions –0.9% Europe, Latin America Short-term (≤2 yr)
Negative public perception and protest backlash –0.7% Global Long-term (≥4 yr)
High unit costs for advanced platforms –0.5% Emerging markets Medium-term (2–4 yr)
Export-control restrictions and end-use monitoring –0.4% Global Long-term (≥4 yr)
Training complexity and certification bottlenecks –0.3% Asia-Pacific, MEA Medium-term (2–4 yr)


Regulatory Bans on Specific Munitions

Several European jurisdictions have restricted or banned specific kinetic-impact projectiles following documented injuries during protests. France suspended rubber-ball launcher deployments in 2023 pending medical-evidence reviews, and the European Parliament has debated union-wide restrictions on certain chemical irritants [15]. These bans shrink the addressable product mix within the Non-Lethal Weapons Market, forcing vendors to accelerate portfolio transitions toward compliant alternatives.

Negative Public Perception

Graphic social-media documentation of injuries caused by less-lethal weapons has generated reputational risk for procuring agencies. In 2024, Amnesty International documented over 1,800 cases of severe damage linked to less-lethal deployments globally, increasing political pressure on elected governments to postpone acquisitions [16]. This perception drag is most visible in procurement processes in democratic countries with strong civil-liberties scrutiny.


High Unit Costs for Advanced Platforms

Directed-energy and acoustic-hailing systems cost five to eight times more per unit than traditional kinetic launchers. Even with demonstrable operational benefits, the capital-expenditure barrier inhibits adoption by agencies in emerging economies with limited resources [17]. Leasing and as-a-service models are starting to fill this gap but remain in their infancy.


Non-Lethal Weapons Market Opportunities

Emerging-Market Paramilitary Modernization

India's Central Armed Police Forces modernization plan has earmarked INR 4,500 crore (approximately USD 540 million) through 2030 for riot-management and border-security upgrades [9]. Similar programs in Brazil and Indonesia present greenfield opportunities for vendors willing to establish local manufacturing or technology-transfer partnerships.

As-a-Service and Subscription Business Models

Axon Enterprise’s TASER-as-a-Service packages have proved that recurring-revenue models lower barriers to agency acquisition while also increasing predictability of vendor revenue. Scaling this concept to include acoustic devices and directed-energy systems could provide an opportunity for the 60% of worldwide law enforcement organizations who currently do not have budget power for capital acquisitions.


AI-Integrated Targeting and De-Escalation Systems

Directed-energy beams, overlaid with computer-vision-guided targeting information, might be deployed precisely on individual threat actors within a crowd, reducing bystander exposure. In 2024, the U.S. Army Research Laboratory funded USD 22 million for AI-assisted non-lethal aiming prototypes [7]. This capacity immediately tackles the collateral harm problem that now limits the Non-Lethal Weapons Market.


Data Monetization Through Deployment Analytics

Cloud-connected less-lethal platforms generate rich geospatial and behavioral datasets. Anonymized, aggregated deployment analytics can be licensed to urban-planning agencies, insurance underwriters, and academic researchers. Vendors that build analytics dashboards atop existing evidence-management platforms stand to capture a secondary revenue stream estimated at 8–12% of platform contract value.

Dual-Use Defense and Peacekeeping Procurement

United Nations peacekeeping missions procured over USD 95 million in non-lethal equipment between 2022 and 2024, and the UN Department of Operational Support has signaled a shift toward standardized less-lethal kits for all new mission deployments [5]. Vendors meeting NATO STANAG interoperability requirements hold a procurement advantage in these multilateral contracts.


Non-Lethal Weapons Market Future Outlook

AI-Autonomous Engagement and Decision-Support Systems

Artificial-intelligence modules will increasingly assist operators in selecting the appropriate non-lethal response level. Sensor-fusion systems combining facial-recognition exclusion zones, thermal imaging, and acoustic analysis can recommend targeted beam or projectile deployment in under 200 milliseconds. The U.S. Army Research Laboratory projects autonomous non-lethal engagement systems reaching initial operational capability by 2030 [7].

Platform-as-a-Service Economics

Recurring-revenue models are expected to account for over 30% of the Non-Lethal Weapons Market's enterprise value by 2032. Vendors will bundle hardware refresh cycles, cloud-evidence storage, training certification, and compliance dashboards into multi-year contracts, reducing procurement friction and increasing customer lifetime value across the Non-Lethal Weapons Market [13].

Electrification and Solid-State Power Systems

Directed-energy platforms depend on compact, high-density power sources. Advances in solid-state battery technology — with energy densities projected to exceed 500 Wh/kg by 2030 — will enable vehicle-portable and eventually man-portable beam weapons that operate independently of generator support [10]. This power transition parallels broader defense-electrification trends tracked by the International Energy Agency [22].

ESG Reporting and Ethical-Use Governance

Institutional investors are beginning to scrutinize less-lethal weapon manufacturers through ESG frameworks. Companies that publish auditable use-of-force outcome data and comply with the UN Basic Principles on the Use of Force will secure preferential access to sovereign wealth fund and pension fund capital. ESG-linked bond issuances in the defense sector exceeded USD 4.8 billion in 2024 [23].


Non-Lethal Weapons Market Segmentation

By Product Type

Segment Key Metric Primary Demand Driver
Ammunition 28.8% share (2025) Universal adoption across end users
Area Denial USD 1.42 Billion (2025) Perimeter and facility security
Directed-Energy Systems 13.4% CAGR (2026–2035) Standoff precision engagement
Conducted-Energy Weapons 23% share (2025) Law-enforcement patrol deployment
Chemical Agents 6.90% CAGR (2026–2035) Crowd-dispersal operations
Acoustic Devices USD 0.38 Billion (2025) Long-range warning and area denial


Ammunition remains the largest product segment in the Non-Lethal Weapons Market because of its compatibility with existing launcher platforms and relatively low unit cost. Rubber, foam, and sponge projectiles are procured in bulk by agencies worldwide, establishing a high-volume, low-margin revenue base. Conducted-energy weapons — primarily TASER-branded devices — represent the second-largest share, supported by mandatory patrol-deployment policies in over 18,000 U.S. law-enforcement agencies.

Directed-energy systems, while still a small revenue contributor in absolute terms, are registering the fastest growth within the Non-Lethal Weapons Market. Millimeter-wave Active Denial Systems and high-power-microwave platforms are transitioning from prototype to limited fielding, with full operational deployment expected across multiple NATO forces by 2031 [10].

By End User

Segment Key Metric Primary Demand Driver
Law Enforcement 69.2% share (2025) Reform mandates and patrol requirements
Military 7.65% CAGR (2026–2035) Rules-of-engagement modernization


Law enforcement dominates the Non-Lethal Weapons Market because agencies operate under civilian oversight frameworks that incentivize proportional-force documentation. Military adoption, though smaller in share, is accelerating as defense ministries integrate less-lethal options into checkpoint, peacekeeping, and force-protection scenarios where collateral-damage restrictions apply [5].

By Range

Segment Key Metric Primary Demand Driver
Short Range 51.7% share (2025) Patrol-level encounters and personal defense
Medium Range USD 1.85 Billion (2025) Tactical crowd management
Long Range 8.95% CAGR (2026–2035) Standoff and perimeter operations


Short-range systems — including conducted-energy weapons and chemical irritant dispensers — account for the majority of the Non-Lethal Weapons Market by virtue of their deployment in routine policing and personal-defense scenarios. Long-range platforms, including acoustic hailing devices and directed-energy systems, are growing fastest as military and border-security agencies prioritize standoff capability.

By Application

Segment Key Metric Primary Demand Driver
Crowd Control 41.3% share (2025) Protest-response and public-order policing
Border Security 7.85% CAGR (2026–2035) Territorial-integrity programs
Personal Self-Defense USD 0.78 Billion (2025) Civilian consumer market
Perimeter Security 18% share (2025) Critical-infrastructure protection


Crowd control commands the largest application share in the Non-Lethal Weapons Market, driven by sustained global protest activity and the institutional requirement to document graduated-force responses. Border-security applications are expanding rapidly as nations invest in integrated surveillance-and-response systems along contested frontiers [9].


Regional Market Share Analysis

Region Key Metric Primary Investment Themes
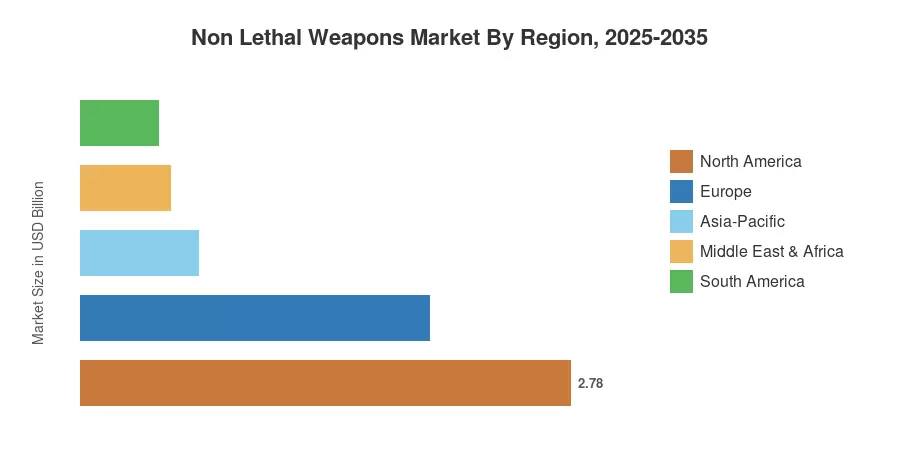
North America 38.0% share (2025) Police reform, JNLWP R&D, evidence integration
Europe 27.0% share (2025) EU harmonization, protest-response modernization
Asia-Pacific 9.10% CAGR (2026–2035) Paramilitary expansion, border security
South America USD 0.44 Billion (2025) Urban security, major-event preparedness
Middle East & Africa 7.0% share (2025) Internal security, critical-infrastructure protection
Total USD 7.32 Billion (2025)

The Non-Lethal Weapons Market exhibits a concentrated geographic structure, with North America and Europe collectively accounting for roughly 65% of global revenue. Asia-Pacific's rapid modernization investment is gradually rebalancing this distribution.


North America

Country Key Metric Key Driver
United States 78% of regional share Federal grant-linked procurement mandates
Canada 7.80% CAGR RCMP modernization programs
Mexico USD 0.11 Billion (2025) National Guard expansion


The United States anchors the Non-Lethal Weapons Market in North America through its combination of federal R&D spending, large municipal police forces, and an established vendor ecosystem. Department of Homeland Security grants now require less-lethal capability documentation as a condition of disbursement, institutionalizing demand at the agency level [1].

Europe

Country Key Metric Key Driver
Germany 22% of regional share Federal police modernization
United Kingdom 8.15% CAGR Counter-terrorism preparedness
France USD 0.31 Billion (2025) Gendarmerie equipment refresh
Italy 11% of regional share Public-order policing upgrades
Spain 6.90% CAGR Civil-Guard procurement cycles
Nordic Countries USD 0.09 Billion (2025) Interoperability with NATO standards
Russia 14% of regional share Internal-security spending
Rest of Europe 6.50% CAGR EU cohesion-fund-linked upgrades


European procurement of the Non-Lethal Weapons Market is shaped by the EU's Common Security and Defence Policy, which encourages standardized equipment across member-state police forces. The European Defence Fund allocated EUR 85 million to non-lethal technology programs in its 2024 work plan [8].

Asia-Pacific

Country Key Metric Key Driver
China 34% of regional share Internal-security apparatus spending
India 10.20% CAGR CAPF modernization plan
Japan USD 0.12 Billion (2025) Riot-police equipment renewal
South Korea 8.75% CAGR Protest-management doctrine updates
ASEAN 15% of regional share Maritime border security
Rest of Asia-Pacific USD 0.06 Billion (2025) Peacekeeping contribution kits


Asia-Pacific is the fastest-growing region in the Non-Lethal Weapons Market, led by India's INR 4,500 crore paramilitary modernization allocation and China's sustained public-security capital expenditure [9]. South Korea's defense acquisition agency approved a five-year less-lethal systems procurement plan in 2024, signaling demand acceleration.

South America

Country Key Metric Key Driver
Brazil 62% of regional share Urban-security mega-event legacy
Argentina 7.40% CAGR Federal police re-equipping
Rest of South America USD 0.07 Billion (2025) Regional cooperation frameworks


Brazil dominates South America's Non-Lethal Weapons Market, building on equipment investments made for the 2014 and 2016 mega-events. The Brazilian Ministry of Justice's National Public Security Fund continues to finance state-level police modernization through annual disbursements [20].

Middle East & Africa

Country Key Metric Key Driver
Saudi Arabia 28% of regional share Vision 2030 security infrastructure
UAE 8.60% CAGR Smart-city integrated security
South Africa USD 0.06 Billion (2025) Public-order policing needs
Egypt 18% of regional share Internal-security modernization
Rest of MEA 7.10% CAGR Peacekeeping and critical-infrastructure programs


Middle East & Africa procurement in the Non-Lethal Weapons Market is concentrated in Gulf Cooperation Council states, where security modernization budgets align with economic-diversification timelines. Saudi Arabia's Ministry of Interior allocated SAR 1.2 billion to less-lethal systems between 2023 and 2025 [21].


Non Lethal Weapons Market By Region, 2025-2035

Competitive Benchmarking

The Non-Lethal Weapons Market exhibits medium concentration, with the top five vendors capturing an estimated 42–48% of global revenue. The Herfindahl-Hirschman Index falls in the 800–1,200 range, indicating a moderately fragmented competitive structure. Vendor consolidation around integrated hardware-software platforms is gradually raising barriers to entry for smaller manufacturers.

Company Est. Revenue Share Range Key Offerings for Non-Lethal Weapons Market Strategic Positioning
Axon Enterprise ~12–16% TASER devices, Axon Evidence, Axon Body cameras Integrated ecosystem leader
BAE Systems ~6–9% Directed-energy systems, area-denial platforms Defense prime contractor
Rheinmetall AG ~5–8% Smoke/obscurant systems, kinetic launchers European defense anchor
Combined Systems Inc. ~4–7% Chemical munitions, flash-bang devices, launchers Specialty munitions leader
Safariland Group ~4–6% Chemical agents, less-lethal launchers, protective gear Law-enforcement portfolio
Genasys Inc. (LRAD) ~3–5% Long-range acoustic devices, mass-notification systems Acoustic technology niche
FN Herstal ~3–5% Less-lethal launchers, smart-round platforms NATO-qualified arms manufacturer
Condor Non-Lethal Technologies ~2–4% Rubber projectiles, tear-gas grenades, flash-bang Latin America specialist
Lamperd Less Lethal Inc. ~1–3% Wireless projectile systems, crowd-control solutions Emerging technology entrant
Raytheon (RTX) ~2–4% Active Denial System, millimeter-wave platforms Directed-energy defense leader


Recent News & Developments


  • Rheinmetall (July 2025) showcased the SSW40 (Squad Support Weapon 40) at live-fire demonstrations and industry displays. The SSW40 is a 40 mm grenade launcher that is comparable to an assault rifle in ergonomics, and fires magazine-fed medium velocity (MV) and low velocity (LV) rounds. Live demonstrations demonstrated the technologies used to reduce recoil and the extended range of 900 meters.


  • European Parliament (April 2024): Passed a non-binding resolution recommending member states review the medical evidence on kinetic-impact projectiles, signaling potential regulatory tightening [15].


Non-Lethal Weapons Market Report Scope

Parameter Detail
Market Scope Global Non-Lethal Weapons Market across product type, end user, range, application, and geography
Study Period 2021–2035
CAGR 7.25% (2026–2035)
Market Size (2025) USD 7.32 Billion
Market Size (2035) USD 14.68 Billion
Fastest Growing Segment Directed-energy systems (13.4% CAGR)
Companies Profiled Axon Enterprise, BAE Systems, Rheinmetall AG, Combined Systems, Safariland, Genasys, FN Herstal, Condor, Lamperd, Raytheon (RTX)
Valuation Currency USD Billion


FAQs

How do procurement agencies evaluate total cost of ownership for conducted-energy weapons versus kinetic launchers?
Agencies weigh a five-year lifecycle that includes hardware, cloud-evidence subscriptions, cartridge replenishment, and annual recertification. Conducted-energy platforms typically cost 2.5× more upfront but reduce litigation exposure by 30–40% [14].
What interoperability standards govern cross-border deployment of non-lethal systems?
NATO STANAG 4569 and its less-lethal annex define interoperability for allied forces. EU member states additionally follow European Committee for Standardization guidelines on chemical-agent concentration thresholds [5].
How do directed-energy platforms perform in adverse weather compared to kinetic alternatives?
Rain, fog, and dust degrade millimeter-wave beam effectiveness by 15–25% at ranges beyond 200 meters. Kinetic projectiles are less weather-sensitive but lack the scalable-intensity advantage that beam systems provide [10].
What liability frameworks apply when a non-lethal deployment causes serious injury?
Qualified-immunity protections vary by jurisdiction. Agencies in the U.S. face Section 1983 civil-rights claims, while European forces operate under proportionality tests set by the European Court of Human Rights [16].
Are civilian-market self-defense products subject to the same export controls as military-grade systems?
Consumer products below defined energy thresholds are generally exempt from Wassenaar Arrangement controls. Military-specification devices trigger end-use certification and often require government-to-government transfer agreements [18].
How do subscription-based procurement models affect agency budgeting cycles?
Subscriptions convert capital expenditure into operational expenditure, easing annual appropriations constraints. Agencies using these models report 20–25% faster adoption timelines versus traditional competitive-bid procurement [13].
What role do independent testing laboratories play in product certification for the Non-Lethal Weapons Market?
Accredited labs validate energy-transfer thresholds, chemical-agent concentrations, and material durability against ISO 17025 standards. Certification typically adds 6–12 months to product launch timelines [19].    
Author
Author
Author Profile
Shubham Munde LinkedIn
Team Lead - Research
Shubham brings over 7 years of expertise in Market Intelligence and Strategic Consulting, with a strong focus on the Automotive, Aerospace, and Defense sectors. Backed by a solid foundation in semiconductors, electronics, and software, he has successfully delivered high-impact syndicated and custom research on a global scale. His core strengths include market sizing, forecasting, competitive intelligence, consumer insights, and supply chain mapping. Widely recognized for developing scalable growth strategies, Shubham empowers clients to navigate complex markets and achieve a lasting competitive edge. Trusted by start-ups and Fortune 500 companies alike, he consistently converts challenges into strategic opportunities that drive sustainable growth.
Co-Author
Co-Author Profile
Sejal Akre LinkedIn
Senior Research Analyst
She has over 5 years of rich experience, in market research and consulting providing valuable market insights to client. Hands on expertise in management consulting, and extensive knowledge in domain including ICT, Automotive & Transportation and Aerospace & Defense. She is skilled in Go-to market strategy, industry analysis, market sizing, in depth company profiling, competitive intelligence & benchmarking and value chain amongst others.

Research Approach

Research Methodology on Non Lethal Weapons Market

1. Introduction:

The research methodology developed for this study on the non-lethal weapons market is based on a comprehensive framework of market analysis and forecasting. The research process aims to analyze and predict the market size, impact, and trends of the non-lethal weapons market. This methodology is designed to help stakeholders with the information and data necessary to develop comprehensive strategic decisions in the non-lethal weapons market. The research process involves identifying the drivers and restraints, and market dynamics such as value chain analysis and Porter’s Five Forces analysis. The data gathered is validated using experts and subject matter specialists. The data collected is further analyzed using primary and secondary research sources such as industry and market-specific databases, journals, and news publications.

2. Market Coverage:

The non-lethal weapons market is studied through qualitative and quantitative research approaches over a period of six months. The market is examined for different categories such as application, geography, product type and end user. The various aspects of the non-lethal weapons market such as market strategies, pricing structures, competitive landscape and market segmentation are also analyzed and discussed in detail.

3. Market Definition & Sources of Data:

Non-lethal weapons are defined as weapons and tactics which are capable of inflicting harm, injury or death at an acceptable level as compared to lethal weapons. The sources of data used for this research include both primary and secondary research methods. Databases such as The Business Research Company, Marketwatch, and Markets and Markets are used for the research. Secondary sources of information include industry white papers, press releases and media coverage.

4. Research Approach & Strategy:

This research methodology adopted a combined and qualitative/quantitative approach. Primary research is conducted through interviews with industry professionals, and trade associations. Data is also gathered from multiple secondary sources such as The Business Research Company, Marketwatch and other such databases. The analysis of the findings includes quantitative and qualitative analysis, key market indicators, and value chain analysis.

5. Research Methodology Used:

Primary Research:

MRFR conducted interviews with industry professionals, trade associations, and subject matter experts to validate the data collected and gain further insights into the non-lethal weapons market.

Secondary Research:

MRFR obtained data from numerous trade and market reports, industry and company reports, websites, white papers, and news sources.

6. Market Modelling:

MRFR used a combined research methodology of both primary and secondary research to model the non-lethal weapons market. The data is analyzed through statistical, technological and qualitative analysis using Microsoft Excel. It used the market dynamics and market trends to provide inputs in the development of the market size and market forecast.

7. Market Forecasting:

The purpose of market forecasting is to project the future growth rate of a given market. MRFR used various forecasting methods such as market demand-supply analysis and market trend analysis to calculate the market size and arrive at the market forecast. The market projections were validated through real-world business scenarios.

8. Analysis & Decision Adjustment:

The final output of the research is a comprehensive report covering all aspects of the non-lethal weapons market. The quantitative analysis was adjusted based on the findings from the qualitative research. The data is further analyzed and validated through expert opinions and industry feedback.

9. Validation Process:

MRFR validated the data collected through primary and secondary sources through interviews with industry experts and market participants. The data is also validated using software programs such as Microsoft Excel, SPSS and Stata.

10. Conclusion:

The research methodology used for this study provides an in-depth understanding of the non-lethal weapons market. This research allows us to gain insights into the current market scenario, industry dynamics and market trends. The research provides the necessary data and market intelligence to stakeholders necessary for strategic decision-making. The research also helps to gain insights into the factors that drive the growth in the non-lethal weapons market and the opportunities that can be tapped into by new market entrants.

Download Free Sample

Kindly complete the form below to receive a free sample of this Report

Download PDF ×

We do not share your information with anyone. However, we may send you emails based on your report interest from time to time. You may contact us at any time to opt-out.
















