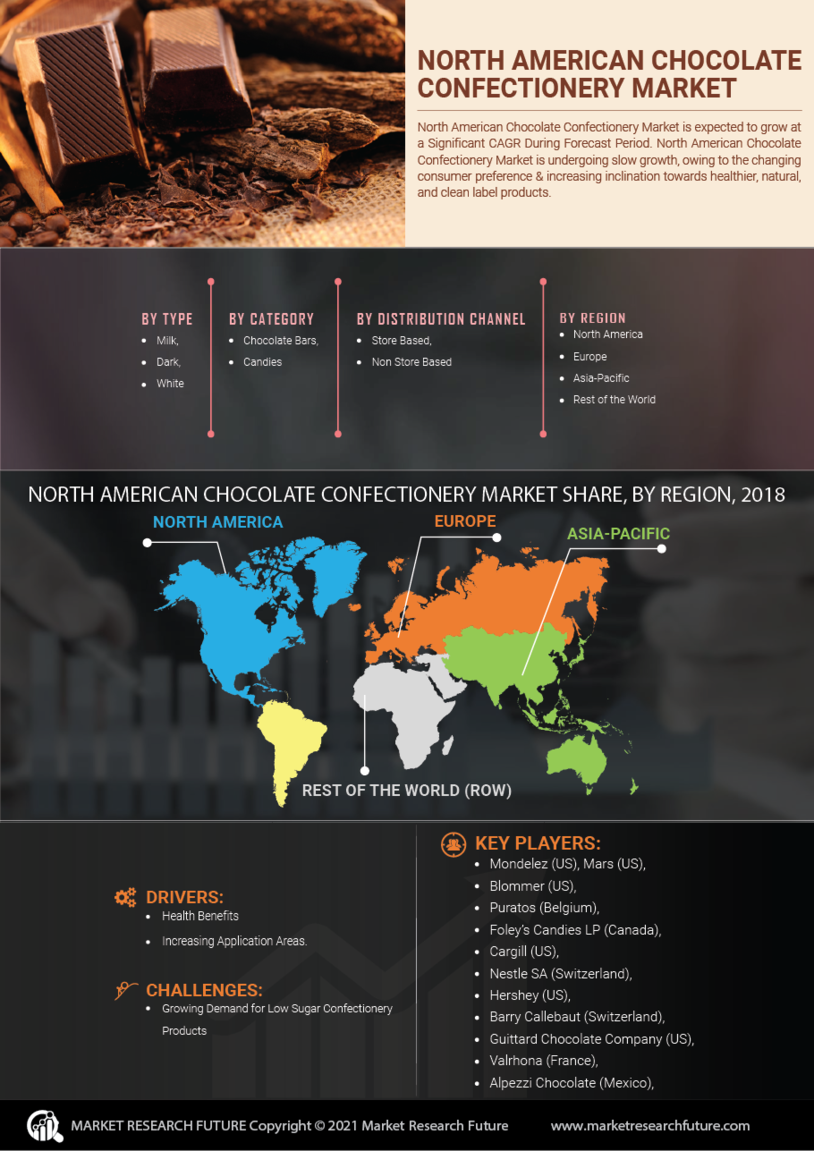
Request Free Sample ×

Kindly complete the form below to receive a free sample of this Report

* Please use a valid business email

Leading companies partner with us for data-driven Insights

clients tt-cursor
Hero Background

North American Chocolate Confectionery Market

ID: MRFR/FnB/1000-HCR
128 Pages
Snehal Singh
Last Updated: April 06, 2026
North American Chocolate Confectionery Market Size, Share, Industry Trend & Analysis Research Report Information by type (milk, dark, white) by category (chocolate bars, candies.) by distribution channel (store based, non store based), by country (US, Canada, Mexico) - Forecast to 2035
Download PDF ×

We do not share your information with anyone. However, we may send you emails based on your report interest from time to time. You may contact us at any time to opt-out.

  1. 1 SECTION I: EXECUTIVE SUMMARY AND KEY HIGHLIGHTS
    1. 1.1 EXECUTIVE SUMMARY
      1. 1.1.1 Market Overview
      2. 1.1.2 Key Findings
      3. 1.1.3 Market Segmentation
      4. 1.1.4 Competitive Landscape
      5. 1.1.5 Challenges and Opportunities
      6. 1.1.6 Future Outlook
  2. 2 SECTION II: SCOPING, METHODOLOGY AND MARKET STRUCTURE
    1. 2.1 MARKET INTRODUCTION
      1. 2.1.1 Definition
      2. 2.1.2 Scope of the study
        1. 2.1.2.1 Research Objective
        2. 2.1.2.2 Assumption
        3. 2.1.2.3 Limitations
    2. 2.2 RESEARCH METHODOLOGY
      1. 2.2.1 Overview
      2. 2.2.2 Data Mining
      3. 2.2.3 Secondary Research
      4. 2.2.4 Primary Research
        1. 2.2.4.1 Primary Interviews and Information Gathering Process
        2. 2.2.4.2 Breakdown of Primary Respondents
      5. 2.2.5 Forecasting Model
      6. 2.2.6 Market Size Estimation
        1. 2.2.6.1 Bottom-Up Approach
        2. 2.2.6.2 Top-Down Approach
      7. 2.2.7 Data Triangulation
      8. 2.2.8 Validation
  3. 3 SECTION III: QUALITATIVE ANALYSIS
    1. 3.1 MARKET DYNAMICS
      1. 3.1.1 Overview
      2. 3.1.2 Drivers
      3. 3.1.3 Restraints
      4. 3.1.4 Opportunities
    2. 3.2 MARKET FACTOR ANALYSIS
      1. 3.2.1 Value chain Analysis
      2. 3.2.2 Porter's Five Forces Analysis
        1. 3.2.2.1 Bargaining Power of Suppliers
        2. 3.2.2.2 Bargaining Power of Buyers
        3. 3.2.2.3 Threat of New Entrants
        4. 3.2.2.4 Threat of Substitutes
        5. 3.2.2.5 Intensity of Rivalry
      3. 3.2.3 COVID-19 Impact Analysis
        1. 3.2.3.1 Market Impact Analysis
        2. 3.2.3.2 Regional Impact
        3. 3.2.3.3 Opportunity and Threat Analysis
  4. 4 SECTION IV: QUANTITATIVE ANALYSIS
    1. 4.1 Food, Beverages & Nutrition, BY Product Type (USD Billion)
      1. 4.1.1 Dark Chocolate
      2. 4.1.2 Milk Chocolate
      3. 4.1.3 White Chocolate
      4. 4.1.4 Chocolate Bars
      5. 4.1.5 Chocolate Truffles
    2. 4.2 Food, Beverages & Nutrition, BY Distribution Channel (USD Billion)
      1. 4.2.1 Supermarkets
      2. 4.2.2 Convenience Stores
      3. 4.2.3 Online Retail
      4. 4.2.4 Specialty Stores
      5. 4.2.5 Wholesale
    3. 4.3 Food, Beverages & Nutrition, BY Consumer Demographics (USD Billion)
      1. 4.3.1 Age Group
      2. 4.3.2 Income Level
      3. 4.3.3 Gender
      4. 4.3.4 Lifestyle
      5. 4.3.5 Health Consciousness
    4. 4.4 Food, Beverages & Nutrition, BY Packaging Type (USD Billion)
      1. 4.4.1 Bags
      2. 4.4.2 Boxes
      3. 4.4.3 Pouches
      4. 4.4.4 Bulk Packaging
      5. 4.4.5 Single Serve
    5. 4.5 Food, Beverages & Nutrition, BY Formulation (USD Billion)
      1. 4.5.1 Organic
      2. 4.5.2 Sugar-Free
      3. 4.5.3 Gluten-Free
      4. 4.5.4 Vegan
      5. 4.5.5 Functional
  5. 5 SECTION V: COMPETITIVE ANALYSIS
    1. 5.1 Competitive Landscape
      1. 5.1.1 Overview
      2. 5.1.2 Competitive Analysis
      3. 5.1.3 Market share Analysis
      4. 5.1.4 Major Growth Strategy in the Food, Beverages & Nutrition
      5. 5.1.5 Competitive Benchmarking
      6. 5.1.6 Leading Players in Terms of Number of Developments in the Food, Beverages & Nutrition
      7. 5.1.7 Key developments and growth strategies
        1. 5.1.7.1 New Product Launch/Service Deployment
        2. 5.1.7.2 Merger & Acquisitions
        3. 5.1.7.3 Joint Ventures
      8. 5.1.8 Major Players Financial Matrix
        1. 5.1.8.1 Sales and Operating Income
        2. 5.1.8.2 Major Players R&D Expenditure. 2023
    2. 5.2 Company Profiles
      1. 5.2.1 Mars, Inc. (US)
        1. 5.2.1.1 Financial Overview
        2. 5.2.1.2 Products Offered
        3. 5.2.1.3 Key Developments
        4. 5.2.1.4 SWOT Analysis
        5. 5.2.1.5 Key Strategies
      2. 5.2.2 Mondelez International, Inc. (US)
        1. 5.2.2.1 Financial Overview
        2. 5.2.2.2 Products Offered
        3. 5.2.2.3 Key Developments
        4. 5.2.2.4 SWOT Analysis
        5. 5.2.2.5 Key Strategies
      3. 5.2.3 Hershey Company (US)
        1. 5.2.3.1 Financial Overview
        2. 5.2.3.2 Products Offered
        3. 5.2.3.3 Key Developments
        4. 5.2.3.4 SWOT Analysis
        5. 5.2.3.5 Key Strategies
      4. 5.2.4 Nestle USA, Inc. (US)
        1. 5.2.4.1 Financial Overview
        2. 5.2.4.2 Products Offered
        3. 5.2.4.3 Key Developments
        4. 5.2.4.4 SWOT Analysis
        5. 5.2.4.5 Key Strategies
      5. 5.2.5 Ferrero USA, Inc. (US)
        1. 5.2.5.1 Financial Overview
        2. 5.2.5.2 Products Offered
        3. 5.2.5.3 Key Developments
        4. 5.2.5.4 SWOT Analysis
        5. 5.2.5.5 Key Strategies
      6. 5.2.6 General Mills, Inc. (US)
        1. 5.2.6.1 Financial Overview
        2. 5.2.6.2 Products Offered
        3. 5.2.6.3 Key Developments
        4. 5.2.6.4 SWOT Analysis
        5. 5.2.6.5 Key Strategies
      7. 5.2.7 Cavendish & Harvey GmbH (DE)
        1. 5.2.7.1 Financial Overview
        2. 5.2.7.2 Products Offered
        3. 5.2.7.3 Key Developments
        4. 5.2.7.4 SWOT Analysis
        5. 5.2.7.5 Key Strategies
      8. 5.2.8 Ghirardelli Chocolate Company (US)
        1. 5.2.8.1 Financial Overview
        2. 5.2.8.2 Products Offered
        3. 5.2.8.3 Key Developments
        4. 5.2.8.4 SWOT Analysis
        5. 5.2.8.5 Key Strategies
    3. 5.3 Appendix
      1. 5.3.1 References
      2. 5.3.2 Related Reports
  6. 6 LIST OF FIGURES
    1. 6.1 MARKET SYNOPSIS
    2. 6.2 NORTH AMERICA MARKET ANALYSIS BY PRODUCT TYPE
    3. 6.3 NORTH AMERICA MARKET ANALYSIS BY DISTRIBUTION CHANNEL
    4. 6.4 NORTH AMERICA MARKET ANALYSIS BY CONSUMER DEMOGRAPHICS
    5. 6.5 NORTH AMERICA MARKET ANALYSIS BY PACKAGING TYPE
    6. 6.6 NORTH AMERICA MARKET ANALYSIS BY FORMULATION
    7. 6.7 KEY BUYING CRITERIA OF FOOD, BEVERAGES & NUTRITION
    8. 6.8 RESEARCH PROCESS OF MRFR
    9. 6.9 DRO ANALYSIS OF FOOD, BEVERAGES & NUTRITION
    10. 6.10 DRIVERS IMPACT ANALYSIS: FOOD, BEVERAGES & NUTRITION
    11. 6.11 RESTRAINTS IMPACT ANALYSIS: FOOD, BEVERAGES & NUTRITION
    12. 6.12 SUPPLY / VALUE CHAIN: FOOD, BEVERAGES & NUTRITION
    13. 6.13 FOOD, BEVERAGES & NUTRITION, BY PRODUCT TYPE, 2024 (% SHARE)
    14. 6.14 FOOD, BEVERAGES & NUTRITION, BY PRODUCT TYPE, 2024 TO 2035 (USD Billion)
    15. 6.15 FOOD, BEVERAGES & NUTRITION, BY DISTRIBUTION CHANNEL, 2024 (% SHARE)
    16. 6.16 FOOD, BEVERAGES & NUTRITION, BY DISTRIBUTION CHANNEL, 2024 TO 2035 (USD Billion)
    17. 6.17 FOOD, BEVERAGES & NUTRITION, BY CONSUMER DEMOGRAPHICS, 2024 (% SHARE)
    18. 6.18 FOOD, BEVERAGES & NUTRITION, BY CONSUMER DEMOGRAPHICS, 2024 TO 2035 (USD Billion)
    19. 6.19 FOOD, BEVERAGES & NUTRITION, BY PACKAGING TYPE, 2024 (% SHARE)
    20. 6.20 FOOD, BEVERAGES & NUTRITION, BY PACKAGING TYPE, 2024 TO 2035 (USD Billion)
    21. 6.21 FOOD, BEVERAGES & NUTRITION, BY FORMULATION, 2024 (% SHARE)
    22. 6.22 FOOD, BEVERAGES & NUTRITION, BY FORMULATION, 2024 TO 2035 (USD Billion)
    23. 6.23 BENCHMARKING OF MAJOR COMPETITORS
  7. 7 LIST OF TABLES
    1. 7.1 LIST OF ASSUMPTIONS
  8. 7.1.1
    1. 7.2 North America MARKET SIZE ESTIMATES; FORECAST
      1. 7.2.1 BY PRODUCT TYPE, 2026-2035 (USD Billion)
      2. 7.2.2 BY DISTRIBUTION CHANNEL, 2026-2035 (USD Billion)
      3. 7.2.3 BY CONSUMER DEMOGRAPHICS, 2026-2035 (USD Billion)
      4. 7.2.4 BY PACKAGING TYPE, 2026-2035 (USD Billion)
      5. 7.2.5 BY FORMULATION, 2026-2035 (USD Billion)
    2. 7.3 PRODUCT LAUNCH/PRODUCT DEVELOPMENT/APPROVAL
  9. 7.3.1
    1. 7.4 ACQUISITION/PARTNERSHIP
  10. 7.4.1

North America Food, Beverages & Nutrition Market Segmentation

Food, Beverages & Nutrition By Product Type (USD Billion, 2026-2035)

  • Dark Chocolate
  • Milk Chocolate
  • White Chocolate
  • Chocolate Bars
  • Chocolate Truffles

Food, Beverages & Nutrition By Distribution Channel (USD Billion, 2026-2035)

  • Supermarkets
  • Convenience Stores
  • Online Retail
  • Specialty Stores
  • Wholesale

Food, Beverages & Nutrition By Consumer Demographics (USD Billion, 2026-2035)

  • Age Group
  • Income Level
  • Gender
  • Lifestyle
  • Health Consciousness

Food, Beverages & Nutrition By Packaging Type (USD Billion, 2026-2035)

  • Bags
  • Boxes
  • Pouches
  • Bulk Packaging
  • Single Serve

Food, Beverages & Nutrition By Formulation (USD Billion, 2026-2035)

  • Organic
  • Sugar-Free
  • Gluten-Free
  • Vegan
  • Functional