Ophthalmic Drugs Market (2026 - 2035)

Ophthalmic Drugs Market Research Report: Size, Share, Trend Analysis By Drug Class (Anti-Inflammatory Drugs, Anti-Infective Drugs, Glaucoma Drugs, Ophthalmic Anesthetics, Artificial Tears), By Formulation Type (Liquid, Ointment, Eye Drops, Gel, Sustained Release), By Therapeutic Application (Allergic Conjunctivitis, Cataracts, Glaucoma, Dry Eye Syndrome, Intraocular Infections), By Route of Administration (Topical, Intraocular, Systemic) and By Regional (North America, Europe, South America, Asia Pacific, Middle East and Africa) - Growth Outlook & Industry Forecast Till 2035
ID: MRFR/Pharma/4298-HCR
95 Pages
Vikita Thakur, Rahul Gotadki
Last Updated: July 06, 2026
Ophthalmic Drugs Market
Market Size
Forecast Period2026-2035
CAGR (2026-2035)8.9%
2025 Market SizeUSD 34.90 Billion
2035 Market SizeUSD 81.84 Billion
Key Players
Regeneron Pharmaceuticals
Roche / Genentech
Novartis AG
AbbVie
Bayer AG
Alcon Inc.
Opportunities
  • Sustained-Release Drug-Delivery Platforms
  • Emerging-Market Screening Infrastructure
  • Digital Therapeutics and Companion Diagnostics

Ophthalmic Drugs Market Summary

The Ophthalmic Drugs Market size was valued at USD 34.90 Billion in 2025, and the market is projected to grow from USD 38.01 Billion in 2026 to USD 81.84 Billion by 2035, registering a CAGR of 8.9% during the forecast period 2026–2035. Population aging across developed economies and a global diabetes prevalence surpassing 537 million adults are anchoring demand for chronic ocular therapies, while the US Inflation Reduction Act's drug-pricing provisions are reshaping manufacturer strategies around premium sustained-release formulations and extended-interval biologics [1].

Therapeutic innovation is revolutionizing the landscape of the Ophthalmic Drugs Market. Preservative-free unit dose systems are replacing legacy multi-dose preserved eye drops, gene treatments are being developed for inherited retinal dystrophies, and sustained release implants are moving from monthly to bi-annual injections. The FDA’s first approval of an optogenetic therapy occurred in 2024, and global ophthalmic R&D expenditure hit USD 9.2 billion, demonstrating confidence in the next-generation pipeline candidates, including complement inhibitors and RNA interference platforms [2][3].

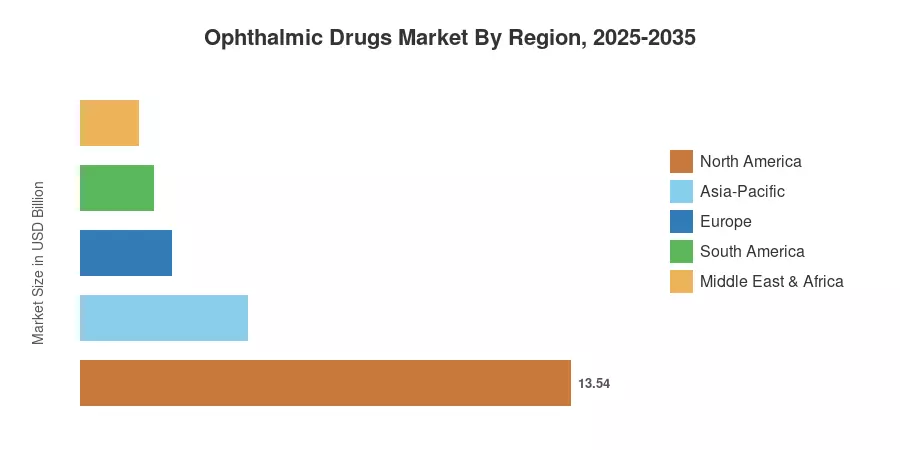
Around 38.8% of the Ophthalmic Drugs Market was contributed by North America in 2025. The region is driven by wide insurance coverage and a high density of retinal specialty clinics. Asia-Pacific is the fastest-growing area, expected to increase at a CAGR of 13.2% through 2035, with national screening initiatives in China and India uncovering vast pools of undiagnosed patients. Europe accounted for the second-highest share, aided by biosimilar entrants enabled by the EMA that are increasing access to high-cost biologics. When treatment is initiated in all locations will depend on how quickly AI-guided diagnostics are adopted in the actual world in the coming decade.


Key Report Takeaways

• By Drug Class

  • Anti-glaucoma agents accounted for 25.3% of the Ophthalmic Drugs Market share in 2025, reflecting the chronic nature of intraocular-pressure management worldwide.
  • Retinal disorder therapies are forecast to register a 17.6% CAGR through 2035, fueled by expanded indications for complement-pathway inhibitors.

• By Indication

  • Retinal disorders captured 32.7% of the Ophthalmic Drugs Market size in 2025, as wet age-related macular degeneration and diabetic retinopathy dominate treatment spending.


• By Dosage Form

  • Eye drops represented 58.7% of the Ophthalmic Drugs Market in 2025, although implants and inserts are set to grow at a 12.8% CAGR through 2035.

• By Region

  • North America led the Ophthalmic Drugs Market with a 38.8% share in 2025, underpinned by robust Part B Medicare reimbursement for intravitreal injections.
  • Asia-Pacific is advancing at a 13.2% CAGR, with China's National Reimbursement Drug List expansions accelerating biologics uptake.


Market Size and Forecast (2021–2035)

Market Research Future's estimates integrate primary interviews with retinal specialists and pharmacy-benefit managers, triangulated against company filings, WHO epidemiological databases, and national prescription-volume registries. Historical figures (2021–2024) reflect audited sales data; forecast figures (2026–2035) are modeled on disease-incidence trajectories, pipeline launch timelines, and regional reimbursement dynamics.
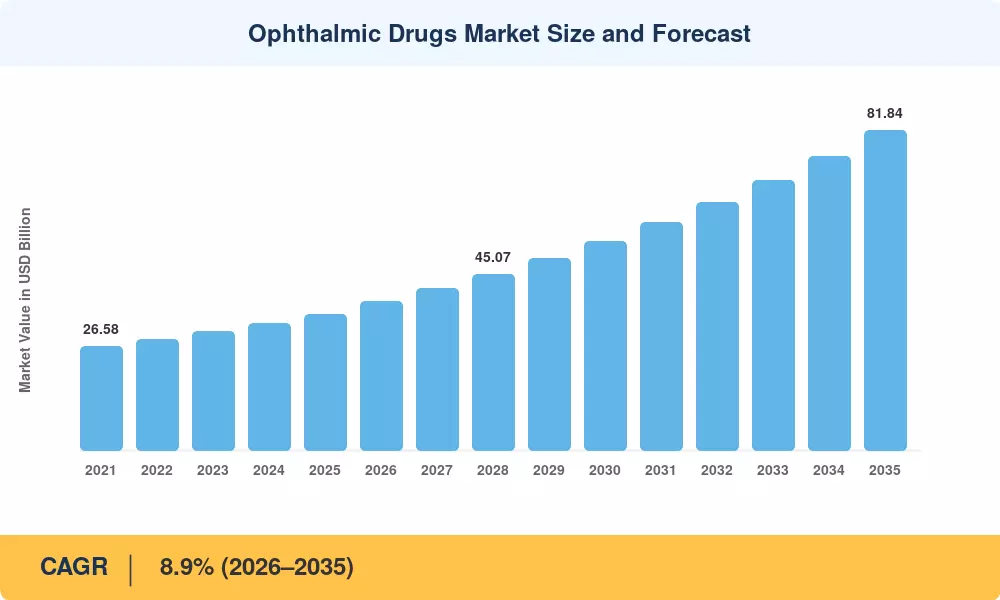
Ophthalmic Drugs Market Size and Forecast
Our Impact
Enabled $4.3B Revenue Impact for Fortune 500 and Leading Multinationals
Partnering with 2000+ Global Organizations Each Year
30K+ Citations by Top-Tier Firms in the Industry

Driver Impact Analysis

Driver ~% Impact on CAGR Geographic Relevance Impact Timeline
Rising global diabetes and hypertension prevalence +1.8% Global Long-term (≥4 yr)
Aging demographics in developed economies +1.5% North America, Europe, Japan Long-term (≥4 yr)
Gene and cell therapy pipeline maturation +1.3% North America, Europe Medium-term (2–4 yr)
Preservative-free reformulation mandates +0.9% Europe, Asia-Pacific Short-term (≤2 yr)
AI-assisted drug discovery and diagnostics +0.8% Global Medium-term (2–4 yr)
Telehealth prescriptions expanding distribution +0.6% North America, Asia-Pacific Short-term (≤2 yr)
National screening program rollouts +0.7% Asia-Pacific, Middle East Medium-term (2–4 yr)


Rising Diabetes and Hypertension Prevalence

The International Diabetes Federation reports that 589 million adults were living with diabetes in 2024, a figure projected to reach 783 million by 2045. With nearly one-third of these patients developing diabetic retinopathy, the global burden of vision-threatening conditions is mounting. As population aging and sedentary lifestyles persist, the demand for intravitreal therapies and chronic retinal disease management continues to accelerate globally.


Gene and Cell Therapy Pipeline Maturation

The ophthalmic gene therapy sector is evolving rapidly, with over 3,500 clinical trials globally as of early 2025. These therapies target debilitating conditions like Leber congenital amaurosis and Stargardt disease, which affect millions. With regulatory frameworks and expedited pathways supporting innovation, the shift toward one-shot, curative interventions is set to transform the standard of care for inherited retinal dystrophies.


AI-Assisted Drug Discovery and Diagnostics

Artificial intelligence is fundamentally reshaping eye care, with tools now capable of screening for over 50 conditions via OCT scans. By integrating these systems into primary care, providers detect diseases earlier, increasing the treatable patient population. Simultaneously, AI-driven molecular screening is accelerating preclinical timelines for novel glaucoma agents and neuroprotective compounds, streamlining the path to human clinical applications.


Restraints Impact Analysis

Restraint ~% Impact on CAGR Geographic Relevance Impact Timeline
Patent cliff for blockbuster biologics −1.2% Global Short-term (≤2 yr)
Stringent sterility and preservative regulations −0.7% Europe, Japan Medium-term (2–4 yr)
High cost of intravitreal therapies −0.9% Emerging markets Long-term (≥4 yr)
Reimbursement compression and IRA price negotiation −0.6% United States Medium-term (2–4 yr)
Cold-chain logistics for biologics −0.4% Asia-Pacific, Africa Long-term (≥4 yr)


Patent Cliff for Blockbuster Biologics

Regeneron’s Eylea, which reported 2023 global sales of approximately $9.4 billion, is facing increasing biosimilar competition following the mid-2026 European launches of therapies like OPUVIZ and AHZANTIVE. While US formulation patents extend toward mid-2027, the entry of lower-cost biosimilars is already initiating significant pricing pressure. This trend mirrors the broader biologics sector, where expiring exclusivity facilitates more affordable access.


High Cost of Intravitreal Therapies in Emerging Markets

The high cost of anti-VEGF therapies creates significant access barriers in low-income economies. In India, for example, the National Programme for Control of Blindness and Visual Impairment works to address diabetic retinopathy, which affects approximately 32% of diabetic patients. Without widespread adoption of biosimilars or expanded public procurement to reduce per-injection costs, large populations remain at high risk of vision loss.


Ophthalmic Drugs Market Opportunities

Sustained-Release Drug-Delivery Platforms

Innovations like port-delivery systems and bioerodible implants maintain therapeutic concentrations for six months or longer, significantly lowering patient treatment burden. Clinical evidence confirms these platforms achieve efficacy comparable to standard monthly anti-VEGF injections while reducing clinic visits. This shift toward implant-based delivery creates a distinct premium market segment, offering manufacturers opportunities to improve patient adherence and long-term visual outcomes.


Emerging-Market Screening Infrastructure

India's Ayushman Bharat digital health platform screened over 48 million individuals for eye disease in 2024, while China's county-level hospital upgrade program is embedding AI-enabled fundus cameras across 1,200 rural hospitals [15]. These programs convert undiagnosed patients into treatment-eligible populations at unprecedented scale, directly expanding the addressable Ophthalmic Drugs Market in Asia-Pacific by an estimated USD 4–6 billion over the forecast period.

Digital Therapeutics and Companion Diagnostics

Connected contact-lens sensors and smartphone-based tonometers enable continuous intraocular-pressure monitoring, supporting data-driven titration of glaucoma medications. Paired with companion-diagnostic AI, these platforms create subscription-style revenue models where device data triggers automated refill prescriptions, embedding recurring revenue into the Ophthalmic Drugs Market value chain.

Biosimilar Portfolio Expansion

With six major ophthalmic biologics losing patent exclusivity between 2025 and 2030, biosimilar developers face a USD 18 billion addressable revenue pool [10]. Companies that invest in ophthalmic-specific fill-finish capacity and gain interchangeability designations will capture disproportionate share, while simultaneously expanding patient access and overall Ophthalmic Drugs Market volumes.

Preservative-Free Reformulation Wave

In alignment with the World Health Organization’s SPECS 2030 and universal health coverage goals, countries are integrating eye care into national health systems. By embedding screening and therapeutic services into primary care, governments aim to address the estimated 1 billion people currently living with preventable vision impairment. This systemic integration ensures sustainable, long-term demand for ophthalmic pharmaceutical products.


Ophthalmic Drugs Market Future Outlook

AI-Integrated Diagnostics Reshaping Treatment Initiation

Artificial intelligence is increasingly integrated into primary care to improve the early detection of eye conditions. By streamlining screening workflows, these tools help reduce the time between symptom onset and professional diagnosis. As national health systems modernize, the deployment of AI-enabled fundus cameras supports universal health coverage goals, ensuring that patients receive timely interventions to prevent irreversible vision loss.


Precision Ophthalmology and Biomarker-Guided Therapy

Pharmacogenomic testing for complement-factor polymorphisms is already guiding treatment selection in geographic atrophy, and by 2028, companion-diagnostic requirements may become standard for new ophthalmic biologic approvals [16]. This precision-medicine shift will segment the Ophthalmic Drugs Market into biomarker-defined niches, rewarding manufacturers with validated diagnostics and penalizing undifferentiated me-too therapies. Retinal-imaging biomarkers from adaptive-optics OCT are expected to enable treat-and-extend protocols with 40% fewer injections.

Sustainability and Green Chemistry in Ophthalmic Manufacturing

The pharmaceutical industry is under increasing pressure to adopt green chemistry, particularly in the European Union. As part of the revised EU pharmaceutical legislation, companies are being encouraged to modernize manufacturing processes to reduce environmental impacts. Firms investing in continuous-flow production and solvent recovery are effectively aligning their operations with evolving regulatory standards while enhancing long-term supply chain efficiency.


Platform Economics and Subscription Models

Health systems are exploring innovative distribution models, including digital pharmacy logistics, to improve treatment adherence for chronic conditions like glaucoma. While the industry is shifting toward more integrated, patient-centered approaches, the focus remains on ensuring that medication supply chains are reliable and accessible. These advancements aim to bridge the gap between diagnostic screening and consistent, long-term pharmaceutical care.


Ophthalmic Drugs Market Segmentation

By Drug Class

Segment Key Metric Primary Demand Driver
Anti-Glaucoma Drugs 25.3% share (2025) Chronic IOP management in aging populations
Retinal Disorder Therapies 17.6% CAGR (2026–2035) Anti-VEGF and complement-inhibitor launches
Dry Eye Drugs USD 5.11 Billion (2025) Screen-time and environmental-exposure trends
Anti-Infective / Anti-Inflammatory Drugs 8.4% CAGR (2026–2035) Post-surgical prophylaxis protocols
Others USD 2.79 Billion (2025) Mydriatics, diagnostics, neuroprotectives


Anti-glaucoma drugs remain the largest drug class in the Ophthalmic Drugs Market, supported by the irreversible nature of glaucomatous vision loss and lifelong treatment regimens. Prostaglandin analogs continue to dominate first-line prescriptions, although Rho-kinase inhibitors and nitric-oxide-donating agents are gaining share in patients with inadequate IOP reduction on monotherapy. The class benefits from strong generic competition that sustains volume growth even as per-unit prices decline.

Retinal disorder therapies represent the fastest-growing drug class, driven by expanded indications for existing anti-VEGF agents and the arrival of complement-pathway inhibitors for geographic atrophy. The shift from monthly to extended-interval and treat-and-extend dosing regimens is simultaneously improving patient adherence and per-patient lifetime revenues, making this segment the primary growth engine of the Ophthalmic Drugs Market through 2035.

By Indication

Segment Key Metric Primary Demand Driver
Retinal Disorders 32.7% share (2025) Diabetic retinopathy and AMD prevalence
Glaucoma USD 8.83 Billion (2025) Open-angle glaucoma chronic treatment
Dry Eye Syndrome 9.6% CAGR (2026–2035) Digital-device-related ocular surface disease
Ocular Infections & Inflammation 13.9% CAGR (2026–2035) Post-operative care volume growth
Others USD 1.74 Billion (2025) Allergic conjunctivitis, uveitis

Retinal disorders lead the ophthalmology market with a 32.7% share in 2025, fueled by rising diabetic retinopathy and AMD cases. Glaucoma follows closely at USD 8.83 billion, driven by chronic open-angle glaucoma management needs. Meanwhile, dry eye syndrome (9.6% CAGR) and ocular infections/inflammation (13.9% CAGR) are set to grow fastest through 2035, reflecting the impact of digital eye strain and rising post-operative care volumes.

By Dosage Form

Segment Key Metric Primary Demand Driver
Eye Drops 58.7% share (2025) Ease of self-administration
Injectables 9.8% CAGR (2026–2035) Intravitreal anti-VEGF delivery
Ointments & Gels USD 2.44 Billion (2025) Overnight dry-eye and antibiotic therapy
Implants / Inserts 12.8% CAGR (2026–2035) Sustained-release technology adoption
Others USD 0.87 Billion (2025) Sprays, ocular films

Eye drops dominate the ophthalmology dosage form market with a 58.7% share in 2025, owing to their ease of self-administration for patients. Implants and inserts are poised for the fastest growth at 12.8% CAGR through 2035, as sustained-release technology gains traction, while injectables (9.8% CAGR) benefit from rising demand for intravitreal anti-VEGF therapies. Ointments and gels, valued at USD 2.44 billion in 2025, continue to serve overnight dry-eye and antibiotic treatment needs.

By Product Type

Segment Key Metric Primary Demand Driver
Prescription Drugs 66.5% share (2025) Specialist-driven chronic-disease management
OTC Drugs 10.5% CAGR (2026–2035) Consumer self-care for dry eye and allergy

Prescription drugs command a dominant 66.5% share of the ophthalmology product type market in 2025, driven by specialist-led management of chronic eye conditions. OTC drugs, meanwhile, are growing faster at a 10.5% CAGR through 2035, as consumers increasingly turn to self-care solutions for dry eye and allergic conditions. This divergence highlights a market where clinical necessity anchors current revenue, while consumer-driven self-treatment fuels future expansion.

By Distribution Channel

Segment Key Metric Primary Demand Driver
Hospital Pharmacies 43.4% share (2025) In-clinic intravitreal injection dispensing
Retail Pharmacies USD 11.18 Billion (2025) Chronic glaucoma and dry-eye refills
Online Pharmacies 12.8% CAGR (2026–2035) Telehealth prescriptions and auto-refill platforms

Hospital pharmacies lead ophthalmology distribution with a 43.4% share in 2025, largely due to the need for in-clinic dispensing of intravitreal injections. Retail pharmacies remain a major channel at USD 11.18 billion, supported by steady refill demand for chronic glaucoma and dry-eye medications. Online pharmacies are the fastest-growing channel, projected at a 12.8% CAGR through 2035, as telehealth prescriptions and auto-refill platforms reshape how patients access ongoing eye care.


Regional Market Share Analysis

Region Key Metric Primary Investment Themes
North America 38.8% share (2025) Biologics reimbursement, retinal specialty networks
Europe 7.2% CAGR (2026–2035) Biosimilar penetration, preservative-free mandates
Asia-Pacific 13.2% CAGR (2026–2035) National screening rollouts, local API manufacturing
South America USD 2.02 Billion (2025) Generic expansion, public ophthalmology programs
Middle East & Africa USD 1.61 Billion (2025) Medical tourism, government eye-health initiatives
Total USD 34.90 Billion (2025)

The Ophthalmic Drugs Market exhibits significant regional variation driven by insurance coverage maturity, disease burden, regulatory environments, and specialist-workforce density. North America and Europe collectively represent over two-thirds of global revenues, but Asia-Pacific's growth trajectory is reshaping the competitive landscape.


North America

Country Key Metric Key Driver
United States 82.4% of regional share Medicare Part B biologics reimbursement [19]
Canada 7.8% CAGR (2026–2035) Provincial drug-plan expansions
Mexico USD 0.94 Billion (2025) Growing private-insurance coverage


The United States dominates the North American Ophthalmic Drugs Market because of its unmatched network of over 18,000 board-certified ophthalmologists and a payer system that reimburses intravitreal injections at average selling price plus a percentage markup. Medicare Part B alone processed more than 6.3 million anti-VEGF injection claims in 2024, and commercial payers are increasingly adopting step-therapy protocols that still favor branded biologics as first-line treatments [19]. Canada's federal government pledged CAD 1.5 billion over five years for a national pharmacare program that will list ophthalmic biologics starting in 2027, while Mexico's INSABI successor agency IMSS-Bienestar is centralizing ophthalmic procurement across 23 states [21].

Europe

Country Key Metric Key Driver
Germany 23.6% of regional share SHI formulary leadership for biologics
United Kingdom 8.1% CAGR (2026–2035) NICE fast-track biosimilar adoption [6]
France USD 1.62 Billion (2025) Centralized hospital purchasing
Italy 7.4% CAGR (2026–2035) Regional tender consolidation
Spain USD 0.89 Billion (2025) Community pharmacy dispensing reforms
Nordic Countries 7.0% CAGR (2026–2035) Digital health integration
Russia USD 0.74 Billion (2025) Domestic API substitution programs
Rest of Europe 6.8% CAGR (2026–2035) EU cross-border prescription frameworks


Europe's Ophthalmic Drugs Market is shaped by biosimilar-friendly procurement policies that have already compressed anti-VEGF pricing by 25–40% in Germany, the UK, and the Nordics. The European Medicines Agency's centralized biologics-approval pathway and interchangeability guidelines introduced in 2024 are expected to accelerate switching rates from originator to biosimilar products, creating volume growth that partially offsets per-unit revenue erosion [6].

Asia-Pacific

Country Key Metric Key Driver
China 36.8% of regional share NRDL biologics inclusion [15]
India 14.5% CAGR (2026–2035) Ayushman Bharat screening expansion
Japan USD 2.18 Billion (2025) Super-aged population, NHI pricing reforms
South Korea 12.8% CAGR (2026–2035) Health Insurance Review Agency coverage
ASEAN USD 0.72 Billion (2025) Medical-tourism ophthalmology hubs
Rest of Asia-Pacific 11.6% CAGR (2026–2035) Government cataract-surgery campaigns


The Asia-Pacific Ophthalmic Drugs Market is accelerating as national health-insurance systems expand their ophthalmic formularies. China added three anti-VEGF products to the NRDL in 2024, reducing patient co-pays by up to 70% and triggering a volume surge in tier-2 and tier-3 city hospitals. India's domestic biosimilar manufacturers, including Biocon and Intas, are producing ranibizumab at roughly 60% below global reference pricing, enabling public eye-health programs to treat an additional 1.2 million patients annually [15].

South America

Country Key Metric Key Driver
Brazil 58.4% of regional share SUS public health system procurement
Argentina 7.9% CAGR (2026–2035) ANMAT regulatory harmonization
Rest of South America USD 0.43 Billion (2025) Pan-American Health Organization initiatives


Brazil's Unified Health System (SUS) is the largest single purchaser of ophthalmic drugs in South America, and its centralized tendering process for anti-VEGF agents expanded eligibility criteria in 2024 to include diabetic macular edema alongside wet AMD. Argentina's alignment with ICH regulatory standards is attracting multinational clinical trial sites, positioning the country as an emerging Ophthalmic Drugs Market hub in the Southern Cone [22].

Middle East & Africa

Country Key Metric Key Driver
Saudi Arabia 31.7% of regional share Vision 2030 healthcare investment
UAE 9.4% CAGR (2026–2035) Medical-tourism ophthalmology centers
South Africa USD 0.23 Billion (2025) National Health Insurance pilot programs
Egypt 10.2% CAGR (2026–2035) Population-scale diabetes burden
Rest of MEA USD 0.41 Billion (2025) NGO-funded cataract and trachoma programs


Saudi Arabia's Vision 2030 has earmarked over USD 3.2 billion for ophthalmic infrastructure, including 14 new retinal treatment centers and a localized biologic fill-finish facility in NEOM's health district. Egypt's diabetes prevalence, exceeding 20% of adults, is driving rapid demand growth for the Ophthalmic Drugs Market. However, supply-chain limitations and foreign-exchange constraints currently restrict access to premium-priced biologics [23].


Ophthalmic Drugs Market By Region, 2025-2035

Competitive Benchmarking

The Ophthalmic Drugs Market exhibits moderate concentration, with the top five companies controlling an estimated 48–55% of global revenues. The Herfindahl-Hirschman Index sits in the 1,000–1,400 range, indicative of a moderately competitive environment where blockbuster biologics confer significant but not insurmountable scale advantages. Innovation velocity — particularly in sustained-release platforms and gene therapy — is allowing mid-cap biotechs to challenge incumbents in high-value niches.

Company Est. Revenue Share Range Key Offerings Strategic Positioning
Regeneron Pharmaceuticals ~12–15% Eylea, Eylea HD (aflibercept) Retinal biologics market leader; extended-dosing innovation
Roche / Genentech ~10–13% Lucentis, Vabysmo, Susvimo Bispecific antibody and port-delivery pioneer
Novartis AG ~8–11% Beovu, Xiidra, biosimilar portfolio Broad retinal and dry-eye coverage
AbbVie (Allergan) ~7–10% Restasis, Vuity, glaucoma pipeline Dry-eye and presbyopia franchise depth
Bayer AG ~6–9% Eylea co-commercialization, retinal pipeline Global distribution and co-development partnerships
Alcon Inc. ~5–7% Pataday, Systane, surgical adjuncts OTC and surgical-adjacency breadth
Johnson & Johnson Vision ~4–6% Acuvue therapeutic lenses, pipeline Contact-lens-based drug delivery innovation
Bausch + Lomb ~3–5% Lumify, preservative-free portfolio Consumer eye health and Rx crossover
Santen Pharmaceutical ~2–4% Tapros, Alesion, Asia-focused portfolio Asia-Pacific specialty ophthalmology leader
Sun Pharmaceutical Industries ~2–3% Xelpros, generic ophthalmic portfolio Emerging-market and generic-value positioning


Recent News & Developments

  • Regeneron Pharmaceuticals (September 2024): Received FDA approval for Eylea HD (8 mg aflibercept), enabling 12- to 16-week dosing intervals for wet AMD and diabetic macular edema, strengthening its Ophthalmic Drugs Market leadership [7].
  • Roche / Genentech (June 2024): Reported positive Phase IIIb data for Susvimo port delivery system in diabetic retinopathy, expanding the device-drug platform beyond its initial wet AMD indication [8].
  • Apellis Pharmaceuticals (March 2024): Secured EMA approval for Syfovre (pegcetacoplan) in geographic atrophy, marking the first complement-inhibitor available in Europe for advanced dry AMD [16].
  • AbbVie (January 2024): Completed acquisition of ImmunoGen's ocular-oncology pipeline assets, adding antibody-drug conjugate candidates targeting uveal melanoma [24].
  • FDA (November 2023): Issued updated guidance on preservative-free multi-dose ophthalmic containers, setting new sterility testing standards that will affect reformulations across the Ophthalmic Drugs Market [13].
  • Biocon Biologics (August 2023): Launched biosimilar ranibizumab in India at 65% below originator pricing, expanding affordable access to anti-VEGF therapy across South and Southeast Asia [15].
  • Santen Pharmaceutical (May 2023): Announced strategic partnership with a Chinese biotech to co-develop a gene therapy for X-linked retinitis pigmentosa, targeting Phase II initiation in 2025 [25].


Ophthalmic Drugs Market Report Scope

Parameter Detail
Market Scope Global Ophthalmic Drugs Market across drug class, indication, dosage form, product type, distribution channel, and geography
Study Period 2021–2035
CAGR (Forecast Period) 8.9% (2026–2035)
Base Year Market Size USD 34.90 Billion (2025)
Forecast Endpoint USD 81.84 Billion (2035)
Fastest Growing Segment Retinal Disorder Therapies (by drug class); Asia-Pacific (by region)
Companies Profiled Regeneron, Roche/Genentech, Novartis, AbbVie, Bayer, Alcon, J&J Vision, Bausch + Lomb, Santen, Sun Pharma
Valuation Currency USD Billion


FAQs

How do preservative-free formulations affect manufacturer margins in the Ophthalmic Drugs Market?
Preservative-free unit-dose systems raise per-unit packaging costs by 15–25% but command 10–20% pricing premiums and reduce product-liability exposure tied to ocular-surface toxicity complaints. Manufacturers generally achieve a neutral-to-positive net margin impact within two years of reformulation [13].
What role do pharmacy-benefit managers play in shaping the Ophthalmic Drugs Market?
PBMs negotiate rebates that can reach 40–60% off list price for branded ophthalmic biologics, heavily influencing which therapies appear on preferred formularies. Their step-therapy protocols increasingly favor biosimilars as first-line, redirecting volume and margin dynamics across the supply chain [10].
How are treat-and-extend protocols changing injection economics in the Ophthalmic Drugs Market?
Treat-and-extend regimens reduce annual injection visits from twelve to five or six per patient, lowering clinic-administration costs while maintaining visual outcomes. This approach improves patient retention and extends per-patient treatment duration, supporting lifetime revenue per patient [8].
What intellectual-property strategies differentiate leaders in the Ophthalmic Drugs Market?
Top innovators file device-drug combination patents, formulation patents on sustained-release carriers, and method-of-treatment patents for novel dosing intervals. These layered IP strategies can extend effective market exclusivity three to five years beyond active-ingredient patent expiry [7].
How does telemedicine integration influence prescribing patterns in the Ophthalmic Drugs Market?
Teleophthalmology enables remote monitoring of chronic conditions like glaucoma, allowing specialists to adjust medications without in-person visits. This convenience improves refill adherence by 18–22% and channels prescriptions toward digitally integrated pharmacy partners [14].
What supply-chain vulnerabilities affect the Ophthalmic Drugs Market?
Active pharmaceutical ingredient production for ophthalmic generics concentrates in three Indian states, creating geographic risk. Single-source fill-finish for biologic vials and prefilled syringes adds further fragility, as contamination events can remove months of inventory from global supply [20].
How do value-based contracts work for high-cost therapies in the Ophthalmic Drugs Market?
Payers and manufacturers agree on predefined visual-acuity outcomes, with rebates triggered if a therapy fails to meet benchmarks. These contracts reduce payer risk for gene therapies priced above USD 400,000 and accelerate formulary access for manufacturers [3].    
What is the current size of the ophthalmic drugs market?
The ophthalmic drugs market reached USD 34.90 billion in 2025 and is projected to reach USD 81.84 billion by 2035.
What is the CAGR of the ophthalmic drugs market?
The ophthalmic drugs market is projected to grow at a CAGR of 8.9% during the forecast period 2026–2035.
Which region leads the ophthalmic drugs market?
North America holds the largest share at 38.8%, while Asia-Pacific is the fastest-growing region at 13.2% CAGR.
Author
Author
Author Profile
Vikita Thakur LinkedIn
Senior Research Analyst
She holds an experience of about 5+ years in market research and business consulting projects for sectors such as life sciences, medical devices, and healthcare IT. She possesses a robust background in data analysis, market estimation, competitive intelligence, pipeline analysis market trend identification, and consumer behavior insights. Her expertise lies in technical Sales support, client interaction and project management, designing and implementing market research studies, conducting competitive analysis, and synthesizing complex data into actionable recommendations that drive business growth.
Co-Author
Co-Author Profile
Rahul Gotadki LinkedIn
Research Manager
He holds an experience of about 9+ years in Market Research and Business Consulting, working under the spectrum of Life Sciences and Healthcare domains. Rahul conceptualizes and implements a scalable business strategy and provides strategic leadership to the clients. His expertise lies in market estimation, competitive intelligence, pipeline analysis, customer assessment, etc.

Research Approach


Secondary Research

The secondary research process involved comprehensive analysis of regulatory databases, peer-reviewed ophthalmology journals, clinical trial publications, and authoritative vision health organizations. Key sources included the US Food & Drug Administration (FDA), European Medicines Agency (EMA), National Eye Institute (NEI/NIH), Centers for Disease Control and Prevention (CDC) Vision Health Initiative, World Health Organization (WHO) Blindness and Vision Impairment Database, American Academy of Ophthalmology (AAO), European Society of Ophthalmology (SOE), International Council of Ophthalmology (ICO), American Optometric Association (AOA), National Center for Biotechnology Information (NCBI/PubMed), Cochrane Eyes and Vision Group, European Medicines Agency (EMA) ophthalmology guidelines, Pharma Intelligence (Citeline), IQVIA Institute for Human Data Science, and national blindness prevention programs from key markets. These sources were used to collect prescription statistics, regulatory approval data, clinical safety and efficacy studies, prevalence data for glaucoma/dry eye/macular degeneration, demographic trends, and competitive landscape analysis for anti-inflammatory ophthalmic drugs, anti-infectives, glaucoma therapeutics, and sustained-release formulations.


Primary Research

To gather both qualitative and quantitative insights, supply-side and demand-side stakeholders were interviewed during the primary research phase. CEOs, VPs of R&D, chiefs of global regulatory affairs, and commercial directors from companies that manufacture pharmaceuticals for the eyes and contract research firms were examples of supply-side sources. Board-certified ophthalmologists, retinal and glaucoma specialists, hospital pharmacy directors, and procurement leaders from academic medical centers, specialty ophthalmology clinics, ambulatory surgery centers, and eye hospitals were among the demand-side sources. Primary research established clinical pipeline timings, validated market segmentation across pharmacological classes and therapeutic uses, and collected information on pricing and reimbursement dynamics, intraocular versus topical administration preferences, and formulary adoption patterns.

Primary Respondent Breakdown:

By Designation: C-level Primaries (32%), Director Level (30%), Others (38%)

By Region: North America (32%), Europe (30%), Asia-Pacific (28%), Rest of World (10%)


Market Size Estimation

Global market valuation was derived through revenue mapping and prescription volume analysis. The methodology included:

Identification of 45+ key pharmaceutical manufacturers across North America, Europe, Asia-Pacific, and Latin America specializing in ophthalmic therapeutics

Product mapping across anti-inflammatory drugs (corticosteroids, NSAIDs), anti-infective drugs (antibiotics, antivirals, antifungals), glaucoma drugs (prostaglandin analogs, beta-blockers, alpha-agonists), ophthalmic anesthetics, and artificial tears/sustained-release formulations

Analysis of reported and modeled annual revenues specific to ophthalmic drug portfolios

Coverage of manufacturers representing 70-75% of global market share in 2024

Extrapolation using bottom-up (prescription volume × average selling price by country/therapeutic class) and top-down (manufacturer revenue validation) approaches to derive segment-specific valuations for topical, intraocular, and systemic administration routes

Download Free Sample

Kindly complete the form below to receive a free sample of this Report

Download PDF ×

We do not share your information with anyone. However, we may send you emails based on your report interest from time to time. You may contact us at any time to opt-out.
















