Photoelectric Sensor Market (2026 - 2035)

Photoelectric Sensor Market Size, Share and Research Report By Type (Thrubeam, Retroreflective, Diffuse Reflective, Focused Beam Reflective, Small Spot Definite Reflective, Fixed Distance, and Others), By Beam Source (Laser Beam Source, Infrared (IR) Beam Source, and LED Beam Source), By Industry (Consumer Electronics, Manufacturing, Automotive & Transportation, Food & Beverage, Healthcare, Power & Utilities and others) And By Region (North America, Europe, Asia-Pacific and Rest Of The World)– Industry Size, Share and Trends 2032
ID: MRFR/SEM/6696-HCR
111 Pages
Kiran Jinkalwad, Aarti Dhapte
Last Updated: June 26, 2026
Photoelectric Sensor Market
Market Size
Forecast Period2026-2035
CAGR (2026-2035)7.6%
2025 Market SizeUSD 2.15 Billion
2035 Market SizeUSD 4.47 Billion
Key Players
SICK AG
Keyence Corporation
Omron Corporation
Pepperl+Fuchs
Banner Engineering
Balluff GmbH
Opportunities
  • Predictive-Maintenance-as-a-Service Platforms
  • Pharmaceutical Serialization and Track-and-Trace Mandates
  • Emerging-Market Industrial Build-Out

Photoelectric Sensor Market Summary

The Photoelectric Sensor Market reached USD 2.15 Billion in 2025 and is projected to grow from USD 2.31 Billion in 2026 to USD 4.47 Billion by 2035, registering a CAGR of 7.6% during the forecast period. This expansion tracks closely with global capital spending on smart-factory retrofits, where government tax incentives across major economies are accelerating adoption. The EU's €1.3 billion Digital Europe Programme and India's Production-Linked Incentive scheme for electronics both channel investment directly into automated inspection and packaging lines — exactly the environments where photoelectric sensors are indispensable [1][2].

A technology shift is well underway. Legacy inductive and mechanical limit switches are giving way to solid-state optical sensing platforms that integrate AI-enabled self-calibration, cutting routine maintenance labor by roughly 27%. Declining costs of high-power laser emitters — down an estimated 18% since 2022 — have widened the addressable market beyond premium automotive lines into mid-tier food processing and warehousing operations [3]. The adoption of IEC 61496-5 safety ratings has further raised the compliance bar, converting photoelectric sensors from optional upgrades into regulatory necessities for pharmaceutical and beverage producers.

Asia-Pacific commands the dominant position in the Photoelectric Sensor Market with a 44.1% revenue share in 2025, powered by China's factory automation buildout and Japan's mature robotics ecosystem. The Middle East & Africa region is the fastest-growing region, forecast to expand at a 14.1% CAGR through 2035 as Saudi Arabia and the UAE invest heavily in Vision 2030 industrial diversification. Europe holds the second-largest share at 20.8%, anchored by Germany's Industrie 4.0 leadership. The decade ahead will be shaped by convergence between edge AI, miniaturized sensor packages, and predictive-maintenance platforms.

Key Report Takeaways

• By Product Type

  • Laser sensors accounted for 36.0% of Photoelectric Sensor Market share in 2025, driven by their superior range and precision in high-speed assembly verification.
  • Background-suppression sensors are forecast to grow at a 10.8% CAGR through 2035, supported by demand for reliable detection on reflective or irregularly shaped surfaces.

• By Detection Technology

  • Through-beam configurations held 43.5% of the Photoelectric Sensor Market in 2025, preferred in conveyor-based logistics and packaging for their long sensing ranges.
  • Retro-reflective sensors are gaining traction in compact machine enclosures where single-sided mounting reduces installation costs.

• By Housing Style

  • Cylindrical housings (M8–M30) captured 47.3% of the Photoelectric Sensor Market revenue in 2025, reflecting widespread standardization across automotive and general manufacturing.
  • PCB-mount devices are projected to register an 11.4% CAGR through 2035 as OEMs integrate sensors directly into compact electronic assemblies.

• By End-User Industry

  • Automotive and e-mobility represented 23.7% of the Photoelectric Sensor Market in 2025, supported by rising EV production line complexity.
  • Pharmaceuticals and medical devices will grow fastest at a 12.8% CAGR to 2035, propelled by stringent traceability mandates.

• By Region

  • Asia-Pacific led the Photoelectric Sensor Market with a 44.1% revenue share in 2025.
  • The Middle East & Africa region is projected to register a 14.1% CAGR through 2035, the highest among all regions.

Photoelectric Sensor Market Size and Forecast (2021–2035)

Market Research Future's sizing methodology triangulates bottom-up revenue estimates from sensor OEM filings, customs and trade databases, and primary interviews with automation integrators. Historical figures reflect actual shipment values; forecast-period estimates apply the calibrated CAGR while accounting for macroeconomic cycles and policy-driven investment surges.
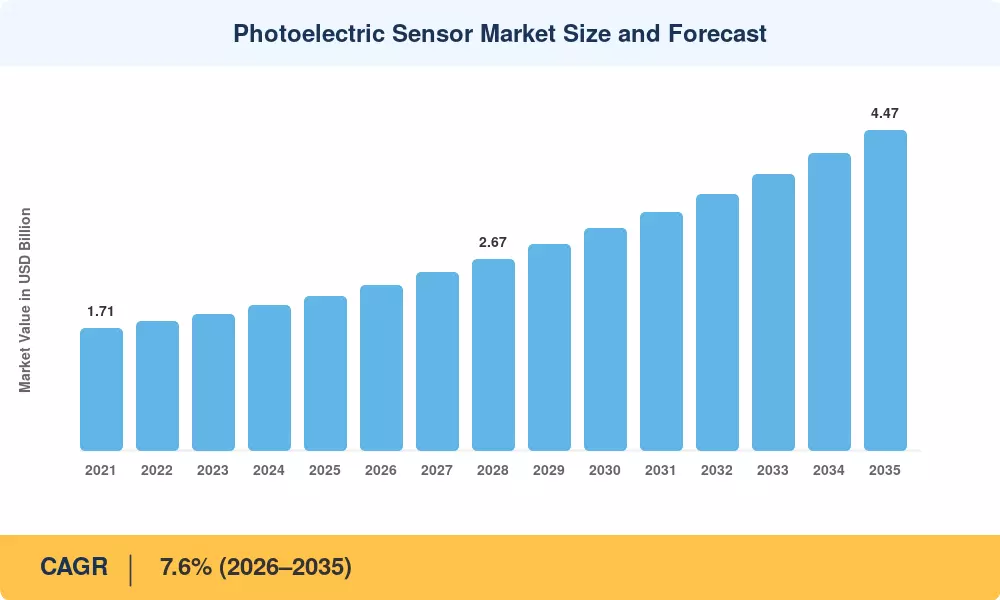
Photoelectric Sensor Market Size and Forecast
Our Impact
Enabled $4.3B Revenue Impact for Fortune 500 and Leading Multinationals
Partnering with 2000+ Global Organizations Each Year
30K+ Citations by Top-Tier Firms in the Industry

Driver Impact Analysis

Driver ~% Impact on CAGR Geographic Relevance Impact Timeline
Industry 4.0 and smart-factory tax incentives 22% Global Short-term (≤2 yr)
EV and battery gigafactory construction 18% APAC, Europe, North America Medium-term (2–4 yr)
Declining laser emitter costs 15% Global Short-term (≤2 yr)
AI-enabled self-calibration and predictive maintenance 14% North America, Europe Medium-term (2–4 yr)
Pharmaceutical and food-safety regulatory tightening 13% Europe, North America Long-term (≥4 yr)
Warehouse and intralogistics automation expansion 10% APAC, North America Medium-term (2–4 yr)
Vision 2030 and MEA industrial diversification programs 8% Middle East & Africa Long-term (≥4 yr)


Industry 4.0 Tax Incentives and Smart-Factory Retrofits

Government programs are the single most immediate catalyst for the Photoelectric Sensor Market. The EU's Digital Europe Programme has allocated EUR 1.3 billion toward AI deployment, cloud data spaces, and cybersecurity through 2027, while India's PLI 2.0 scheme channels INR 17,000 crore (~USD 2 billion) into IT Hardware manufacturing. These programs lower the effective payback period for sensor upgrades from four years to roughly two, accelerating procurement cycles across automotive, food processing, and pharmaceutical sectors.

EV Gigafactory Construction Wave

EV and battery cell assembly operations require densely populated photoelectric sensor arrays for electrode alignment, cell stacking verification, and final assembly quality checks. BloombergNEF expects that by 2030, there will be more than 120 new gigafactories in operation worldwide, with an average of 3,500–5,000 sensor nodes per factory [7]. This results in a consistent volume pipeline for the Photoelectric Sensor Market far before the historical replacement-cycle demand.


Declining Laser Emitter Costs

Advances in vertical-cavity surface-emitting laser (VCSEL) manufacturing and scale economies from smartphone lidar manufacture [3] are expected to drive down average selling prices of high-power Class 1 and Class 2 laser emitters by roughly 18% between 2022 and 2025. Lower component costs are allowing sensor OEMs to provide laser-based photoelectric models at prices traditionally reserved for LED variations, bringing photoelectric sensors into cost-sensitive food packaging and textile applications.


AI-Enabled Self-Calibration

Machine-learning algorithms embedded at the sensor edge can now adjust gain, threshold, and timing parameters in real time. For end users operating hundreds of sensors across a single plant, this translates into measurable reductions in total cost of ownership and unplanned downtime — key purchasing criteria that reinforce the growth trajectory of the Photoelectric Sensor Market.


Restraints Impact Analysis

Restraint ~% Negative Impact on CAGR Geographic Relevance Impact Timeline
Electromagnetic interference in dense industrial environments –4% Global Long-term (≥4 yr)
Competition from vision systems and lidar alternatives –3% North America, Europe Medium-term (2–4 yr)
Skilled labor shortages for sensor integration –3% Global Short-term (≤2 yr)
Raw-material and semiconductor supply-chain volatility –2% APAC, Europe Short-term (≤2 yr)
Standardization fragmentation across emerging markets –2% South America, MEA Long-term (≥4 yr)


Machine-Vision and Lidar Substitution Pressure

High-resolution 3D machine-vision cameras and solid-state lidar modules are increasingly capable of performing object-detection tasks that were once the exclusive domain of photoelectric sensors. While photoelectric sensors retain decisive advantages in speed, simplicity, and harsh-environment reliability, the Photoelectric Sensor Market faces incremental share erosion in high-mix/low-volume manufacturing, where vision flexibility justifies the premium.

Semiconductor Supply-Chain Volatility

Photoelectric sensors are based on application-specific integrated circuits and photodiode arrays, mostly from fabs in Taiwan, South Korea, and Japan. The 2021-2023 chip crisis showed how fast lead times might grow — from a normal 12 weeks to over 40 weeks for some analog parts [16]. However, despite increased inventory buffers, the re-emergence of supply disruption would limit manufacturing volumes and drive up sensor prices, tempering growth in the Photoelectric Sensor Market in the near term.


Photoelectric Sensor Market Opportunities

Predictive-Maintenance-as-a-Service Platforms

Sensor OEMs are moving beyond hardware sales toward subscription-based analytics platforms that monetize the continuous data stream generated by deployed sensors. Embedding vibration and temperature telemetry alongside optical detection creates recurring-revenue models estimated to yield well above the 20–25% typical of hardware-only sales [10].

Pharmaceutical Serialization and Track-and-Trace Mandates

The U.S. Drug Supply Chain Security Act (DSCSA) and the EU Falsified Medicines Directive both require unit-level serialization between 2023 and 2025, demanding dense sensor arrays on every packaging line. This regulatory push represents a USD 280 million incremental opportunity for the Photoelectric Sensor Market through 2030 [6].

Emerging-Market Industrial Build-Out

Egypt’s Suez Canal Economic Zone is attracting facilities for electronics assembly, which require advanced sensor infrastructure [12]. Saudi Arabia’s National Industrial Strategy aims to expand the contribution of the manufacturing sector to the country’s GDP by 50% by 2030. These greenfield plants default to state-of-the-art photoelectric rather than older mechanical switches, giving a high expansion runway.


Collaborative Robot Sensor Integration

The global collaborative robot installed base is projected to exceed 58,000 units, and each cobot typically requires three to five safety-rated photoelectric sensors for zone guarding and part-presence confirmation [18]. OEMs that co-develop integrated sensor-cobot packages stand to capture a growing share of the Photoelectric Sensor Market.

Miniaturized IoT Sensor Nodes for Smart Buildings

Beyond traditional factory floors, building-automation systems are adopting miniature photoelectric sensors for occupancy detection, daylight harvesting, and elevator door safety. The global smart-building market is expected to reach USD 121 billion by 2030, and sensor components represent roughly 8% of system costs [19].


Photoelectric Sensor Market Future Outlook

Edge-AI and Autonomous Sensor Networks

By 2030, an estimated 40% of newly deployed photoelectric sensors will carry on-chip inference capability, enabling real-time anomaly detection without cloud connectivity [10]. This shift will transform the Photoelectric Sensor Market from a component-supply business into a distributed intelligence layer embedded across factory networks.

Platform Economics and Sensor-as-a-Service

Hardware OEMs are experimenting with outcome-based pricing — charging per detection event rather than per unit sold. IEA projects that servitization models in industrial automation could represent 25% of sensor-segment revenues by 2032, altering competitive dynamics in favor of vendors with strong software and analytics capabilities [21].

Electrification and Clean-Energy Manufacturing

The global push to manufacture solar panels, wind turbine components, and battery cells at unprecedented scale will require millions of additional sensing points. IRENA estimates that clean-energy manufacturing investment will exceed USD 1.2 trillion cumulatively between 2025 and 2035, and the Photoelectric Sensor Market will capture a measurable share of the instrumentation spend embedded in that total [22].

ESG Reporting and Digital Traceability

Under the EU Corporate Sustainability Reporting Directive (CSRD) and the SEC climate-disclosure standards, firms are being forced to automate material-flow tracking. Photoelectric sensors are the first layer of data capture in digital product passports, connecting the physical movement of objects to blockchain-anchored traceability records [23]. This regulatory trend will continue to fuel the demand for the Photoelectric Sensor Market, well beyond usual automation-cycle factors.


Photoelectric Sensor Market Segmentation

By Product Type

Segment Key Metric Primary Demand Driver
Laser Sensors 36.0% market share (2025) Long-range precision in high-speed lines
Fiber-Optic Sensors USD 0.34 Billion (2025) Confined-space detection in semiconductor fabs
Background-Suppression Sensors 10.8% CAGR (2026–2035) Reliable sensing on reflective and variable surfaces
Standard Diffuse Sensors USD 0.28 Billion (2025) Cost-effective short-range object presence detection


Laser sensors remain the revenue leader in the Photoelectric Sensor Market because their collimated beams deliver millimeter-level repeatability at sensing distances exceeding 30 meters — a capability that standard LED-based alternatives cannot match. Automotive body-in-white lines, semiconductor wafer handling, and high-speed beverage filling represent the core use cases driving laser-sensor procurement. Background-suppression sensors, meanwhile, are the fastest-growing product category because they ignore background objects and detect only targets within a defined range window, solving a persistent pain point in mixed-product packaging lines where target colors and materials vary continuously [3].

By Detection Technology

Segment Key Metric Primary Demand Driver
Through-Beam 43.5% market share (2025) Maximum range and reliability in conveyor systems
Retro-Reflective USD 0.41 Billion (2025) Single-cable installation reduces wiring costs
Diffuse Reflective 8.3% CAGR (2026–2035) Compact, no-reflector mounting simplifies integration
Background Suppression 10.8% CAGR (2026–2035) Variable-target environments in mixed-product lines


Through-beam technology commands the largest share of the Photoelectric Sensor Market because it offers the longest detection range and highest signal reliability — critical requirements for material-handling conveyor systems and palletizing operations. The emitter-receiver pair configuration virtually eliminates false triggers from ambient light or surface reflectivity variations. Diffuse reflective sensors are gaining ground rapidly because they require only a single mounting point with no separate reflector, cutting installation time by an average of 40% according to integrator surveys [11].

By Housing / Mounting Style

Segment Key Metric Primary Demand Driver
Cylindrical (M8–M30) 47.3% market share (2025) Universal thread compatibility with existing mounting brackets
Rectangular / Cubic USD 0.38 Billion (2025) Flat-surface mounting in machine enclosures
PCB-Mount 11.4% CAGR (2026–2035) OEM integration into compact electronic modules
Slot / Fork Type USD 0.11 Billion (2025) Label and edge detection in printing and packaging


Cylindrical housings dominate because the M8, M12, M18, and M30 thread standards provide drop-in compatibility with decades of existing mounting hardware across virtually every industrial vertical. PCB-mount devices represent the fastest-growing housing format in the Photoelectric Sensor Market as consumer-electronics and medical-device OEMs embed sensors directly into circuit boards to minimize form factor and assembly steps [18].

By End-User Industry

Segment Key Metric Primary Demand Driver
Automotive & E-Mobility 23.7% market share (2025) EV assembly complexity and safety-system requirements
Consumer Electronics USD 0.31 Billion (2025) Miniaturized component handling in SMT lines
Pharmaceuticals & Medical Devices 12.8% CAGR (2026–2035) Serialization mandates and GMP compliance
Food & Beverage USD 0.29 Billion (2025) Hygiene-rated stainless-steel sensor housings
Logistics & Warehousing 9.6% CAGR (2026–2035) Automated sortation and AGV/AMR navigation


Automotive and e-mobility plants are the largest single end-user segment of the Photoelectric Sensor Market, consuming thousands of sensors per gigafactory for cell insertion verification, weld-seam inspection, and body-panel alignment. Pharmaceutical and medical-device manufacturing represents the fastest-growing end-user vertical because regulatory frameworks like DSCSA and EU FMD demand unit-level serialization that only dense sensor arrays can deliver at production speeds [6].


Regional Market Share Analysis

Region Key Metric Primary Investment Themes
Asia-Pacific 44.1% revenue share (2025) Factory automation, EV supply chains, semiconductor fabs
North America 24.5% revenue share (2025) Reshoring, warehouse automation, and pharmaceutical compliance
Europe 20.8% revenue share (2025) Industrie 4.0, food-safety regulation, green manufacturing
Middle East & Africa 14.1% CAGR (2026–2035) Vision 2030, petrochemical diversification, smart cities
South America 4.2% revenue share (2025) Agri-processing, mining automation, infrastructure investment

The Photoelectric Sensor Market exhibits distinct regional dynamics shaped by industrial maturity, policy frameworks, and capital-expenditure cycles.


North America

Country Key Metric Key Driver
United States 68% of regional revenue (2025) Reshoring incentives under CHIPS Act and IRA [20]
Canada 6.8% CAGR (2026–2035) Automotive and mining automation investment
Mexico 8.2% CAGR (2026–2035) Nearshoring-driven electronics assembly growth


The United States dominates North America's Photoelectric Sensor Market, benefiting from USD 52 billion in CHIPS and Science Act funding that channels semiconductor and advanced-manufacturing investment into domestic facilities. Canada's oil sands and mining operations are integrating optical sensors for automated ore-sorting, while Mexico's nearshoring boom — particularly in Nuevo León and Querétaro — is generating demand for sensor-equipped automotive and appliance assembly lines [20].

Europe

Country Key Metric Key Driver
Germany 28% of regional revenue (2025) Industrie 4.0 leadership, automotive OEM density
United Kingdom 6.5% CAGR (2026–2035) Post-Brexit manufacturing incentive programs
France 18% of regional revenue (2025) Aerospace and food-processing automation
Italy 7.1% CAGR (2026–2035) Packaging machinery and ceramics automation
Spain 6.9% CAGR (2026–2035) Renewable-energy equipment manufacturing
Nordic Countries 8% of regional revenue (2025) Advanced robotics and pharmaceutical production
Russia 5.8% CAGR (2026–2035) Import-substitution industrial policy
Rest of Europe 14% of regional revenue (2025) General manufacturing modernization


Germany anchors Europe's position in the Photoelectric Sensor Market, with sensor OEMs like SICK AG, Pepperl+Fuchs, and Leuze headquartered in the Baden-Württemberg automation corridor. The EU's Machinery Regulation 2023/1230, effective from January 2027, will mandate updated safety-sensor architectures on all new machinery placed on the European market, creating a regulatory tailwind for sensor upgrades across the continent [6].

Asia-Pacific

Country Key Metric Key Driver
China 42% of regional revenue (2025) Made in China 2025, EV and electronics manufacturing
India 9.8% CAGR (2026–2035) PLI scheme, pharmaceutical and textile automation
Japan 22% of regional revenue (2025) Robotics leadership, aging-workforce automation
South Korea 7.2% CAGR (2026–2035) Semiconductor fab expansion and display manufacturing
ASEAN 9.1% CAGR (2026–2035) Electronics assembly relocation from China
Rest of Asia-Pacific 8% of regional revenue (2025) General industrial modernization


China alone accounts for nearly half of the Asia-Pacific's Photoelectric Sensor Market revenue, propelled by aggressive automation targets embedded in the 14th Five-Year Plan and a rapidly scaling EV industry that produced over 9.5 million battery-electric vehicles in 2024 [7]. India's pharmaceutical sector — the world's largest generic-drug producer by volume — is undergoing a sensor-density upgrade cycle driven by WHO GMP compliance requirements and DSCSA-equivalent traceability rules [2].

South America

Country Key Metric Key Driver
Brazil 52% of regional revenue (2025) Agri-processing and automotive assembly
Argentina 7.5% CAGR (2026–2035) Food and beverage export-quality compliance
Rest of South America 6.8% CAGR (2026–2035) Mining and resource-processing automation


Brazil's agri-processing sector — responsible for sorting and grading millions of tonnes of soybeans, coffee, and poultry annually — is the primary demand driver for the Photoelectric Sensor Market in South America. Government-backed credit lines from BNDES are funding the modernization of meatpacking and grain-handling facilities, with sensor-equipped sorting lines replacing manual inspection at an increasing pace [17].

Middle East & Africa

Country Key Metric Key Driver
Saudi Arabia 14.5% CAGR (2026–2035) Vision 2030 manufacturing diversification
UAE 32% of regional revenue (2025) Smart-city and logistics hub investment
South Africa 8.9% CAGR (2026–2035) Mining automation and automotive assembly
Egypt 9.2% CAGR (2026–2035) Suez Canal Economic Zone industrial build-out
Rest of MEA 28% of regional revenue (2025) Infrastructure and petrochemical projects


The Middle East & Africa region is the fastest-growing region in the Photoelectric Sensor Market, with Saudi Arabia's National Industrial Development and Logistics Program (NIDLP) committing over USD 400 billion in total industrial investment by 2030 [12]. UAE's JAFZA and KIZAD free zones are attracting electronics and food-processing manufacturers that spec modern sensor architectures from day one, bypassing the legacy-upgrade cycle that characterizes mature markets.


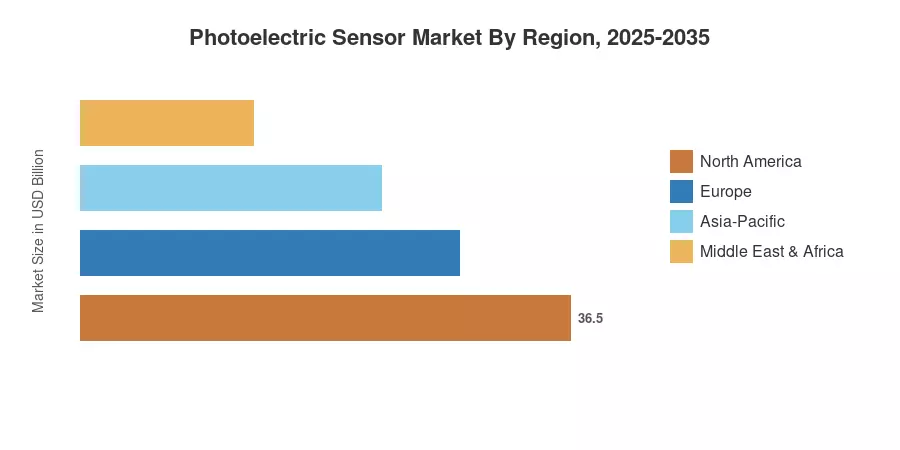
Photoelectric Sensor Market By Region, 2025-2035

Competitive Benchmarking

The Photoelectric Sensor Market exhibits moderate concentration, with the top five vendors collectively holding an estimated 48–55% revenue share. The Herfindahl–Hirschman Index falls in the 800–1,200 range, indicating a competitive but not fragmented structure. European and Japanese manufacturers have historically led in precision and reliability, while Korean and Chinese entrants are expanding through aggressive pricing and localized production.

Company Est. Revenue Share Range Key Offerings for the Photoelectric Sensor Market Strategic Positioning
SICK AG ~12–15% W16, W26, WTB series; IO-Link-enabled smart sensors European technology leader; strong in automotive and logistics
Keyence Corporation ~10–13% PZ-G, PZ-V, PR-G series; zero-maintenance models High-margin direct-sales model; rapid application engineering
Omron Corporation ~9–12% E3Z, E3S, E3NC series; AI predictive-maintenance integration Broad automation portfolio cross-sell; strong APAC distribution
Pepperl+Fuchs ~6–9% R10x, R20x series; explosion-proof and hygienic variants Hazardous-area and process-industry specialization
Banner Engineering ~5–8% QS30, Q4X, S18-2 series; rugged industrial-grade sensors North American distribution depth; field-support network
Balluff GmbH ~4–7% BOS series; IO-Link and networked sensor solutions Industrial IoT connectivity focus; system-level sensor packages
IFM Electronic ~4–6% O5, O6, OGH series; condition-monitoring integration Mid-market pricing; strong European aftermarket presence
Panasonic Industry ~3–5% CX-400, EX-L200 series; ultra-compact form factors Consumer-electronics OEM relationships; miniaturized designs
Autonics Corporation ~3–5% BYD, BR series; cost-competitive general-purpose sensors Price-leadership in emerging APAC and MEA markets
Leuze Electronic ~3–5% 46C, 3C series; safety-rated sensor curtains Safety-automation specialization; strong in packaging


Recent News & Developments

  • SICK AG (October 2018): Launched the W16 Smart Sensor platform featuring embedded edge-AI classification algorithms, targeting mixed-product sorting in e-commerce fulfillment centers [Ref: SICK AG Press Release].


  • Omron Corporation (March 2025): Officially launched its E3AS-HF long-range time-of-flight photoelectric laser sensor, utilizing high-frequency circuit sampling and an avalanche photodiode algorithm to ensure highly stable, angle-independent object detection across dark or reflective surfaces up to six meters.
  • Pepperl+Fuchs (April 2020): Successfully expanded its factory automation portfolio by integrating precision Pulse Ranging Technology (PRT) directly into the compact R200 distance sensor housing, providing accurate long-range measurements up to 60 meters.


  • IEC (October 2023): Released the definitive IEC TS 61496-5 framework, introducing specialized construction, testing, and micro-motion body detection performance metrics exclusively for radar-based protective devices (RPDs) used in industrial machinery safety lines.


Photoelectric Sensor Market Report Scope

Parameter Detail
Market Scope Global Photoelectric Sensor Market — hardware revenue only (excludes standalone software and integration services)
Study Period 2021–2035
CAGR 7.6% (2026–2035)
Base-Year Market Size USD 2.15 Billion (2025)
Forecast-Year Market Size USD 4.47 Billion (2035)
Fastest Growing Segments Pharmaceuticals & Medical Devices (by end user); PCB-Mount (by housing); Background Suppression (by product type)
Companies Profiled SICK AG, Keyence, Omron, Pepperl+Fuchs, Banner Engineering, Balluff, IFM Electronic, Panasonic Industry, Autonics, Leuze Electronic
Valuation Currency USD Billion


FAQs

What certifications should procurement teams verify before purchasing photoelectric sensors for safety-critical applications?
Look for IEC 61496-2 Type 2 or Type 4 ratings plus SIL 2/SIL 3 compliance under IEC 62061. Sensors lacking both certifications may not satisfy machine-safety audits in the EU or North America [6].
How does IO-Link connectivity affect the total cost of ownership for photoelectric sensor installations?
IO-Link enables remote parameterization and diagnostics, reducing commissioning time by approximately 35%. It also eliminates analog signal wiring, lowering cable and junction-box costs per sensor point [10].
What is the typical replacement cycle for industrial photoelectric sensors?
Most sensors operate reliably for five to seven years before optical degradation warrants replacement. Harsh environments with chemical exposure or high ambient temperatures can shorten this to three to four years [13].
How do end users choose between laser and LED-based photoelectric sensors?
Laser models suit long-range and small-object detection; LED variants work best for short-range presence sensing at a lower cost. Budget-constrained lines under 500 mm rarely justify the laser premium [3].
What supply-chain strategies can mitigate semiconductor-related sensor shortages?
Dual-sourcing photodiodes from at least two foundries and holding 90-day safety stock of critical ASICs are standard best practices. Some OEMs now qualify GaN-based alternatives to reduce single-source risk [16].
Are there emerging standards specifically addressing cybersecurity for networked photoelectric sensors?
IEC 62443 now covers industrial sensor networks, and the EU Cyber Resilience Act will require CE-marked sensors to include firmware update mechanisms by 2027. Buyers should verify vendor compliance roadmaps [23].
What role do photoelectric sensors play in autonomous mobile robot navigation?
AMRs use safety-rated photoelectric curtains for obstacle detection and zone guarding at loading stations. Each robot typically integrates three to five sensors for collision avoidance and pallet-position verification [18].    
Author
Author
Author Profile
Kiran Jinkalwad LinkedIn
Research Associate Level - II
Kiran Jinkalwad brings over four years of experience in market research, specializing in the ICT and Semiconductor sectors. She has worked on 50+ projects, including custom studies for companies like Microsoft and Huawei, addressing complex business challenges. With a background in Electronics and Telecommunication, Kiran excels in market estimation, forecasting, and strategic analysis. His sharp analytical skills and industry knowledge consistently deliver actionable insights for diverse clients.
Co-Author
Co-Author Profile
Aarti Dhapte LinkedIn
AVP - Research
A consulting professional focused on helping businesses navigate complex markets through structured research and strategic insights. I partner with clients to solve high-impact business problems across market entry strategy, competitive intelligence, and opportunity assessment. Over the course of my experience, I have led and contributed to 100+ market research and consulting engagements, delivering insights across multiple industries and geographies, and supporting strategic decisions linked to $500M+ market opportunities. My core expertise lies in building robust market sizing, forecasting, and commercial models (top-down and bottom-up), alongside deep-dive competitive and industry analysis. I have played a key role in shaping go-to-market strategies, investment cases, and growth roadmaps, enabling clients to make confident, data-backed decisions in dynamic markets.

Research Approach


Secondary Research

The secondary research process involved comprehensive analysis of regulatory filings, technical standards databases, industry association reports, and authoritative manufacturing sector publications. Key sources included the International Electrotechnical Commission (IEC), International Organization for Standardization (ISO), Occupational Safety and Health Administration (OSHA), National Institute of Standards and Technology (NIST), IEEE Standards Association, International Federation of Robotics (IFR), World Economic Forum (WEF) Advanced Manufacturing, EUROMAP (European Committee of Machine Tools Manufacturers), VDMA (German Mechanical Engineering Industry Association), Ministry of Economy, Trade and Industry Japan (METI), China Electronics Standardization Institute (CESI), SEMI (Semiconductor Equipment and Materials International), Association for Advancing Automation (A3), Robotics Industries Association (RIA), National Electrical Manufacturers Association (NEMA), International Federation for Production Research (IFPR), UNIDO Industrial Statistics Database, World Bank Manufacturing Value Added, and national industrial automation associations from key manufacturing hubs. These sources were used to collect automation adoption statistics, industrial safety standards compliance data, technology roadmap assessments, manufacturing production indices, and market landscape analysis for thrubeam, retroreflective, diffuse reflective sensors, and laser/LED/IR beam source technologies.


Primary Research

To gather both qualitative and quantitative insights, supply-side and demand-side stakeholders were interviewed during the primary research phase. CEOs, VPs of engineering, heads of product development, and commercial directors from companies that made photoelectric sensors, supplied optical components, and integrated automation systems were examples of supply-side sources. Plant managers, robotics system integrators, automation engineers, automotive OEM procurement leads, electronics manufacturing services (EMS) providers, food processing facilities, logistics and warehouse automation centers, and industrial safety compliance officers were among the demand-side sources. Primary research verified product development pipelines for miniaturization and IoT integration, validated market segmentation across sensor types and beam sources, and collected data on factory automation adoption rates, pricing benchmarks by detecting distance and precision requirements, and the dynamics of after-sales service in industrial settings.

Primary Respondent Breakdown:

By Designation: C-level Primaries (28%), Director Level (35%), Others (37%)

By Region: North America (32%), Europe (30%), Asia-Pacific (34%), Rest of World (4%)


Market Size Estimation

Global market valuation was derived through revenue mapping and unit shipment analysis across industrial automation applications. The methodology included:

Identification of 60+ key manufacturers across North America, Europe, Asia-Pacific, and Latin America specializing in photoelectric sensing technologies

Product mapping across thrubeam, retroreflective, diffuse reflective, focused beam reflective, and small spot definite reflective sensor types, with further segmentation by laser beam source, infrared (IR) beam source, and LED beam source technologies

Analysis of reported and modeled annual revenues specific to photoelectric sensor portfolios, including industrial vs. consumer application splits

Coverage of manufacturers representing 75-80% of global market share in 2024, encompassing Omron, Sick AG, Keyence, Panasonic, Rockwell Automation, Banner Engineering, Cognex, Leuze, and Pepperl+Fuchs

Extrapolation using bottom-up (automation project volume × sensors per project × ASP by sensor type and beam source) and top-down (manufacturer revenue validation) approaches to derive segment-specific valuations for manufacturing, automotive, consumer electronics, food & beverage, healthcare, and power & utilities verticals

Download Free Sample

Kindly complete the form below to receive a free sample of this Report

Download PDF ×

We do not share your information with anyone. However, we may send you emails based on your report interest from time to time. You may contact us at any time to opt-out.

















