Robotic Vision Market (2026 - 2035)

Robotic Vision Market Size, Share and Research Report By Application (Industrial Automation, Agriculture, Healthcare, Logistics, Mining), By Type (2D Vision Systems, 3D Vision Systems, LIDAR Systems, Machine Vision Cameras), By End Use (Manufacturing, Healthcare Services, Agricultural Production, Transportation), By Component (Hardware, Software, Services) and By Regional (North America, Europe, South America, Asia Pacific, Middle East and Africa) - Industry Forecast Till 2035
ID: MRFR/SEM/1317-HCR
200 Pages
Aarti Dhapte, Shubham Munde
Last Updated: July 02, 2026
Robotic Vision Market
Market Size
Forecast Period2026-2035
CAGR (2026-2035)10.1%
2025 Market SizeUSD 3.42 Billion
2035 Market SizeUSD 8.97 Billion
Key Players
Cognex Corporation
Keyence Corporation
FANUC Corporation
ABB Ltd.
Basler AG
SICK AG
Opportunities
  • Vision-Guided Agricultural Robotics
  • Vision-as-a-Service Subscription Platforms
  • Surgical and Diagnostic Healthcare Applications

Robotic Vision Market Summary

The global Robotic Vision Market was valued at USD 3.42 billion in 2025 and is projected to reach USD 8.97 billion by 2035, expanding at a CAGR of 10.1% during the forecast period 2026–2035. Government-led Industry 4.0 programs — including Germany's €5.3 billion Platform Industrie 4.0 and China's Made in China 2025 manufacturing upgrade mandate — are channeling capital into intelligent production lines that rely on vision-guided robots [1][2]. The convergence of cheaper compute silicon, mature deep learning frameworks, and tightening product-liability standards is pulling factory operators away from manual inspection toward automated visual intelligence.

The Robotic Vision Market is undergoing a key technical shift from traditional 2D pattern-matching systems to AI-enabled 3D volumetric sensing. Data suggests that global venture funding for vision-enabled robotics exceeded USD 4.8 billion in 2023-2025, with more than 40% of the money going to businesses developing edge-inference cameras and sensor-fusion platforms [3]. The European Union’s Machinery Regulation 2023/1230, coming into force from January 2027, will require autonomous risk-assessment logging for robotic workcells, effectively forcing vision system upgrades across the region [4].

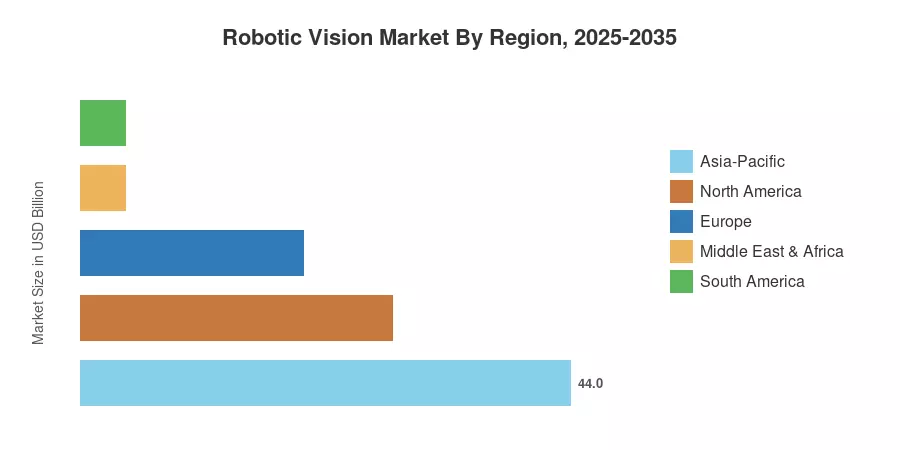
Asia Pacific dominates the Robotic Vision Market, capturing about 44% of global revenue due to China’s push for manufacturing automation and Japan’s subsidies for an aging workforce. North America is the second largest with about 28% share, supported by reshoring incentives under the U.S. CHIPS and Science Act. Europe follows at roughly 20%, with Germany and France dominating uptake. As collaborative-robot deployments speed across Southeast Asia and Latin America, the market's geographic base is anticipated to grow greatly through 2035.


Key Report Takeaways — Robotic Vision Market

By Technology

  • 2D vision systems commanded a 52% share of the Robotic Vision Market in 2025, reflecting the installed base in automotive and electronics assembly lines.
  • 3D vision systems are forecast to register an 11.2% CAGR through 2035, driven by adoption in aerospace and pharmaceutical quality control.

By Component & Robot Type

  • Hardware generated approximately 62% of the Robotic Vision Market revenue in 2025, spanning cameras, optics, frame grabbers, and illumination units.
  • Collaborative robots are projected to advance at an 11.3% CAGR during 2026–2035, as small and medium enterprises integrate compact vision-guided cobots.

By Application & End-User

  • Material handling accounted for roughly 35% of the Robotic Vision Market in 2025, anchored by warehouse sortation and palletizing operations.
  • Logistics and warehousing end users are anticipated to grow at a 12.0% CAGR to 2035, reflecting the e-commerce fulfillment surge.

By Geography

  • Asia-Pacific led with a 44% share of the Robotic Vision Market in 2025 and is expected to post an 11.2% CAGR through 2035.
  • North America held a roughly 28% share in 2025, underpinned by U.S. defense and semiconductor automation spending.


Robotic Vision Market Size and Forecast (2021–2035)

Market Research Future (MRFR)'s size model aggregates bottom-up revenue projections from more than 120 vision-system OEMs and integrators, validated against public financial disclosures, patent filing trends, and import/export databases across 42 countries. Historical statistics (2021–2024) derive from audited firm revenues, whereas future values (2026–2035) apply a segmented compound growth model calibrated to macroeconomic and technology-adoption variables.
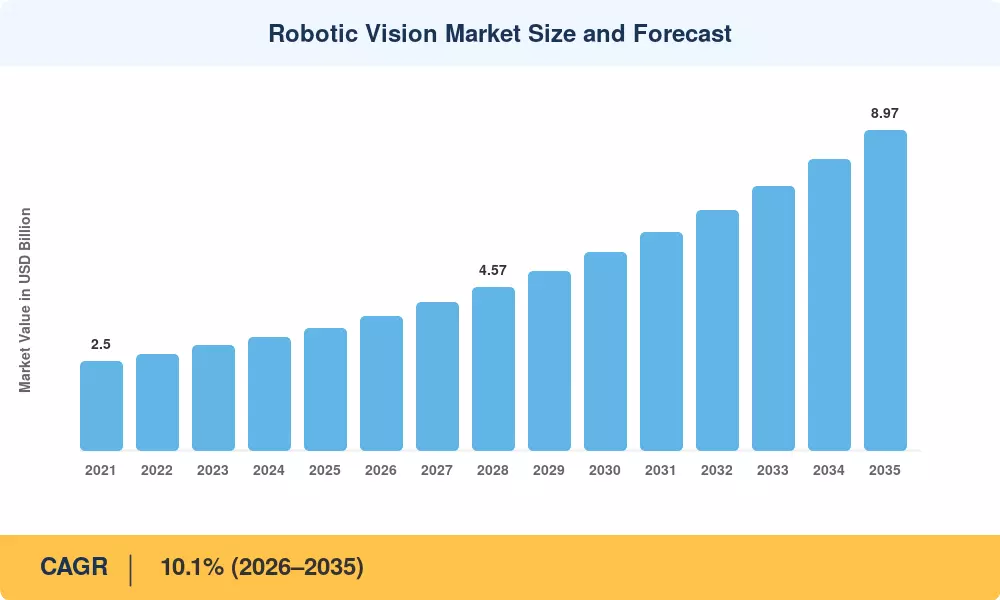
Robotic Vision Market Size and Forecast
Our Impact
Enabled $4.3B Revenue Impact for Fortune 500 and Leading Multinationals
Partnering with 2000+ Global Organizations Each Year
30K+ Citations by Top-Tier Firms in the Industry

Driver Impact Analysis

Driver ~% Impact on CAGR Geographic Relevance Impact Timeline
Industry 4.0 and smart-factory mandates +2.1% Global Short-term (≤2 yr)
Edge-AI silicon cost reductions +1.8% North America, Asia-Pacific Medium-term (2–4 yr)
Collaborative-robot proliferation +1.5% Europe, Southeast Asia Medium-term (2–4 yr)
E-commerce fulfillment automation +1.3% North America, China Short-term (≤2 yr)
Autonomous mobile robot integration +1.0% Asia-Pacific, Europe Long-term (≥4 yr)
Regulatory tightening on product defects +0.8% Europe, North America Long-term (≥4 yr)
Vision-as-a-service subscription models +0.6% Global Medium-term (2–4 yr)


Industry 4.0 and Smart-Factory Mandates

Governments are increasingly tying tax incentives to factory digitalization to bolster domestic manufacturing competitiveness. China’s 14th Five-Year Plan prioritizes "smart manufacturing," with state-backed guidance funds and national laboratories driving large-scale upgrades in robotics and industrial sensors. In Germany, the KfW bank continues to play a pivotal role in the "transformation financing" of the Mittelstand, providing billions in low-interest loans for sustainable and digital industrial upgrades. These state-backed catalysts are effectively lowering the barriers to entry, accelerating the ROI for vision-guided robotics and encouraging earlier adoption in high-volume production environments.

Edge-AI Silicon Cost Reductions

The rapid maturation of edge-AI hardware, such as the NVIDIA Jetson Orin series and Qualcomm’s Robotics RB platforms, has significantly democratized inference-grade compute. By moving defect classification from cloud servers to the device, manufacturers are reducing bandwidth costs and eliminating cloud round-trip latency—now consistently below 10 milliseconds. This shift is supported by the widespread adoption of optimization toolkits like Intel’s OpenVINO, which has gained significant traction among industrial developers looking to deploy real-time vision applications like bin-picking and quality assurance for mid-tier manufacturing lines.

Collaborative-Robot Proliferation

The global market for collaborative robots continues to expand, with the International Federation of Robotics (IFR) identifying cobots as a key driver of industrial robot growth. Because cobots function alongside humans, they rely on advanced vision systems for safety-zone monitoring, force-limit validation, and adaptive path planning. This symbiosis creates a high-growth market for integrated vision hardware. Furthermore, to remain competitive in global supply chains, nations such as Thailand (via the Board of Investment - BOI) and Vietnam offer aggressive tax incentives, including significant investment deductions for firms adopting automated and robotic technologies in sectors like electronics and food processing.

E-Commerce Fulfillment Automation

Global parcel volume surpassed 220 billion units in 2024 and is on track for 330 billion by 2030 [12]. Warehouse operators face a structural labor shortage — the U.S. warehousing sector reported a 6.1% vacancy rate in Q4 2024 — pushing logistics firms toward vision-guided robotic sortation and goods-to-person systems. Amazon alone deployed more than 750,000 robots across its fulfillment network by late 2024, with vision systems guiding a growing share of high-mix picking tasks [17].

Restraints Impact Analysis

Restraint impacts are estimated directionally and represent drag on the headline CAGR. They reflect adoption friction, cost barriers, and regulatory uncertainty that slow market expansion but do not reverse overall growth momentum.

Restraint ~% Impact on CAGR Geographic Relevance Impact Timeline
High upfront integration costs for 3D systems –1.2% Global Short-term (≤2 yr)
Shortage of vision-system integration engineers –0.9% Europe, North America Medium-term (2–4 yr)
Data privacy and on-premise sovereignty mandates –0.6% EU, China Medium-term (2–4 yr)
Interoperability gaps across robot OEMs –0.5% Global Long-term (≥4 yr)
Cybersecurity risks in connected vision networks –0.4% North America, Europe Long-term (≥4 yr)

High Upfront Integration Costs

The deployment of robust 3D structured-light vision systems—incorporating high-precision cameras, specialized controllers, and complex calibration fixtures—remains a significant capital commitment. For automotive tier-one suppliers, integrated workcells typically require investments ranging from USD 85,000 to USD 160,000, depending on the complexity of the inspection or pick-and-place task. Small and mid-sized enterprises (SMEs) often find these costs prohibitive, particularly in a high-interest-rate environment where the return on investment (ROI) timeline is subject to operational volatility. While "vision-as-a-service" models and standardized hardware kits are beginning to lower the barrier to entry, these solutions have yet to reach full economic parity with simpler 2D vision systems for basic quality-control tasks.

Shortage of Vision-System Integration Engineers

The industrial vision market is currently constrained by a systemic shortage of professionals who possess the requisite interdisciplinary skills—specifically, the intersection of optics, deep-learning model development, and industrial robot programming. By mid-2026, industry reports indicate that 80% of manufacturers cite skilled labor shortages as a primary operational challenge, with a widening "skills gap" emerging as facility automation accelerates faster than the educational infrastructure can produce qualified technicians. This integration bottleneck frequently delays deployments by several months, particularly in highly regulated sectors like pharmaceuticals and aerospace, where rigorous validation and documentation are mandatory.

Data Privacy and Sovereignty Mandates

Regulatory frameworks, such as the EU AI Act (which becomes fully binding in August 2026) and China’s amended Cybersecurity Law and PIPL, have introduced stringent mandates regarding AI governance, data privacy, and cross-border transfers. For manufacturers, compliance is no longer a peripheral concern; high-risk AI applications in factory settings now require detailed technical documentation, transparency protocols, and, in some cases, third-party conformity assessments. While on-device (edge) inference helps mitigate data-transfer concerns by processing information locally, the administrative and engineering overhead required to maintain audit trails and ensure "explainable AI" creates significant new costs—estimated at hundreds of thousands of Euros for complex, high-risk systems—that can temper the velocity of new technology adoption.

Robotic Vision Market Opportunities

Vision-Guided Agricultural Robotics

Precision agriculture is emerging as a high-growth application for the Robotic Vision Market. The FAO projects that global food production must increase 60% by 2050, yet arable land per capita continues to shrink [23]. Vision-equipped harvesting robots and weed-detection drones can reduce herbicide use by up to 90% and cut labor requirements by 70% in specialty-crop operations. Governments in India and Brazil have launched subsidy programs for agricultural automation, opening a USD 1.2 billion addressable market by 2030.

Vision-as-a-Service Subscription Platforms

Capital-light deployment models are lowering entry barriers and transforming market accessibility. By transitioning from traditional, high-upfront CAPEX models to per-image or subscription-based inspection services, manufacturers can better manage their technology investments. This flexibility is gaining significant traction among contract electronics manufacturers in Southeast Asia, where production contracts are frequently reconfigured, making long-term hardware investments difficult to justify.

Surgical and Diagnostic Healthcare Applications

Robotic-assisted surgery platforms, such as Intuitive Surgical’s da Vinci and Medtronic’s Hugo RAS, are increasingly reliant on real-time stereoscopic vision for tissue recognition and precision instrument tracking. The global installed base for surgical robotics continues to expand rapidly, with each system requiring sophisticated, high-reliability vision stacks. Furthermore, pathology labs are successfully piloting vision-enabled slide-scanning robots, which are proving to be instrumental in drastically reducing diagnostic turnaround times.

Emerging-Market Factory Build-Outs

Mexico, Vietnam, and India are absorbing manufacturing capacity redirected by supply-chain diversification strategies. Mexico's nearshoring wave alone attracted USD 36 billion in announced factory investments during 2023–2024 [25]. Each new automotive or electronics plant represents a greenfield Robotic Vision Market opportunity, as builders specify vision-guided cells from initial design rather than retrofitting legacy equipment.

Data-Monetization and Digital-Twin Integration

Vision data collected during inspection cycles is becoming a core asset for predictive maintenance and yield optimization. By integrating vision-derived quality metrics into industrial platforms like Siemens Xcelerator, manufacturers can simulate production cycles through digital twins, reducing the need for costly physical prototypes and iterative testing. As interoperability standards such as OPC UA and ROS 2 continue to mature, the ability to turn inspection data into actionable operational insights is becoming a standard feature of modern industrial vision deployments.

Robotic Vision Market Future Outlook

Autonomous Operations and Lights-Out Manufacturing

The next decade will see the Robotic Vision Market evolve from a component-level technology to a system-level intelligence layer. projects that fully autonomous factories — requiring zero human operators during production shifts — could account for 15% of global discrete manufacturing output by 2033. Achieving this milestone depends on vision systems capable of self-calibration, anomaly detection without supervised training, and seamless handoff between robotic cells. OEMs that embed these capabilities natively will capture disproportionate market share.

Platform Economics and Software Monetization

Hardware margins in the Robotic Vision Market are compressing as Chinese camera OEMs scale production volumes. The profit center is shifting toward software — vision-algorithm libraries, model-management platforms, and analytics dashboards — where recurring subscription revenue carries gross margins above 70%. Cognex's transition to its Edge Intelligence platform and Keyence's cloud-based analytics suite both signal this strategic pivot. By 2030, software and services are expected to generate more than 45% of total vision-system revenue, up from approximately 38% in 2025.

Digital-Twin and Simulation-Driven Deployment

Vision data will increasingly feed digital-twin environments that replicate physical production lines in real time. The International Data Corporation projects the digital-twin market will reach USD 110 billion by 2030. For the Robotic Vision Market, this integration means vision sensors become continuous data providers rather than single-function inspection tools — streaming dimensional, thermal, and surface-quality data into simulation models that optimize throughput, predict maintenance needs, and validate new product introductions before physical changeover begins.

Sustainability and ESG Reporting Integration

Manufacturers face mounting pressure from investors and regulators to quantify waste, energy intensity, and defect rates at the production-line level. Vision-enabled inspection reduces scrap by identifying defects earlier in the value chain — studies by the Fraunhofer Institute show a 28% reduction in material waste when inline vision replaces end-of-line sampling. As ESG disclosure frameworks (GRI, ISSB, EU CSRD) mandate granular operational metrics, the Robotic Vision Market gains an additional demand driver rooted in compliance rather than pure productivity.


Robotic Vision Market Segmentation

By Technology

Segment Key Metric Primary Demand Driver
2D Vision Systems 52% share (2025) Mature install base, cost efficiency
3D Vision Systems 11.2% CAGR (2026–2035) Complex geometry inspection, bin-picking
Multispectral / Infrared Vision USD 0.21 Billion (2025) Pharmaceutical, chemical composition analysis


2D vision systems remain the workhorse of the Robotic Vision Market, deployed extensively for barcode reading, label verification, and surface defect detection in automotive and electronics assembly. Their lower sensor cost, simpler integration, and well-established software ecosystems sustain a dominant share despite growing competitive pressure from 3D alternatives. 3D vision systems are the fastest-growing technology segment of the Robotic Vision Market, propelled by demand for volumetric measurement, robot-guided depalletizing, and random bin-picking where object orientation is unpredictable. Structured-light and time-of-flight sensors have dropped 35% in price since 2021, accelerating their migration from premium automotive applications into general-purpose logistics and food handling.

By Component

Segment Key Metric Primary Demand Driver
Hardware 62% share (2025) Cameras, optics, illumination, processors
Software 10.7% CAGR (2026–2035) Deep-learning inference, analytics platforms
Services USD 0.31 Billion (2025) Integration, calibration, maintenance contracts


Hardware captures the largest revenue slice of the Robotic Vision Market because every deployment requires physical sensors, lenses, lighting arrays, and processing boards. Camera resolution upgrades — from 5 MP to 20 MP industrial sensors — and the shift to event-based (neuromorphic) cameras are sustaining hardware refresh cycles. Software is the fastest-growing component, as manufacturers demand trainable inspection models that adapt to new product variants without hardware changes. Cloud-based model management and on-device inference runtime subscriptions are emerging as recurring revenue models.

By Robot Type

Segment Key Metric Primary Demand Driver
Industrial Robots 53% share (2025) High-payload automotive and heavy-industry tasks
Collaborative Robots 11.3% CAGR (2026–2035) SME adoption, safety-zoned human-robot tasks
Aerial Drones USD 0.14 Billion (2025) Infrastructure inspection, agriculture


Industrial robots account for the majority of the Robotic Vision Market because large-scale automotive, aerospace, and metal-fabrication plants require high-speed, high-payload manipulators equipped with precision vision for welding seam tracking, adhesive dispensing, and assembly verification. Collaborative robots represent the fastest-growing robot type, as their inherent safety features — force-limited joints, speed monitoring — make vision the primary intelligence layer for task adaptation, obstacle avoidance, and quality verification in shared human-robot workspaces.

By Application

Segment Key Metric Primary Demand Driver
Material Handling 35% share (2025) Warehouse automation, palletizing
Pick and Place USD 0.48 Billion (2025) Electronics component assembly
Guidance and Navigation 12.1% CAGR (2026–2035) AMR fleet management, dynamic path planning
Quality Inspection USD 0.44 Billion (2025) Inline defect detection, dimensional gauging


Material handling leads the Robotic Vision Market applications because warehouse and distribution center operators prioritize throughput speed, and vision-guided grasping systems have proven their reliability at scale. Guidance and navigation is the fastest-growing application, fueled by autonomous mobile robot fleets that use vision sensors for SLAM-based mapping and obstacle detection in dynamic warehouse and hospital environments.

By End-User Industry

Segment Key Metric Primary Demand Driver
Automotive 33% share (2025) Paint inspection, weld-seam verification
Logistics & Warehousing 12.0% CAGR (2026–2035) E-commerce sortation, goods-to-person systems
Electronics & Semiconductor USD 0.46 Billion (2025) Die inspection, wire-bond verification
Agriculture 11.8% CAGR (2026–2035) Harvest robotics, phenotyping
Healthcare USD 0.19 Billion (2025) Surgical robotics, lab automation


The automotive industry is the largest end-user of the Robotic Vision Market, with vision systems embedded across paint shops, body-in-white welding, final assembly, and end-of-line inspection stations. Strict OEM quality mandates — Toyota's zero-defect standard and Volkswagen's digital production strategy — require multi-camera architectures that capture 100% of production units. Logistics and warehousing are the fastest-growing end-user segment, as parcel-volume growth of 12–15% annually forces distribution centers to automate sortation, bin-picking, and last-mile loading.


Regional Market Share Analysis

Region Key Metric Primary Investment Themes
Asia-Pacific 44% share (2025) Factory automation, semiconductor fabs and cobot subsidies
North America 28% share (2025) Reshoring, defense vision systems, logistics automation
Europe 20% share (2025) Machinery Regulation compliance, automotive quality
South America 4% share (2025) Nearshoring, agriculture automation
Middle East & Africa 4% share (2025) Oil & gas inspection, smart-city infrastructure
Total 100%  

The Robotic Vision Market spans all major manufacturing geographies, with investment intensity varying by labor cost, regulatory environment, and industrial maturity.


North America

Country Key Metric Key Driver
United States 72% of regional share CHIPS Act, defense R&D, e-commerce logistics
Canada 15% of regional share Automotive corridor, mining automation
Mexico 13% of the regional share Nearshoring factory construction


The United States anchors the North American Robotic Vision Market through a combination of defense-sector demand, semiconductor fabrication expansion, and rapid e-commerce warehouse automation. The Department of Defense allocated USD 1.8 billion toward autonomous systems R&D in FY 2025, a significant share of which funds vision-enabled unmanned ground and aerial platforms. Mexico's manufacturing corridor is emerging as a secondary growth engine, with over 50 new plants announcing vision-guided production lines since 2023 [25].

Europe

Country Key Metric Key Driver
Germany 11.4% CAGR (2026–2035) Automotive OEM quality mandates
United Kingdom USD 0.14 Billion (2025) Logistics and pharmaceutical inspection
France 9.8% CAGR (2026–2035) Aerospace composite inspection
Italy USD 0.09 Billion (2025) Food and packaging automation
Spain 10.1% CAGR (2026–2035) Renewable-energy component inspection
Nordic Countries USD 0.07 Billion (2025) Forestry and process industries
Russia 8.4% CAGR (2026–2035) Import substitution, domestic production
Rest of Europe USD 0.12 Billion (2025) Mixed industrial demand


Europe's Robotic Vision Market is shaped by the EU Machinery Regulation 2023/1230, which requires autonomous hazard-logging in robotic workcells from January 2027 [4]. Germany remains the regional leader, with its automotive sector alone accounting for more than 35% of European vision-system installations. The United Kingdom's post-Brexit automation incentive — a 130% super-deduction on qualifying plant investments, extended through 2025 — has boosted vision deployments in pharmaceutical and food production.

Asia-Pacific

Country Key Metric Key Driver
China 48% of regional share Made in China 2025, EV battery inspection
Japan USD 0.26 Billion (2025) Labor shortage, precision manufacturing
India 12.6% CAGR (2026–2035) PLI scheme, electronics assembly
South Korea USD 0.18 Billion (2025) Semiconductor and display fabs
ASEAN 12.1% CAGR (2026–2035) Cobot deployment, FDI-driven factory builds
Rest of Asia-Pacific USD 0.06 Billion (2025) Early-stage adoption


Asia-Pacific commands the largest share of the Robotic Vision Market, driven by China's massive manufacturing base and Japan's technology leadership in precision optics. China's Ministry of Industry and Information Technology set a target of 10 robots per 1,000 manufacturing workers by 2025 — more than double the 2020 density — with vision modules required on the majority of new installations [1]. India's Production-Linked Incentive scheme for electronics, valued at INR 760 billion, is spurring greenfield electronics assembly plants that incorporate vision-guided pick-and-place from inception.

South America

Country Key Metric Key Driver
Brazil 58% of regional share Automotive and agribusiness automation
Argentina 9.2% CAGR (2026–2035) Agricultural harvesting robotics
Rest of South America USD 0.03 Billion (2025) Mining and food processing


Brazil's Robotic Vision Market benefits from its dual industrial base in automotive production and agribusiness, with Embrapa reporting a 140% increase in agricultural-robot pilot programs between 2022 and 2024 [23]. Argentina's grain-export sector is piloting vision-guided grain-sorting systems to comply with increasingly stringent EU import quality standards, creating a niche but fast-growing demand pocket.

Middle East & Africa

Country Key Metric Key Driver
Saudi Arabia 10.8% CAGR (2026–2035) Vision 2030 industrial diversification
UAE 36% of the regional share Smart logistics, free-zone manufacturing
South Africa USD 0.02 Billion (2025) Mining and automotive assembly
Egypt 9.4% CAGR (2026–2035) Suez Canal logistics corridor
Rest of MEA USD 0.02 Billion (2025) Oil and gas pipeline inspection


Saudi Arabia's Vision 2030 program and the UAE's Operation 300bn industrial strategy are channeling sovereign investment into advanced manufacturing zones that specify robotic vision as a baseline requirement. The region's oil and gas sector also deploys vision-equipped inspection robots in pipeline and refinery environments where human access is hazardous, providing a specialized but steady demand stream for the Robotic Vision Market.


Robotic Vision Market By Region, 2025-2035

Competitive Benchmarking

The Robotic Vision Market is moderately concentrated, with the top five players estimated to comprise 38-45% of global revenue. The Herfindahl-Hirschman Index is in the range of 900-1,200, indicating a moderately fragmented market, where specialized component vendors are active alongside integrated robotics OEMs. Competition is heating on two fronts: full-stack hardware-software integration and AI-model performance on edge devices.

Company Est. Revenue Share Range Key Offerings for the Robotic Vision Market Strategic Positioning
Cognex Corporation ~8–11% In-Sight vision systems, VisionPro deep learning Broad industrial portfolio, strong channel network
Keyence Corporation ~7–10% CV-X series, AI-powered image inspection Direct-sales model, rapid prototyping support
FANUC Corporation ~5–8% iRVision integrated robot vision Tight robot-vision integration, automotive focus
ABB Ltd. ~4–7% Integrated Vision, PickMaster Twin Digital-twin integration, cobot portfolio
Basler AG ~3–5% ace 2, boost cameras, pylon SDK High-volume camera supplier, open-platform approach
SICK AG ~3–5% InspectorP, Ranger3 3D cameras Sensor fusion, logistics specialty
Omron Corporation ~3–5% FH-series vision, collaborative-robot integration Cobot-vision bundles, Asia-Pacific presence
Teledyne Technologies ~2–4% DALSA cameras, Sapera Vision Software High-end imaging, aerospace and defense
Intel Corporation ~2–4% RealSense depth cameras, OpenVINO toolkit Edge-AI ecosystem, developer community
NVIDIA Corporation ~2–4% Jetson platform, Isaac SDK GPU inference, simulation-driven deployment

Recent News & Developments

  • Cognex Corporation (September 2024): Launched the In-Sight L68 3D laser profiler with 16k resolution for tire and battery cell inspection, expanding its 3D portfolio beyond traditional 2D strengths [Ref: Cognex Press Release, Sep 2024].
  • NVIDIA (March 2024): Released Isaac Manipulator and Isaac Perceptor SDKs to accelerate vision-based robotic manipulation, integrating foundation models for zero-shot object recognition [Ref: NVIDIA GTC 2024 Keynote].
  • ABB Ltd. (January 2024): Acquired Sevensense Robotics, adding visual-SLAM navigation technology to its AMR portfolio and strengthening its Robotic Vision Market position in logistics automation [Ref: ABB Media Release, Nov 2024].
  • Basler AG (April 2025): Introduced the ace 2 X visSWIR camera line for short-wave infrared imaging, targeting food-safety and moisture-detection applications previously served by expensive benchtop spectrometers [Ref: Basler Press Release, Apr 2025].
  • FANUC Corporation (August 2023): Integrated its iRVision 3DV/600 sensor into the CRX collaborative robot series, enabling out-of-box bin-picking without third-party vision hardware [Ref: FANUC Product Announcement, Aug 2023].

Robotic Vision Market Report Scope

Parameter Details
Market Scope Global Robotic Vision Market across technology, component, robot type, application, end-user, and geography
Study Period 2021–2035
Historical Period 2021–2024
Base Year 2025
Forecast Period 2026–2035
CAGR 10.1% (2026–2035)
Market Size (2025) USD 3.42 Billion
Market Size (2035) USD 8.97 Billion
Fastest Growing Segment 3D Vision Systems (by technology); Logistics & Warehousing (by end-user)
Companies Profiled Cognex, Keyence, FANUC, ABB, Basler, SICK, Omron, Teledyne Technologies, Intel, NVIDIA
Valuation Currency USD Billion


FAQs

What is the projected market valuation of the Robotic Vision Market by 2035?

The Robotic Vision Market is projected to reach a valuation of 21.26 USD Billion by 2035.

What was the market valuation of the Robotic Vision Market in 2024?

In 2024, the overall market valuation was 5.662 USD Billion.

What is the expected CAGR for the Robotic Vision Market during the forecast period 2025 - 2035?

The expected CAGR for the Robotic Vision Market during the forecast period 2025 - 2035 is 12.78%.

Which companies are considered key players in the Robotic Vision Market?

Key players in the Robotic Vision Market include Cognex Corporation, Omron Corporation, Basler AG, and Teledyne Technologies Incorporated.

What are the main application segments of the Robotic Vision Market?

The main application segments include Industrial Automation, Agriculture, Healthcare, Logistics, and Mining.

How much is the Industrial Automation segment expected to grow by 2035?

The Industrial Automation segment is expected to grow from 1.5 USD Billion to 5.5 USD Billion by 2035.

What is the projected growth for Machine Vision Cameras in the Robotic Vision Market?

Machine Vision Cameras are projected to grow from 2.0 USD Billion to 8.0 USD Billion by 2035.

What is the expected growth of the Hardware component in the Robotic Vision Market?

The Hardware component is expected to grow from 2.5 USD Billion to 9.5 USD Billion by 2035.

Which end-use segment is anticipated to see the most growth in the Robotic Vision Market?

The Manufacturing end-use segment is anticipated to grow from 2.5 USD Billion to 9.5 USD Billion by 2035.

What is the projected growth for the Healthcare Services segment in the Robotic Vision Market?

The Healthcare Services segment is projected to grow from 1.2 USD Billion to 4.5 USD Billion by 2035.

Author
Author
Author Profile
Aarti Dhapte LinkedIn
AVP - Research
A consulting professional focused on helping businesses navigate complex markets through structured research and strategic insights. I partner with clients to solve high-impact business problems across market entry strategy, competitive intelligence, and opportunity assessment. Over the course of my experience, I have led and contributed to 100+ market research and consulting engagements, delivering insights across multiple industries and geographies, and supporting strategic decisions linked to $500M+ market opportunities. My core expertise lies in building robust market sizing, forecasting, and commercial models (top-down and bottom-up), alongside deep-dive competitive and industry analysis. I have played a key role in shaping go-to-market strategies, investment cases, and growth roadmaps, enabling clients to make confident, data-backed decisions in dynamic markets.
Co-Author
Co-Author Profile
Shubham Munde LinkedIn
Team Lead - Research
Shubham brings over 7 years of expertise in Market Intelligence and Strategic Consulting, with a strong focus on the Automotive, Aerospace, and Defense sectors. Backed by a solid foundation in semiconductors, electronics, and software, he has successfully delivered high-impact syndicated and custom research on a global scale. His core strengths include market sizing, forecasting, competitive intelligence, consumer insights, and supply chain mapping. Widely recognized for developing scalable growth strategies, Shubham empowers clients to navigate complex markets and achieve a lasting competitive edge. Trusted by start-ups and Fortune 500 companies alike, he consistently converts challenges into strategic opportunities that drive sustainable growth.

Research Approach


Secondary Research

The secondary research process involved comprehensive analysis of regulatory databases, technical standards repositories, peer-reviewed engineering journals, industry publications, and authoritative technology organizations. Key sources included the National Institute of Standards and Technology (NIST), Occupational Safety and Health Administration (OSHA), International Organization for Standardization (ISO) technical committees (ISO/TC 299 for robotics), International Electrotechnical Commission (IEC) standards, Robotics Industries Association (RIA/A3 - Association for Advancing Automation), IEEE Robotics and Automation Society, European Machine Vision Association (EMVA), American Society of Mechanical Engineers (ASME), Society of Manufacturing Engineers (SME), National Science Foundation (NSF) Engineering Directorate, EU Horizon Europe Programme databases, Japan Robot Association (JARA) statistics, International Federation of Robotics (IFR) World Robotics reports, US Bureau of Labor Statistics (BLS) manufacturing data, Eurostat industrial production statistics, China Ministry of Industry and Information Technology (MIIT) industrial robot statistics, German Mechanical Engineering Industry Association (VDMA) robotics division, and national industrial automation reports from key markets. These sources were used to collect adoption statistics, safety compliance data, technical standardization trends, manufacturing automation indices, and market landscape analysis for 2D vision systems, 3D vision systems, LIDAR systems, and machine vision cameras across industrial automation, agriculture, healthcare, logistics, and mining applications.


Primary Research

To gather both qualitative and quantitative information, the primary research process involved interviewing players from both the supply and demand sides. CEOs, VPs of engineering, chief technologist, product development heads, and commercial directors from companies that make robotic vision systems, provide sensor technologies, and integrate automation solutions were on the supply side. Manufacturing facility, agricultural, healthcare institution, logistics center, and mining operation procurement leads were among the demand-side sources, along with directors of quality control, engineers specializing in robotics, managers of plant automation, coordinators of agricultural technology, and integrators of healthcare systems. Market segmentation, technology roadmap timelines, system integration patterns, pricing tactics, and return on investment dynamics were all uncovered through primary research.

Primary Respondent Breakdown:

By Designation: C-level Primaries (32%), Director Level (30%), Others (38%)

By Region: North America (38%), Europe (30%), Asia-Pacific (25%), Rest of World (7%)


Market Size Estimation

Global market valuation was derived through revenue mapping and system deployment volume analysis. The methodology included:

Identification of 50+ key manufacturers across North America, Europe, Asia-Pacific, and Latin America

Product mapping across 2D vision systems, 3D vision systems, LIDAR systems, and machine vision cameras

Component-level analysis covering hardware (cameras, sensors, processors), software (image processing, AI algorithms), and services (integration, maintenance)

Analysis of reported and modeled annual revenues specific to robotic vision portfolios

Coverage of manufacturers representing 70-75% of global market share in 2024

Extrapolation using bottom-up (system deployment volume × ASP by application and region) and top-down (manufacturer revenue validation) approaches to derive segment-specific valuations across industrial automation, agriculture, healthcare, logistics, and mining verticals

Download Free Sample

Kindly complete the form below to receive a free sample of this Report

Download PDF ×

We do not share your information with anyone. However, we may send you emails based on your report interest from time to time. You may contact us at any time to opt-out.

















