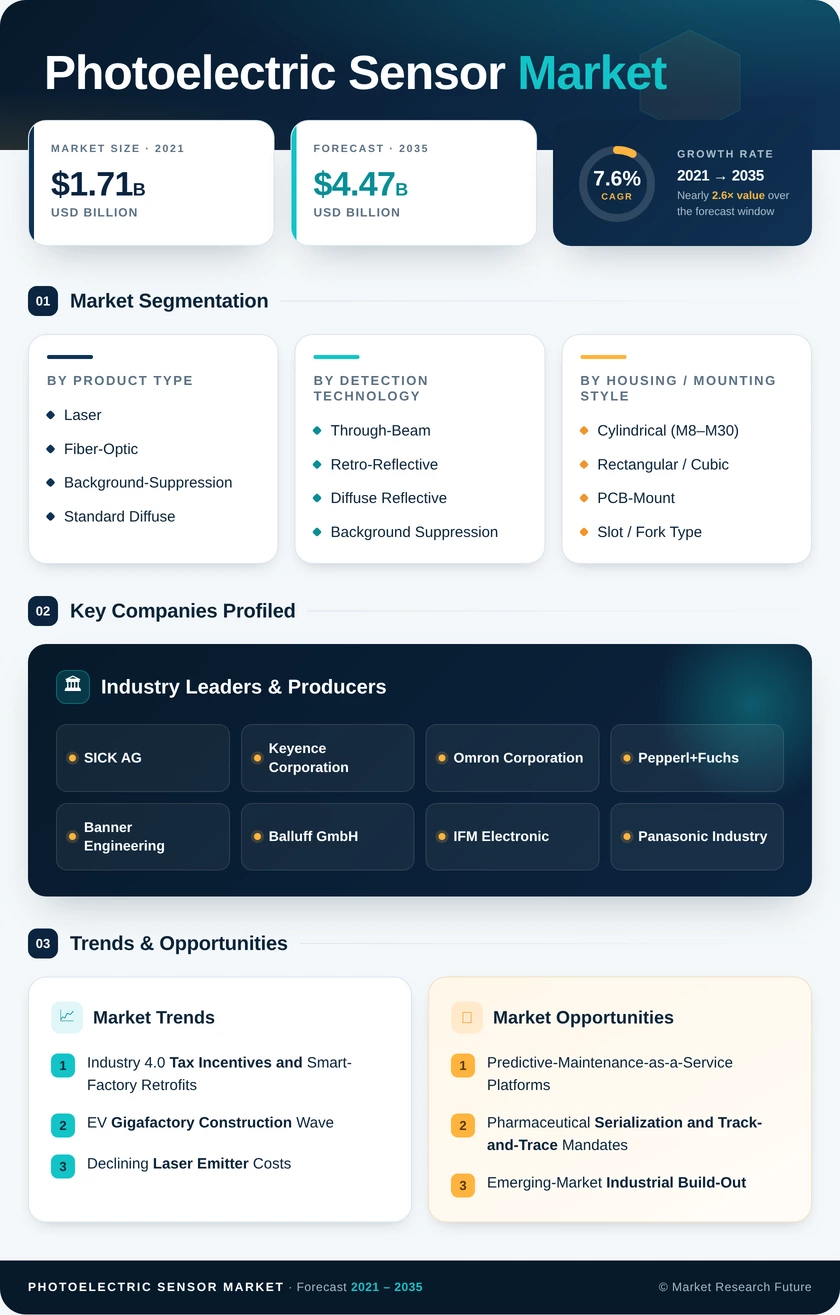
Photoelectric Sensor Market (2026 - 2035)

ID: MRFR/SEM/6696-HCR
111 Pages
Kiran Jinkalwad
Last Updated: June 26, 2026
Photoelectric Sensor Market Size, Share and Research Report By Type (Thrubeam, Retroreflective, Diffuse Reflective, Focused Beam Reflective, Small Spot Definite Reflective, Fixed Distance, and Others), By Beam Source (Laser Beam Source, Infrared (IR) Beam Source, and LED Beam Source), By Industry (Consumer Electronics, Manufacturing, Automotive & Transportation, Food & Beverage, Healthcare, Power & Utilities and others) And By Region (North America, Europe, Asia-Pacific and Rest Of The World)– Industry Size, Share and Trends 2032
Photoelectric Sensor Market
Market Size
Forecast Period2026-2035
CAGR (2026-2035)7.6%
2025 Market SizeUSD 2.15 Billion
2035 Market SizeUSD 4.47 Billion
Key Players
SICK AG
Keyence Corporation
Omron Corporation
Pepperl+Fuchs
Banner Engineering
Balluff GmbH
Opportunities
  • Predictive-Maintenance-as-a-Service Platforms
  • Pharmaceutical Serialization and Track-and-Trace Mandates
  • Emerging-Market Industrial Build-Out
  1. 1 Market Overview |
    1. 1.1 Study Assumptions & Market Definition |
    2. 1.2 Scope of the Study |
    3. 1.3 Research Methodology
  2. 2 Market Summary & Key Takeaways
  3. 3 Market Dynamics |
    1. 3.1 Market Drivers Analysis | |
      1. 3.1.1 Industry
    2. 4.0 Tax Incentives and Smart-Factory Retrofits | |
      1. 3.1.2 EV Gigafactory Construction Wave | |
      2. 3.1.3 Declining Laser Emitter Costs | |
      3. 3.1.4 AI-Enabled Self-Calibration and Predictive Maintenance | |
      4. 3.1.5 Pharmaceutical and Food-Safety Regulatory Tightening | |
      5. 3.1.6 Warehouse and Intralogistics Automation Expansion | |
      6. 3.1.7 Vision 2030 and MEA Industrial Diversification Programs |
    3. 3.2 Market Restraints Analysis | |
      1. 3.2.1 Electromagnetic Interference in Dense Industrial Environments | |
      2. 3.2.2 Machine-Vision and Lidar Substitution Pressure | |
      3. 3.2.3 Skilled Labor Shortages for Sensor Integration | |
      4. 3.2.4 Raw-Material and Semiconductor Supply-Chain Volatility | |
      5. 3.2.5 Standardization Fragmentation Across Emerging Markets |
    4. 3.3 Market Opportunity Analysis | |
      1. 3.3.1 Predictive-Maintenance-as-a-Service Platforms | |
      2. 3.3.2 Pharmaceutical Serialization and Track-and-Trace Mandates | |
      3. 3.3.3 Emerging-Market Industrial Build-Out | |
      4. 3.3.4 Collaborative Robot Sensor Integration | |
      5. 3.3.5 Miniaturized IoT Sensor Nodes for Smart Buildings |
    5. 3.4 Industry Value Chain Analysis |
    6. 3.5 Porter's Five Forces Analysis
  4. 4 Global Photoelectric Sensor Market Size & Forecast (2021–2035) |
    1. 4.1 Historical Market Size (2021–2025) |
    2. 4.2 Current & Forecast Market Size (2026–2035) |
    3. 4.3 Market Size by Revenue (USD Billion) |
    4. 4.4 Year-over-Year Growth Analysis
  5. 5 Segmentation Analysis |
    1. 5.1 By Product Type | |
      1. 5.1.1 Laser Sensors | |
      2. 5.1.2 Fiber-Optic Sensors | |
      3. 5.1.3 Background-Suppression Sensors | |
      4. 5.1.4 Standard Diffuse Sensors |
    2. 5.2 By Detection Technology | |
      1. 5.2.1 Through-Beam | |
      2. 5.2.2 Retro-Reflective | |
      3. 5.2.3 Diffuse Reflective | |
      4. 5.2.4 Background Suppression |
    3. 5.3 By Housing / Mounting Style | |
      1. 5.3.1 Cylindrical (M8–M30) | |
      2. 5.3.2 Rectangular / Cubic | |
      3. 5.3.3 PCB-Mount | |
      4. 5.3.4 Slot / Fork Type |
    4. 5.4 By End-User Industry | |
      1. 5.4.1 Automotive & E-Mobility | |
      2. 5.4.2 Consumer Electronics | |
      3. 5.4.3 Pharmaceuticals & Medical Devices | |
      4. 5.4.4 Food & Beverage | |
      5. 5.4.5 Logistics & Warehousing
  6. 6 Regional Analysis |
    1. 6.1 North America | |
      1. 6.1.1 United States | |
      2. 6.1.2 Canada | |
      3. 6.1.3 Mexico |
    2. 6.2 Europe | |
      1. 6.2.1 Germany | |
      2. 6.2.2 United Kingdom | |
      3. 6.2.3 France | |
      4. 6.2.4 Italy | |
      5. 6.2.5 Spain | |
      6. 6.2.6 Nordic Countries | |
      7. 6.2.7 Russia | |
      8. 6.2.8 Rest of Europe |
    3. 6.3 Asia-Pacific | |
      1. 6.3.1 China | |
      2. 6.3.2 India | |
      3. 6.3.3 Japan | |
      4. 6.3.4 South Korea | |
      5. 6.3.5 ASEAN | |
      6. 6.3.6 Rest of Asia-Pacific |
    4. 6.4 South America | |
      1. 6.4.1 Brazil | |
      2. 6.4.2 Argentina | |
      3. 6.4.3 Rest of South America |
    5. 6.5 Middle East & Africa | |
      1. 6.5.1 Saudi Arabia | |
      2. 6.5.2 UAE | |
      3. 6.5.3 South Africa | |
      4. 6.5.4 Egypt | |
      5. 6.5.5 Rest of MEA
  7. 7 Competitive Landscape |
    1. 7.1 Market Share Analysis (2025) |
    2. 7.2 Competitive Benchmarking Matrix |
    3. 7.3 Company Profiles | |
      1. 7.3.1 SICK AG | |
      2. 7.3.2 Keyence Corporation | |
      3. 7.3.3 Omron Corporation | |
      4. 7.3.4 Pepperl+Fuchs | |
      5. 7.3.5 Banner Engineering | |
      6. 7.3.6 Balluff GmbH | |
      7. 7.3.7 IFM Electronic | |
      8. 7.3.8 Panasonic Industry | |
      9. 7.3.9 Autonics Corporation | |
      10. 7.3.10 Leuze Electronic
  8. 8 Future Outlook & Strategic Recommendations (2026–2035) |
    1. 8.1 Edge-AI and Autonomous Sensor Networks |
    2. 8.2 Platform Economics and Sensor-as-a-Service |
    3. 8.3 Electrification and Clean-Energy Manufacturing |
    4. 8.4 ESG Reporting and Digital Traceability
  9. 9 Recent Developments & News
  10. 10 Frequently Asked Questions (FAQs)
  11. 11 Report Scope & Methodology |
    1. 11.1 Study Period & Base Year |
    2. 11.2 Data Sources & Citations |
    3. 11.3 Abbreviations
  12. 12 LIST OF TABLES |
  13. TABLE 1 Global Photoelectric Sensor Market Size & Forecast, by Revenue (USD Billion), 2021–2035 |
  14. TABLE 2 Global Photoelectric Sensor Market – Year-over-Year Growth Analysis, 2021–2035 |
  15. TABLE 3 Global Photoelectric Sensor Market – Driver Impact Analysis |
  16. TABLE 4 Global Photoelectric Sensor Market – Restraint Impact Analysis |
  17. TABLE 5 Global Photoelectric Sensor Market Size, by Product Type, 2021–2035 (USD Billion) |
  18. TABLE 6 Global Photoelectric Sensor Market Size, by Detection Technology, 2021–2035 (USD Billion) |
  19. TABLE 7 Global Photoelectric Sensor Market Size, by Housing / Mounting Style, 2021–2035 (USD Billion) |
  20. TABLE 8 Global Photoelectric Sensor Market Size, by End-User Industry, 2021–2035 (USD Billion) |
  21. TABLE 9 Global Photoelectric Sensor Market Size, by Region, 2021–2035 (USD Billion) |
  22. TABLE 10 North America Photoelectric Sensor Market Size, by Country, 2021–2035 (USD Billion) |
  23. TABLE 11 Europe Photoelectric Sensor Market Size, by Country, 2021–2035 (USD Billion) |
  24. TABLE 12 Asia-Pacific Photoelectric Sensor Market Size, by Country, 2021–2035 (USD Billion) |
  25. TABLE 13 South America Photoelectric Sensor Market Size, by Country, 2021–2035 (USD Billion) |
  26. TABLE 14 Middle East & Africa Photoelectric Sensor Market Size, by Country, 2021–2035 (USD Billion) |
  27. TABLE 15 Competitive Benchmarking Matrix – Global Photoelectric Sensor Market, 2025 |
  28. TABLE 16 Company Profiles – Key Players, Global Photoelectric Sensor Market |
  29. TABLE 17 Recent Developments & Strategic Announcements, 2023–2025 |
  30. TABLE 18 Report Scope and Methodology Summary |
  31. TABLE 19 Detailed Sources and Citations
  32. 13 LIST OF FIGURES |
  33. FIGURE 1 Global Photoelectric Sensor Market Dynamics Overview |
  34. FIGURE 2 Industry Value Chain Analysis — Photoelectric Sensor Market |
  35. FIGURE 3 Porter's Five Forces Analysis — Photoelectric Sensor Market |
  36. FIGURE 4 Global Photoelectric Sensor Market Size Trend (USD Billion), 2021–2035 |
  37. FIGURE 5 Global Photoelectric Sensor Market Share, by Product Type, 2025 |
  38. FIGURE 6 Global Photoelectric Sensor Market Share, by Detection Technology, 2025 |
  39. FIGURE 7 Global Photoelectric Sensor Market Share, by Housing / Mounting Style, 2025 |
  40. FIGURE 8 Global Photoelectric Sensor Market Share, by End-User Industry, 2025 |
  41. FIGURE 9 Global Photoelectric Sensor Market Share, by Region, 2025 |
  42. FIGURE 10 North America Photoelectric Sensor Market Share, by Country, 2025 |
  43. FIGURE 11 Europe Photoelectric Sensor Market Share, by Country, 2025 |
  44. FIGURE 12 Asia-Pacific Photoelectric Sensor Market Share, by Country, 2025 |
  45. FIGURE 13 South America Photoelectric Sensor Market Share, by Country, 2025 |
  46. FIGURE 14 Middle East & Africa Photoelectric Sensor Market Share, by Country, 2025 |
  47. FIGURE 15 Competitive Landscape — Revenue Share Analysis, 2025

Segmentation Quick Reference

DimensionSub-SegmentsDominant Segment (2025)Fastest Growing Segment (2026–2035)
Product TypeLaser, Fiber-Optic, Background-Suppression, Standard DiffuseLaser SensorsBackground-Suppression Sensors
Detection TechnologyThrough-Beam, Retro-Reflective, Diffuse Reflective, Background SuppressionThrough-BeamBackground Suppression
Housing / Mounting StyleCylindrical (M8–M30), Rectangular / Cubic, PCB-Mount, Slot / Fork TypeCylindrical (M8–M30)PCB-Mount
End-User IndustryAutomotive & E-Mobility, Consumer Electronics, Pharmaceuticals & Photoelectric Sensor Markets, Food & Beverage, Logistics & WarehousingAutomotive & E-MobilityPharmaceuticals & Photoelectric Sensor Markets
RegionNorth America, Europe, Asia-Pacific, South America, Middle East & AfricaAsia-PacificMiddle East & Africa


Market Segmentation Overview

By Product Type

Sub-SegmentKey Trend
Laser SensorsVCSEL cost reductions expand addressable applications beyond premium automotive
Fiber-Optic SensorsSemiconductor and clean-room environments drive specialized demand
Background-Suppression SensorsMixed-product packaging lines adopt variable-range detection
Standard Diffuse SensorsCost-sensitive general presence detection in light-duty automation


Laser sensors continue to anchor the product-type landscape with superior range and precision, while background-suppression variants are closing the growth gap through their ability to handle variable target reflectivity — a capability increasingly demanded by e-commerce fulfillment and mixed-SKU packaging operations.

By Detection Technology

Sub-SegmentKey Trend
Through-BeamDominant in conveyor and palletizing systems requiring maximum reliability
Retro-ReflectiveSingle-side mounting reduces wiring complexity and installation cost
Diffuse ReflectiveCompact form factor suits space-constrained machine enclosures
Background SuppressionGrowing rapidly for selective target detection in complex environments


Through-beam remains the technology of choice for high-reliability material-handling applications, while diffuse and background-suppression modes are expanding into applications where installation simplicity and surface-agnostic detection outweigh pure sensing range requirements.

By Housing / Mounting Style

Sub-SegmentKey Trend
Cylindrical (M8–M30)Universal thread standard ensures backward compatibility across legacy mounts
Rectangular / CubicPreferred for flush flat-surface integration in machine frames
PCB-MountOEM integration trend in consumer electronics and medical-device manufacturing
Slot / Fork TypeNiche but essential for label detection and web-edge control in printing


Cylindrical housings benefit from decades of installed-base compatibility, while PCB-mount formats are growing fastest as device miniaturization pushes sensor integration directly onto printed circuit boards in OEM product designs.

By End-User Industry

Sub-SegmentKey Trend
Automotive & E-MobilityEV gigafactories demand dense sensor arrays for battery and body assembly
Consumer ElectronicsSurface-mount technology lines require ultra-compact object detection
Pharmaceuticals & Photoelectric Sensor MarketsSerialization mandates drive rapid sensor-density increases
Food & BeverageHygiene-rated and washdown-resistant housings command premium pricing
Logistics & WarehousingAutomated sortation and AMR fleet expansion fuel new sensor installations


Automotive remains the largest end-user vertical by revenue, with EV production scaling rapidly across all major geographies. Pharmaceuticals are positioned to grow fastest as regulatory serialization deadlines convert sensor upgrades from discretionary to mandatory across the global drug supply chain.


 

Download PDF ×

We do not share your information with anyone. However, we may send you emails based on your report interest from time to time. You may contact us at any time to opt-out.