Segmentation Quick Reference
| Dimension | Sub-Segments | Dominant Segment | Fastest Growing Segment |
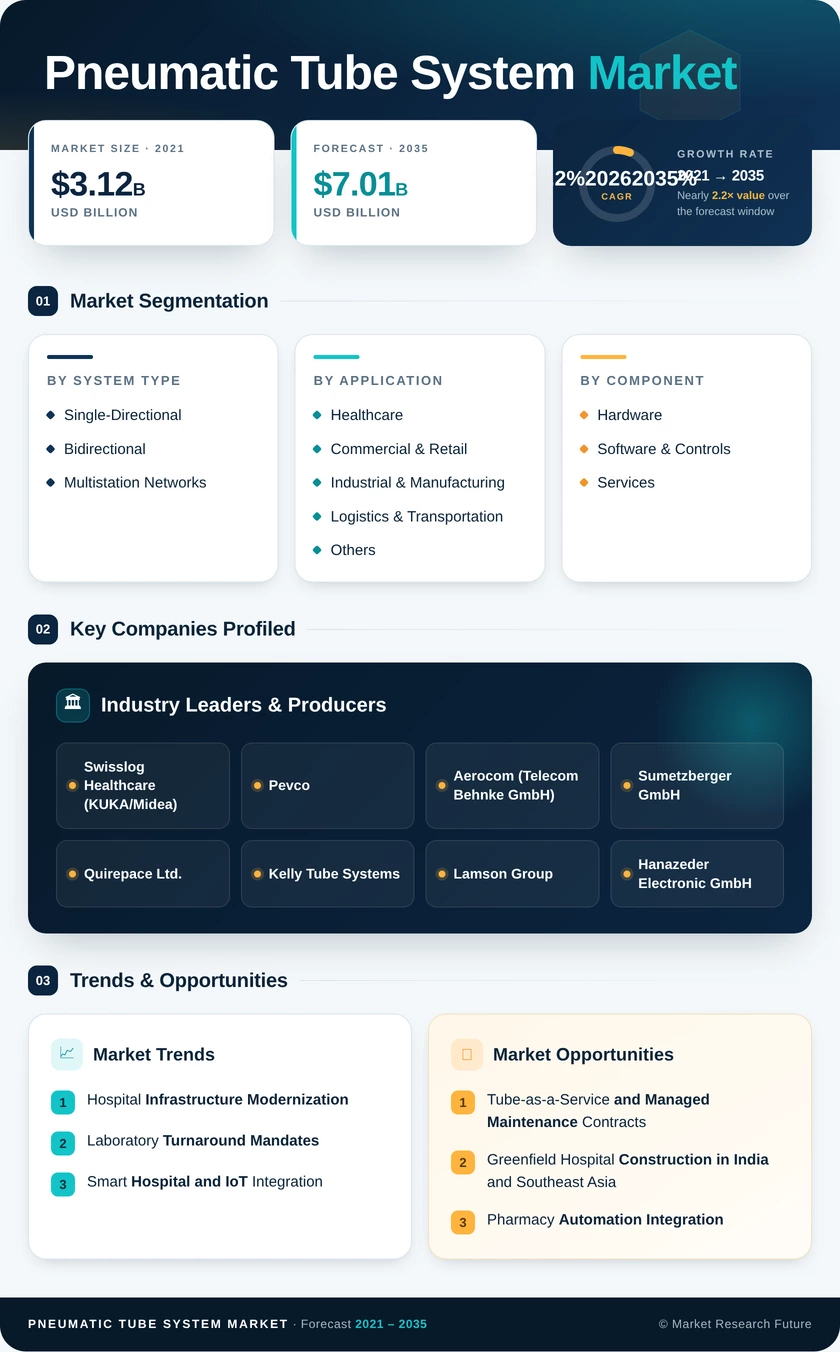
| By System Type | Single-Directional; Bidirectional; Multistation Networks | Bidirectional Systems (~48%) | Multistation Networks (7.4% CAGR) |
| By Application | Pneumatic Tube System Market; Commercial & Retail; Industrial & Manufacturing; Logistics & Transportation; Others | Pneumatic Tube System Market (~45%) | Logistics & Transportation (7.1% CAGR) |
| By Component | Hardware; Software & Controls; Services | Hardware (~62%) | Software & Controls (8.1% CAGR) |
Market Segmentation Overview
By System Type
| Sub-Segment | Key Trend |
| Single-Directional Systems | Dominant in small clinics and retail cash-handling; stable but low-growth |
| Bidirectional Systems | Standard specification in new hospital construction enables two-way carrier routing. |
| Multistation Networks | Fastest adoption in campus hospitals and airport facilities; requires centralized blower architecture. |
Bidirectional systems account for the largest share of installations because modern healthcare facilities need flexible routing across multiple floors and departments. Multistation networks are growing fastest as hospital campuses expand outward and connect previously isolated buildings onto unified logistics grids.
By Application
| Sub-Segment | Key Trend |
| Pneumatic Tube System Market | Specimen transport and medication delivery remain the primary use case globally. |
| Commercial & Retail | Cash-handling and document transfer in banks, drive-throughs, and retail chains |
| Industrial & Manufacturing | Clean-room sample transport in pharmaceutical and semiconductor manufacturing |
| Logistics & Transportation | Airport customs-document transfer and warehouse small-parcel routing |
| Others | Government secure-mail systems and banking vault transfers |
Pneumatic Tube System Market dominates because regulatory mandates around specimen transit times and infection control make pneumatic tube systems an operational necessity rather than a convenience. The logistics and transportation segment is expanding as non-healthcare operators recognize the speed and security advantages for small-payload movement.
By Component
| Sub-Segment | Key Trend |
| Hardware | Tubes, carriers, blowers, diverters, and station enclosures form the largest revenue pool. |
| Software & Controls | Real-time tracking, AI-based routing, and EHR integration drive the highest growth rates. |
| Services | Managed maintenance, 24/7 remote monitoring, and lifecycle replacement contracts |
Hardware revenue dominates new installations, but software and controls are the fastest-growing components as hospitals demand interoperability with electronic health records and centralized building-management systems. Managed services are emerging as a strategic revenue stream, with multi-year contracts that lock in recurring income for vendors and predictable cost profiles for hospital operators.