Predictive Maintenance Market

ID: MRFR/ICT/1754-CR
154 Pages
Aarti Dhapte
Last Updated: June 17, 2026
Predictive Maintenance Market Size, Share and Research Report By Component (Hardware, Software, Services), By Deployment Mode (Cloud, On-Premise), By Enterprise Size (Large Enterprises, Small and Medium Enterprises), By End-User Industry (Industrial Manufacturing, Automotive & Transportation, Energy and Utilities, Healthcare, Others (Aerospace, Mining, Telecom)) - Industry Forecast to 2035
Download PDF ×

We do not share your information with anyone. However, we may send you emails based on your report interest from time to time. You may contact us at any time to opt-out.

  1. 1 Market Overview |
    1. 1.1 Study Assumptions & Market Definition |
    2. 1.2 Scope of the Study |
    3. 1.3 Research Methodology
  2. 2 Market Summary & Key Takeaways
  3. 3 Market Dynamics |
    1. 3.1 Market Drivers Analysis | |
      1. 3.1.1 AI/ML Model Maturation for Machine Failure Prediction | |
      2. 3.1.2 Sensor Cost Deflation and IIoT Proliferation | |
      3. 3.1.3 Cloud Scalability & Hybrid-Edge Deployment | |
      4. 3.1.4 Regulatory and Safety Mandates | |
      5. 3.1.5 Energy Transition and Grid Modernization | |
      6. 3.1.6 Supply-Chain Resilience Investments | |
      7. 3.1.7 Digital-Twin Convergence |
    2. 3.2 Market Restraints Analysis | |
      1. 3.2.1 Legacy System Integration Complexity | |
      2. 3.2.2 Data Quality and Labeling Challenges | |
      3. 3.2.3 Semiconductor and Hardware Cost Inflation | |
      4. 3.2.4 Cybersecurity and Data-Privacy Concerns | |
      5. 3.2.5 Skilled-Workforce Shortage in IIoT Analytics |
    3. 3.3 Market Opportunity Analysis | |
      1. 3.3.1 Predictive-Maintenance-as-a-Service (PMaaS) | |
      2. 3.3.2 Emerging-Market Industrialization | |
      3. 3.3.3 Digital-Twin Convergence | |
      4. 3.3.4 ESG Reporting and Carbon-Aware Maintenance | |
      5. 3.3.5 Data Monetization and Benchmarking Platforms |
    4. 3.4 Industry Value Chain Analysis |
    5. 3.5 Porter's Five Forces Analysis
  4. 4 Global Predictive Maintenance Market Size & Forecast (2021–2035) |
    1. 4.1 Historical Market Size (2021–2025) |
    2. 4.2 Current & Forecast Market Size (2026–2035) |
    3. 4.3 Market Size by Revenue (USD Billion) |
    4. 4.4 Year-over-Year Growth Analysis
  5. 5 Segmentation Analysis |
    1. 5.1 By Component | |
      1. 5.1.1 Hardware | |
      2. 5.1.2 Software | |
      3. 5.1.3 Services |
    2. 5.2 By Deployment Mode | |
      1. 5.2.1 Cloud | |
      2. 5.2.2 On-Premise |
    3. 5.3 By Enterprise Size | |
      1. 5.3.1 Large Enterprises | |
      2. 5.3.2 Small and Medium Enterprises |
    4. 5.4 By End-User Industry | |
      1. 5.4.1 Industrial Manufacturing | |
      2. 5.4.2 Automotive & Transportation | |
      3. 5.4.3 Energy and Utilities | |
      4. 5.4.4 Healthcare | |
      5. 5.4.5 Others (Aerospace, Mining, Telecom)
  6. 6 Regional Analysis |
    1. 6.1 North America | |
      1. 6.1.1 United States | |
      2. 6.1.2 Canada | |
      3. 6.1.3 Mexico |
    2. 6.2 Europe | |
      1. 6.2.1 Germany | |
      2. 6.2.2 United Kingdom | |
      3. 6.2.3 France | |
      4. 6.2.4 Italy | |
      5. 6.2.5 Spain | |
      6. 6.2.6 Nordic Countries | |
      7. 6.2.7 Russia | |
      8. 6.2.8 Rest of Europe |
    3. 6.3 Asia-Pacific | |
      1. 6.3.1 China | |
      2. 6.3.2 India | |
      3. 6.3.3 Japan | |
      4. 6.3.4 South Korea | |
      5. 6.3.5 ASEAN | |
      6. 6.3.6 Rest of Asia-Pacific |
    4. 6.4 South America | |
      1. 6.4.1 Brazil | |
      2. 6.4.2 Argentina | |
      3. 6.4.3 Rest of South America |
    5. 6.5 Middle East & Africa | |
      1. 6.5.1 Saudi Arabia | |
      2. 6.5.2 UAE | |
      3. 6.5.3 South Africa | |
      4. 6.5.4 Egypt | |
      5. 6.5.5 Rest of MEA
  7. 7 Competitive Landscape |
    1. 7.1 Market Share Analysis (2025) |
    2. 7.2 Competitive Benchmarking Matrix |
    3. 7.3 Company Profiles | |
      1. 7.3.1 IBM | |
      2. 7.3.2 Microsoft | |
      3. 7.3.3 Siemens | |
      4. 7.3.4 GE Vernova | |
      5. 7.3.5 SAP | |
      6. 7.3.6 Honeywell | |
      7. 7.3.7 ABB | |
      8. 7.3.8 Schneider Electric | |
      9. 7.3.9 PTC | |
      10. 7.3.10 Rockwell Automation
  8. 8 Future Outlook & Strategic Recommendations (2026–2035) |
    1. 8.1 Autonomous Maintenance Operations |
    2. 8.2 Platform Economics and Ecosystem Consolidation |
    3. 8.3 Electrification and Renewable-Asset Servicing |
    4. 8.4 ESG-Linked Maintenance and Sustainability Reporting
  9. 9 Recent Developments & News
  10. 10 Frequently Asked Questions (FAQs)
  11. 11 Report Scope & Methodology |
    1. 11.1 Study Period & Base Year |
    2. 11.2 Data Sources & Citations |
    3. 11.3 Abbreviations
  12. 12 LIST OF TABLES |
  13. TABLE 1 Global Predictive Maintenance Market Size & Forecast, by Revenue (USD Billion), 2021–2035 |
  14. TABLE 2 Global Predictive Maintenance Market — Year-over-Year Growth Analysis, 2021–2035 |
  15. TABLE 3 Market Driver Impact Analysis, 2026–2035 |
  16. TABLE 4 Market Restraint Impact Analysis, 2026–2035 |
  17. TABLE 5 Global Predictive Maintenance Market Size, by Component, 2021–2035 (USD Billion) |
  18. TABLE 6 Global Predictive Maintenance Market Size, by Deployment Mode, 2021–2035 (USD Billion) |
  19. TABLE 7 Global Predictive Maintenance Market Size, by Enterprise Size, 2021–2035 (USD Billion) |
  20. TABLE 8 Global Predictive Maintenance Market Size, by End-User Industry, 2021–2035 (USD Billion) |
  21. TABLE 9 Global Predictive Maintenance Market Size, by Region, 2021–2035 (USD Billion) |
  22. TABLE 10 North America Predictive Maintenance Market Size, by Country, 2021–2035 (USD Billion) |
  23. TABLE 11 Europe Predictive Maintenance Market Size, by Country, 2021–2035 (USD Billion) |
  24. TABLE 12 Asia-Pacific Predictive Maintenance Market Size, by Country, 2021–2035 (USD Billion) |
  25. TABLE 13 South America Predictive Maintenance Market Size, by Country, 2021–2035 (USD Billion) |
  26. TABLE 14 Middle East & Africa Predictive Maintenance Market Size, by Country, 2021–2035 (USD Billion) |
  27. TABLE 15 Competitive Benchmarking Matrix — Global Predictive Maintenance Market, 2025 |
  28. TABLE 16 Company Profiles — Key Players, Global Predictive Maintenance Market |
  29. TABLE 17 Recent Developments & Strategic Announcements, 2024–2025 |
  30. TABLE 18 North America Predictive Maintenance Market Size, by Component, 2021–2035 (USD Billion) |
  31. TABLE 19 North America Predictive Maintenance Market Size, by Deployment Mode, 2021–2035 (USD Billion) |
  32. TABLE 20 North America Predictive Maintenance Market Size, by Enterprise Size, 2021–2035 (USD Billion) |
  33. TABLE 21 North America Predictive Maintenance Market Size, by End-User Industry, 2021–2035 (USD Billion) |
  34. TABLE 22 Europe Predictive Maintenance Market Size, by Component, 2021–2035 (USD Billion) |
  35. TABLE 23 Europe Predictive Maintenance Market Size, by Deployment Mode, 2021–2035 (USD Billion) |
  36. TABLE 24 Europe Predictive Maintenance Market Size, by Enterprise Size, 2021–2035 (USD Billion) |
  37. TABLE 25 Europe Predictive Maintenance Market Size, by End-User Industry, 2021–2035 (USD Billion) |
  38. TABLE 26 Asia-Pacific Predictive Maintenance Market Size, by Component, 2021–2035 (USD Billion) |
  39. TABLE 27 Asia-Pacific Predictive Maintenance Market Size, by Deployment Mode, 2021–2035 (USD Billion) |
  40. TABLE 28 Asia-Pacific Predictive Maintenance Market Size, by Enterprise Size, 2021–2035 (USD Billion) |
  41. TABLE 29 Asia-Pacific Predictive Maintenance Market Size, by End-User Industry, 2021–2035 (USD Billion) |
  42. TABLE 30 South America Predictive Maintenance Market Size, by Component, 2021–2035 (USD Billion) |
  43. TABLE 31 South America Predictive Maintenance Market Size, by Deployment Mode, 2021–2035 (USD Billion) |
  44. TABLE 32 South America Predictive Maintenance Market Size, by Enterprise Size, 2021–2035 (USD Billion) |
  45. TABLE 33 South America Predictive Maintenance Market Size, by End-User Industry, 2021–2035 (USD Billion) |
  46. TABLE 34 Middle East & Africa Predictive Maintenance Market Size, by Component, 2021–2035 (USD Billion) |
  47. TABLE 35 Middle East & Africa Predictive Maintenance Market Size, by Deployment Mode, 2021–2035 (USD Billion) |
  48. TABLE 36 Middle East & Africa Predictive Maintenance Market Size, by Enterprise Size, 2021–2035 (USD Billion) |
  49. TABLE 37 Middle East & Africa Predictive Maintenance Market Size, by End-User Industry, 2021–2035 (USD Billion) |
  50. TABLE 38 Report Scope & Methodology Summary |
  51. TABLE 39 Detailed Sources and Citations
  52. 13 LIST OF FIGURES |
  53. FIGURE 1 Global Predictive Maintenance Market Dynamics — Drivers, Restraints, and Opportunities |
  54. FIGURE 2 Industry Value Chain Analysis — Predictive Maintenance Market |
  55. FIGURE 3 Porter's Five Forces Analysis — Predictive Maintenance Market |
  56. FIGURE 4 Global Predictive Maintenance Market Size Trend & Forecast (USD Billion), 2021–2035 |
  57. FIGURE 5 Global Predictive Maintenance Market Share, by Component (%), 2025 |
  58. FIGURE 6 Global Predictive Maintenance Market Share, by Deployment Mode (%), 2025 |
  59. FIGURE 7 Global Predictive Maintenance Market Share, by Enterprise Size (%), 2025 |
  60. FIGURE 8 Global Predictive Maintenance Market Share, by End-User Industry (%), 2025 |
  61. FIGURE 9 Global Predictive Maintenance Market Share, by Region (%), 2025 |
  62. FIGURE 10 North America Predictive Maintenance Market Share, by Country (%), 2025 |
  63. FIGURE 11 Europe Predictive Maintenance Market Share, by Country (%), 2025 |
  64. FIGURE 12 Asia-Pacific Predictive Maintenance Market Share, by Country (%), 2025 |
  65. FIGURE 13 South America Predictive Maintenance Market Share, by Country (%), 2025 |
  66. FIGURE 14 Middle East & Africa Predictive Maintenance Market Share, by Country (%), 2025 |
  67. FIGURE 15 Competitive Landscape — Market Share Analysis, Predictive Maintenance Market, 2025

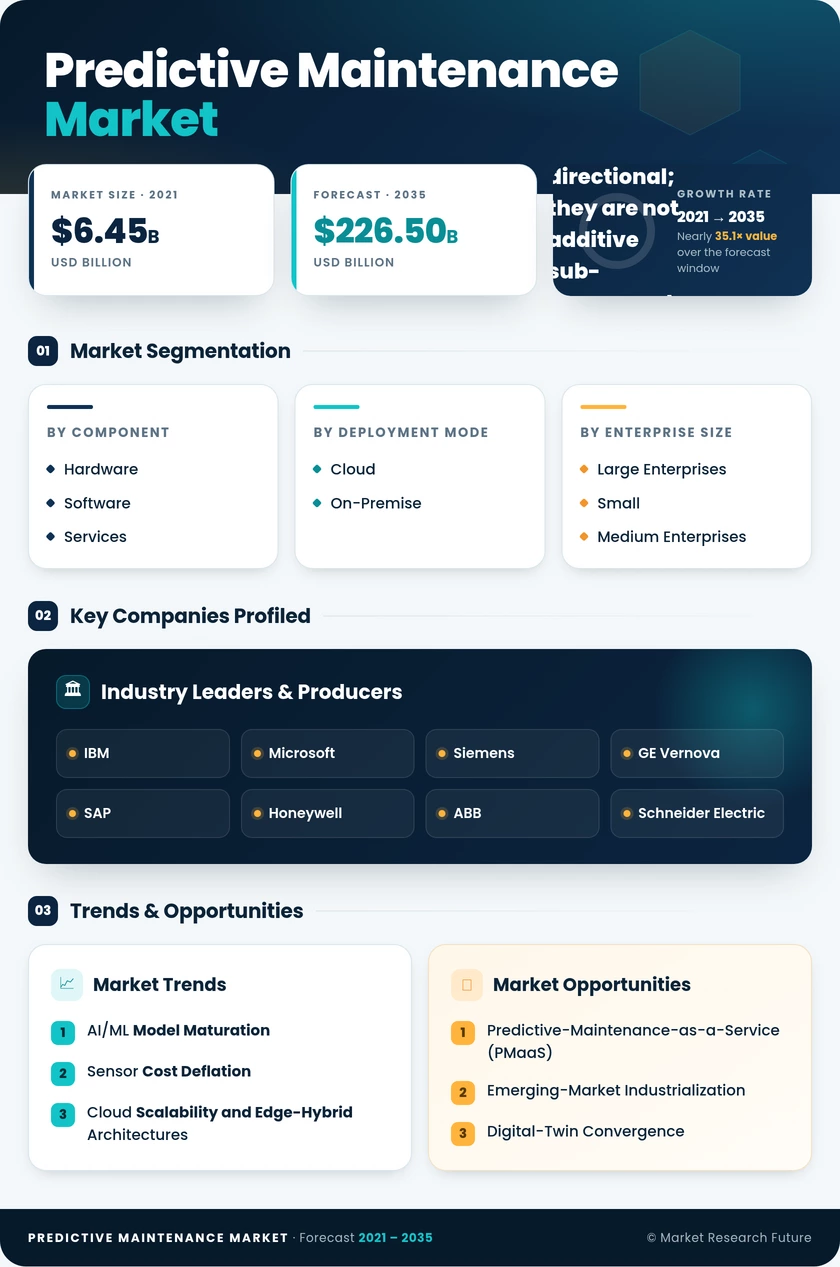
Segmentation Quick Reference

DimensionSub-SegmentsDominant SegmentFastest Growing Segment
ComponentHardware, Software, ServicesHardware (48.5% share, 2025)Software (38.4% CAGR)
Deployment ModeCloud, On-PremiseCloud (61.5% share, 2025)On-Premise (33.8% CAGR)
Enterprise SizeLarge Enterprises, Small and Medium EnterprisesLarge Enterprises (68.2% share, 2025)Small and Medium Enterprises (33.2% CAGR)
End-User IndustryIndustrial Manufacturing, Automotive & Transportation, Energy and Utilities, Healthcare, OthersIndustrial Manufacturing (24.8% share, 2025)Energy and Utilities (37.2% CAGR)
RegionNorth America, Europe, Asia-Pacific, South America, Middle East & AfricaNorth America (31.2% share, 2025)Asia-Pacific (32.7% CAGR)


Market Segmentation Overview

By Component

Sub-SegmentKey Trend
HardwareMEMS sensor commoditization enabling brownfield retrofits at sub-USD 5 per node
SoftwareAI-driven analytics platforms shifting to SaaS subscription pricing
ServicesPMaaS and managed-services contracts growing as enterprises outsource maintenance operations


Hardware spending is driven by edge-gateway and sensor-node deployments across both greenfield and retrofit installations. Software is transitioning from on-premise licenses to cloud-native subscriptions, while services increasingly encompass end-to-end managed maintenance operations.

By Deployment Mode

Sub-SegmentKey Trend
CloudMulti-tenant platforms offering pay-per-asset scalability and centralized dashboards
On-PremiseData-sovereignty requirements in defense, nuclear, and critical infrastructure driving on-site deployments


Cloud platforms dominate because they lower capital barriers and support remote multi-site monitoring. On-premise architectures retain relevance in highly regulated sectors where data residency and ultra-low-latency inference are non-negotiable.

By Enterprise Size

Sub-SegmentKey Trend
Large EnterprisesMulti-site, multi-OEM deployments requiring enterprise-grade interoperability
Small and Medium EnterprisesSaaS-based entry points and PMaaS bundles lowering adoption thresholds


Large enterprises invest in comprehensive platforms spanning thousands of assets globally. SMEs are the fastest-growing segment, propelled by affordable cloud-native solutions that deliver condition-monitoring capabilities previously reserved for Fortune 500 manufacturers.

By End-User Industry

Sub-SegmentKey Trend
Industrial ManufacturingHighest asset density and the earliest adopter of vibration-based predictive analytics
Automotive & TransportationFleet telematics and EV production-line monitoring driving rapid deployment
Energy and UtilitiesWind-turbine, grid-transformer, and battery-storage monitoring fueling the fastest vertical growth
HealthcareMedical-device uptime compliance under FDA and MDR frameworks
Others (Aerospace, Mining, Telecom)Specialized high-value assets demanding tailored failure-prediction models


Industrial manufacturing leads adoption owing to the sheer density of rotating machinery and process equipment. Energy and utilities represent the fastest-growing vertical as the global renewable-energy build-out creates millions of new monitored assets requiring continuous condition analytics.

By Region

Sub-SegmentKey Trend
North AmericaMature cloud infrastructure, aerospace MRO, and oil-and-gas digitization
EuropeIndustrie 4.0, EU Machinery Regulation compliance, and automotive OEM ecosystems
Asia-PacificGovernment-backed smart-factory programs in China and India
South AmericaMining and oil extraction modernization in Brazil and Argentina
Middle East & AfricaVision 2030 industrial diversification and smart-city utility projects


North America leads the global market on the strength of early enterprise cloud adoption and federal manufacturing-efficiency programs. Asia-Pacific is converging rapidly, driven by state-backed industrialization incentives and an expanding base of greenfield manufacturing facilities.