Segmentation Quick Reference
| Dimension | Sub-Segments | Dominant Segment | Fastest Growing Segment |
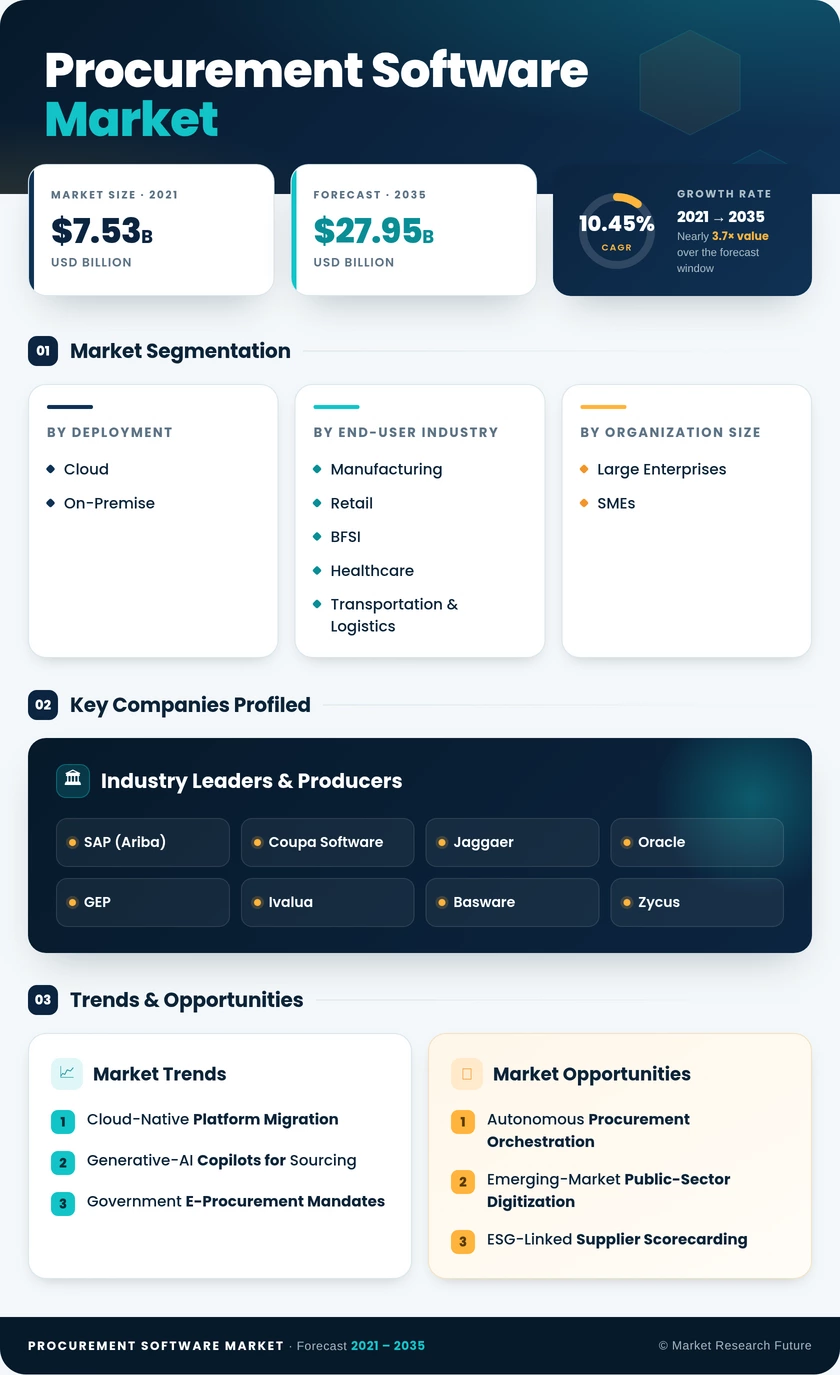
| Deployment | Cloud, On-Premise | Cloud | Cloud |
| End-User Industry | Manufacturing, Retail, BFSI, Procurement Software Market, Transportation & Logistics, IT & Telecom, Others | Manufacturing | Procurement Software Market |
| Organization Size | Large Enterprises, SMEs | Large Enterprises | SMEs |
| Application Module | Procure-to-Pay, Contract Lifecycle Management, e-Sourcing, Spend Analysis, Others | Procure-to-Pay | Contract Lifecycle Management |
| Component | Procurement Software Market, Services | Procurement Software Market | Services |
- --
Market Segmentation Overview
By Deployment
| Sub-Segment | Key Trend |
| Cloud | Multi-tenant SaaS architectures dominate new deployments; real-time spend visibility and AI-copilot integration drive adoption |
| On-Premise | Declining share but remains relevant for defense, banking, and regulated industries with strict data-residency mandates |
Cloud deployment continues to capture the overwhelming majority of new procurement software contracts, as organizations prioritize speed of deployment, lower TCO, and seamless access to AI-powered analytics within unified e-procurement platforms.
By End-User Industry
| Sub-Segment | Key Trend |
| Manufacturing | Complex multi-tier BOM sourcing and supplier diversification strategies drive demand |
| Retail | Omnichannel inventory procurement and direct-import sourcing management tools adoption |
| BFSI | Regulatory-driven audit trails and vendor risk management |
| Procurement Software Market | Value-based procurement linking sourcing to clinical outcomes |
| Transportation & Logistics | Fleet MRO automation and fuel procurement optimization |
| IT & Telecom | Rapid refresh cycles and SaaS-native procurement integration |
| Others | Government, education, energy, and utilities procurement digitization |
Manufacturing retains the largest end-user share due to its complex supplier ecosystems, while healthcare is the fastest-growing vertical as procurement becomes tightly integrated with clinical value metrics.
By Organization Size
| Sub-Segment | Key Trend |
| Large Enterprises | Global supplier network complexity necessitates full-suite spend management solutions |
| SMEs | Freemium tiers and embedded financing lower barriers to purchase order automation adoption |
Large enterprises dominate current spending, but SMEs represent the growth frontier as vendors offer modular, consumption-based pricing that makes procurement software accessible to organizations with limited IT budgets.
By Application Module
| Sub-Segment | Key Trend |
| Procure-to-Pay | End-to-end workflow from requisition through payment; highest share |
| Contract Lifecycle Management | AI-driven clause extraction and renewal management; fastest growing |
| e-Sourcing | Strategic sourcing events, reverse auctions, and supplier discovery |
| Spend Analysis | Real-time category intelligence and savings identification |
| Others | Supplier information management, invoice automation, catalog management |
Procure-to-pay modules remain the anchor application, but contract lifecycle management gains momentum as AI-based analysis tools streamline negotiation and compliance tracking.
By Component
| Sub-Segment | Key Trend |
| Procurement Software Market | Subscription-based licensing replacing perpetual models; core revenue driver |
| Services | Implementation, managed services, and consulting growing faster as deployments scale |
Procurement Software Market retains the majority of revenue, but services are the faster-growing component as organizations invest in change management, integration, and ongoing optimization of their procurement technology stacks.