Retinal Biologics Market (2026 - 2035)

Retinal Biologics Market Research Report: Size, Share, Trend Analysis By Drug Class (TNF-a Inhibitor and VEGF-A Antagonist), By Indication (Macular Degeneration, Diabetic Retinopathy, Uveitis, and Others), By Distribution Channel (Hospitals and Clinics, Pharmacies, and Others), and By Region (North America, Europe, Asia-Pacific, and Rest Of The World) - Growth Outlook & Industry Forecast 2025 To 2035

Forecast Period
2026-2035
CAGR
7.26%
2025 Market Size
USD 25.42 Billion
2035 Market Size
USD 51.04 Billion
Pharmaceutical ● Updated August 24, 2026 Report ID: MRFR/Pharma/8693-HCR | Pages: 140 | Author: Rahul Gotadki, Satyendra Maurya

Retinal Biologics Market Summary

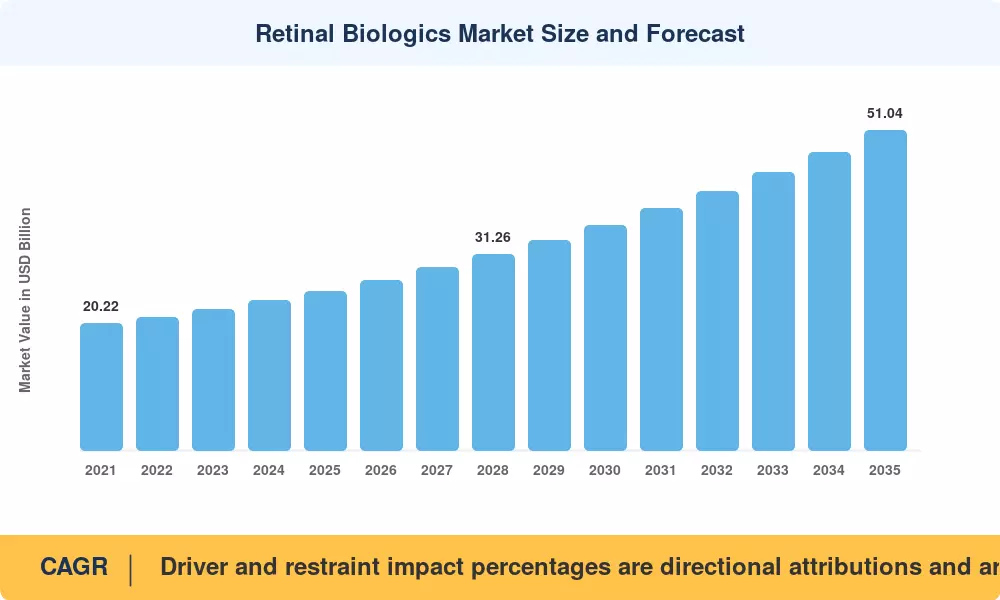
The Retinal Biologics Market reached USD 25.42 billion in 2025 and is projected to grow to USD 51.04 billion by 2035, expanding at a compound annual growth rate (CAGR) of 7.26% between 2026 and 2035. Market value is expected to reach USD 27.17 billion in 2026 as the first year of the forecast period. This growth is being driven primarily by an expanding treatable patient pool following new biosimilar approvals in the United States and heavy capital investment in retinal disease assets, alongside a broader shift toward longer-lasting and one-time retinal treatments.

In the United States, the Food and Drug Administration (FDA) cleared five aflibercept biosimilars during 2024, widening the treatable patient pool at a lower per-dose cost. This regulatory expansion has made anti-VEGF therapy accessible to a broader patient population while lowering the cost burden on health systems. Capital has followed this clinical opportunity: Merck committed roughly USD 3 billion to acquire EyeBio in 2024, and Cencora paid about USD 4.6 billion for Retina Consultants of America, signaling strong investor confidence in the retinal disease treatment pipeline.

Treatment paradigms are also shifting beneath these headline figures. Monthly and bimonthly anti-VEGF dosing, the standard of care for nearly two decades, is giving way to high-dose formulations, port delivery systems, bispecific antibodies, and one-time gene-based interventions such as revakinagene taroretcel-lwey. The U.S. National Eye Institute (NEI) directed more than USD 890 million toward vision research in fiscal 2024, with a meaningful share of that funding aimed at durable retinal therapeutics.

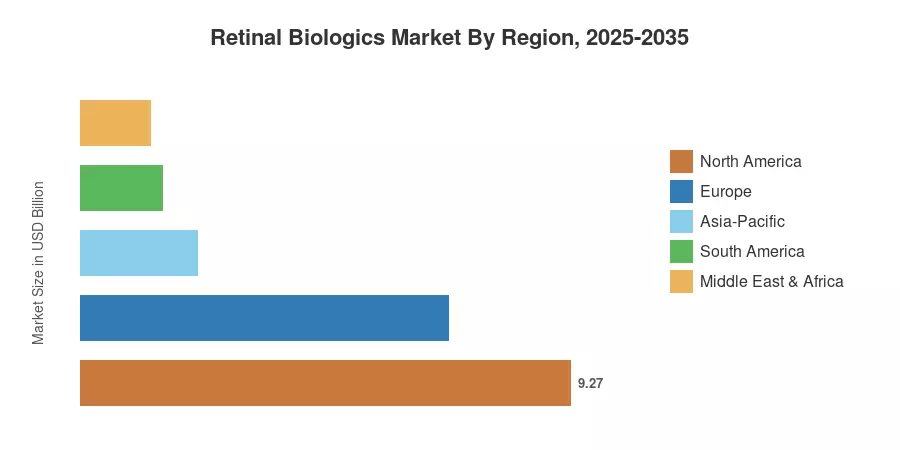
By region, North America holds the largest share of the Retinal Biologics Market, at 36.47% of global revenue, supported by Medicare Part B buy-and-bill reimbursement economics. Asia-Pacific is the fastest-growing region, with a projected CAGR of 8.69% through 2035, driven by expanding diabetes screening programs across China and India. Europe holds the second-largest share, where health technology assessment bodies are accelerating biosimilar substitution across the region. By 2035, the Retinal Biologics Market is expected to function less like an injection-based business and more like a durability-focused business, centered on long-lasting and one-time treatments.


Key Report Takeaways

• By Drug Class

  • VEGF-A antagonists commanded 54.05% of Retinal Biologics Market revenue in 2025
  • Gene therapies are forecast to compound at a 14.01% CAGR through 2035
  • Complement inhibitors generated USD 1.94 billion in 2025

• By Indication

  • Age-related macular degeneration accounted for 48.38% of the Retinal Biologics Market in 2025
  • Diabetic retinopathy posts the fastest indication growth at a 9.57% CAGR
  • Retinal vein occlusion contributed USD 2.31 billion in 2025

• By Region

  • North America captured 36.47% share in 2025
  • Asia-Pacific advances at an 8.69% CAGR to 2035
  • Europe delivered USD 6.97 billion in 2025


Market Size and Forecast (2021–2035)

Figures below blend audited ophthalmology franchise disclosures from Regeneron, Roche, Bayer, and Novartis with national claims datasets, hospital pharmacy procurement panels covering 41 countries, and clinician surveys of injection volumes. Historical years are reconciled against reported net product sales; forecast years apply indication-level incidence modelling rather than top-down extrapolation for the Retinal Biologics Market.
Retinal Biologics Market Size and Forecast
Our Impact
Enabled $4.3B Revenue Impact for Fortune 500 and Leading Multinationals
Partnering with 2000+ Global Organizations Each Year
30K+ Citations by Top-Tier Firms in the Industry

Driver Impact Analysis

Driver ~% Impact on CAGR Geographic Relevance Impact Timeline
Aging demographics lifting AMD prevalence 1.6 Global Long-term (≥4 yr)
Rising diabetes burden expanding retinopathy pool 1.4 Asia-Pacific, MEA Medium-term (2–4 yr)
Gene therapy and long-acting platform approvals 1.2 North America, Europe Long-term (≥4 yr)
Biosimilar entry widening treated population 0.9 North America, Europe Short-term (≤2 yr)
Teleophthalmology screening reimbursement 0.7 North America, Asia-Pacific Medium-term (2–4 yr)
Strategic capital inflows and consolidation 0.6 Global Short-term (≤2 yr)
Suprachoroidal and subretinal delivery innovation 0.5 Global Long-term (≥4 yr)


Demographic Pressure on Macular Disease

Population ageing does more than enlarge the patient pool — it changes its composition. The World Health Organization projects the global cohort aged 60 and above will reach 1.4 billion by 2030, roughly a 34% increase over 2020 [8]. Because neovascular AMD incidence rises sharply after age 75, that shift compounds injection demand faster than headline population growth suggests. Retina practices in Japan and Germany already report treatment-naïve patient volumes growing at high single digits annually, and the Retinal Biologics Market absorbs that pressure directly through recurring dosing schedules.


Diabetes Prevalence and Retinopathy Screening

Diabetes remains the single largest upstream determinant of retinal drug consumption. The International Diabetes Federation counts 589 million adults living with diabetes in 2024, forecast to reach 853 million by 2050 [9]. Roughly one in three develops some degree of retinopathy. China's national fundus screening initiative and India's Ayushman Bharat vision modules have pushed diagnosis rates up materially, converting latent disease into treated demand and lifting the diabetic retinopathy segment CAGR to 9.57%.


Durable Platforms and One-Time Interventions

Injection fatigue caps real-world outcomes; patients averaging seven anti-VEGF doses annually in trials receive closer to four in practice. Manufacturers responded with high-dose aflibercept, faricimab's angiopoietin-2 co-targeting, and encapsulated cell therapy implants. The National Eye Institute's fiscal 2024 allocation exceeded USD 890 million, with translational retinal gene delivery among its fastest-growing line items [4]. Durability is the competitive currency now.

Capital Concentration Across the Care Pathway

Investors bought the delivery channel, not just the molecule. Cencora's roughly USD 4.6 billion acquisition of Retina Consultants of America consolidated more than 300 retina specialists under one commercial umbrella [3]. Merck's approximately USD 3 billion EyeBio purchase secured a bispecific asset targeting vascular leakage [2]. Both transactions signal that buyers expect pricing power to migrate toward integrated therapy-plus-site platforms.


Restraints Impact Analysis

Restraint ~% Impact on CAGR Geographic Relevance Impact Timeline
Payer step-therapy and prior authorization -0.9 North America Short-term (≤2 yr)
Sterile fill-finish capacity constraints -0.7 Global Medium-term (2–4 yr)
Price erosion following biosimilar entry -0.6 North America, Europe Medium-term (2–4 yr)
Injection burden and treatment discontinuation -0.5 Global Long-term (≥4 yr)
Retina specialist shortage in emerging economies -0.4 Asia-Pacific, MEA, South America Long-term (≥4 yr)


Utilization Management Slows Premium Adoption

Payers rarely block innovation outright; they delay it. Step-therapy protocols across major U.S. commercial plans typically require documented failure on a lower-cost agent before authorizing high-dose or bispecific therapy, adding a median 12 to 16 weeks to time-to-treatment [12]. That lag suppresses first-year revenue capture on newly launched assets and pushes manufacturers toward outcomes-based contracting.


Manufacturing Capacity for Sterile Ophthalmic Fill

Particulate control tolerances for prefilled intraocular syringes are significantly higher than those of ordinary parenteral lines. Since 2023, the use of sterile fill-finish has exceeded 85% worldwide, and it usually takes 24 to 30 months and USD 200–350 million in capital to certify a new ophthalmic line [13]. For this reason alone, a number of biosimilar sponsors have staggered launches.


Real-World Adherence Gaps

Registry data consistently show one-year discontinuation rates near 25% among neovascular AMD patients, driven by transport burden, caregiver dependency, and injection anxiety [14]. Every dropped patient removes recurring revenue permanently, which is precisely why durable formats command valuation premiums.


Retinal Biologics Market Opportunities

Dry AMD Therapeutics Beyond Complement

Complement inhibition opened the atrophic segment, but efficacy remains modest, and endophthalmitis signals have tempered uptake. Neuroprotective and mitochondrial-targeted candidates now in mid-stage trials could address the roughly 5 million patients globally with advanced dry disease who currently have no durable option [7]. First-in-class approval here would reset segment economics.

Asia-Pacific Access Expansion

China's National Reimbursement Drug List additions cut patient out-of-pocket costs for anti-VEGF agents by more than 60% since 2020, and India's price-controlled biosimilar tier has brought per-dose cost below USD 200 [16]. Volume growth in these geographies now outpaces value growth, favouring manufacturers with local fill capacity and tiered pricing discipline. The Retinal Biologics Market opportunity here is unit-driven.

Home Monitoring and Data-Enabled Service Models

Implantable and app-based home optical coherence tomography generates longitudinal fluid data between visits. Vendors are licensing anonymized progression datasets to pharmaceutical sponsors for trial enrichment and to payers for risk stratification — a recurring-revenue layer independent of drug margin [17].

Suprachoroidal and Office-Based Delivery

Suprachoroidal administration confines drug to the posterior segment while sparing anterior structures, enabling higher payloads without proportional safety cost. The route grows at 10.46% CAGR and suits ambulatory settings, easing the specialist bottleneck flagged in Section 5.

Biosimilar Portfolio Bundling

With five aflibercept biosimilars cleared, differentiation shifts from molecule to contract. Suppliers bundling ranibizumab and aflibercept versions with imaging service credits and inventory financing are winning multi-year hospital pharmacy tenders in Europe [1].


Retinal Biologics Market Future Outlook

Artificial Intelligence in Screening and Triage

Autonomous diabetic retinopathy detection systems already carry regulatory clearance in the U.S. and EU, and reimbursement codes now exist for point-of-care screening in primary care settings [10]. As sensitivity improves, referral volumes will rise faster than specialist supply, pulling demand into the Retinal Biologics Market from populations previously invisible to it.

Durability Economics Replace Dosing Frequency

Revenue per patient will increasingly reflect annualized value rather than injection count. Sponsors are already pricing extended-interval regimens on total-cost-of-care logic, and gene-based single administrations will force payers to build amortization frameworks similar to those used for haemophilia therapies [4].

Manufacturing Localization

Tariff exposure and supply security concerns are pushing fill-finish capacity closer to demand. Announced ophthalmic-grade aseptic investments across India, Korea, and Ireland exceed USD 1.8 billion for the 2025–2029 period, which should ease the capacity restraint identified earlier [13].

Sustainability and Waste Reduction

Single-use vials generate substantial clinical waste, and European hospital systems now report ophthalmology-specific carbon metrics under CSRD reporting obligations [20]. Prefilled syringes and multi-dose durable implants reduce that footprint, giving environmental performance a procurement weighting inside the Retinal Biologics Market that did not exist five years ago.


Retinal Biologics Market Segmentation

Segmentation across the Retinal Biologics Market follows five commercial dimensions plus geography, each with distinct growth mechanics.

By Drug Class

Segment Metric (2025) Primary Demand Driver
VEGF-A Antagonists 54.05% share Established efficacy and broad reimbursement
VEGF-C/D and Bispecific Antagonists USD 3.61 Billion Extended dosing intervals
Complement Inhibitors USD 1.94 Billion First approved atrophic disease option
Gene Therapies 14.01% CAGR One-time administration value proposition
Others (Integrin, Tie-2) 6.80% CAGR Combination regimen trials


VEGF-A blockade remains the revenue backbone of the Retinal Biologics Market, but its share is eroding roughly 100 basis points annually as bispecific and high-dose alternatives capture switch volume. Gene therapy is the structural story: a 14.01% CAGR reflects both clinical momentum and the willingness of payers to entertain outcome-linked instalment contracts for durable interventions.

By Molecule Type

Segment Metric (2025) Primary Demand Driver
Monoclonal Antibodies 42.54% share Deep clinical evidence base
Fusion Proteins USD 8.12 Billion High-dose formulation uptake
Antibody Fragments 5.90% CAGR Cost-competitive biosimilar supply
Gene Vectors 12.82% CAGR AAV manufacturing scale-up
Others USD 1.21 Billion Peptide and aptamer pipelines


Fusion protein revenue held up better than expected through biosimilar entry because high-dose aflibercept converted a meaningful share of the installed base before biosimilars reached full commercial supply. Vector-based products remain a small revenue slice but attract a disproportionate share of development capital.

By Indication

Segment Metric (2025) Primary Demand Driver
Age-Related Macular Degeneration 48.38% share Ageing population and high injection frequency
Diabetic Retinopathy 9.57% CAGR Screening expansion in emerging economies
Diabetic Macular Edema USD 5.24 Billion Established treatment protocols
Retinal Vein Occlusion USD 2.31 Billion Acute presentation and rapid treatment initiation
Others (Uveitis, Inherited Dystrophies) 8.20% CAGR Orphan designation incentives


Macular degeneration dominates because treated patients remain on therapy for years, and the geographic atrophy sub-indication has only recently become addressable. Diabetic retinopathy grows fastest not because prevalence is rising quickest, but because detection rates are — the gap between prevalent and diagnosed cases is closing rapidly across Asia-Pacific and Latin America.

By Route of Administration

Segment Metric (2025) Primary Demand Driver
Intravitreal Injection 62.20% share Default clinical standard
Suprachoroidal Delivery 10.46% CAGR Targeted posterior segment exposure
Subretinal Delivery USD 1.08 Billion Gene therapy administration requirement
Others (Topical, Systemic) 4.60% CAGR Early-stage adjunct research


Intravitreal Injection dominates because it remains the established delivery route for retinal biologics, supported by extensive clinical adoption and established treatment infrastructure, accounting for 62.20% of the market. Suprachoroidal Delivery grows fastest at 10.46% CAGR, driven by its ability to deliver higher drug payloads to the posterior segment while supporting less invasive, office-based administration. Subretinal Delivery represents a USD 1.08 billion segment, while other routes, including topical and systemic delivery, grow at 4.60% CAGR but remain comparatively limited.


By Distribution Channel

Segment Metric (2025) Primary Demand Driver
Hospital Pharmacies 48.46% share Buy-and-bill infrastructure and cold chain
Specialty Clinics 9.37% CAGR Ambulatory shift and physician ownership
Retail Pharmacies USD 3.94 Billion Prescription-fill models in Europe
Others USD 1.02 Billion Direct-to-provider and mail programs


Hospital Pharmacies dominate because retinal biologics require controlled dispensing, specialist oversight, and coordinated administration, accounting for 48.46% of the market. Specialty Clinics grow fastest at a 9.37% CAGR, supported by expanding outpatient retinal care and increasing treatment volumes. Retail Pharmacies represent a USD 3.94 billion segment, while other distribution channels account for USD 1.02 billion, remaining smaller but complementary routes to patient access.


Regional Market Share Analysis

Region Metric (2025) Primary Investment Themes
North America 36.47% share Buy-and-bill economics, high-dose conversion, gene therapy launch infrastructure
Europe USD 6.97 Billion Biosimilar substitution, HTA-driven tendering, cross-border trial networks
Asia-Pacific 8.69% CAGR Screening scale-up, local manufacturing, NRDL reimbursement expansion
South America 6.10% share Public-private eye care partnerships, biosimilar import liberalization
Middle East & Africa USD 1.33 Billion Sovereign health fund investment, diabetes program build-out
Total USD 25.42 Billion

Geographic performance across the Retinal Biologics Market reflects three variables: reimbursement architecture, retina specialist density, and diabetes prevalence trajectory.


North America

Country Metric Key Driver
US 84.6% of region Medicare Part B reimbursement supports premium agent uptake
Canada USD 0.71 Billion Provincial formulary expansion for faricimab
Mexico 8.10% CAGR IMSS diabetic retinopathy screening rollout


The U.S. dominates the North American market, accounting for 84.6% of the regional market, reflecting its large treated patient base and established reimbursement infrastructure. Canada represents a USD 0.71 billion market, supported by expanding access to retinal biologics, while Mexico is the fastest-growing market, recording an 8.10% CAGR as diagnosis and treatment access continue to expand.


Europe

Country Metric Key Driver
Germany 23.4% of region G-BA benefit assessment supports rapid biosimilar switching
UK USD 1.18 Billion NHS national tender framework for anti-VEGF agents
France 14.2% of region HAS reimbursement for bispecific therapy
Italy 6.40% CAGR Regional AIFA registry monitoring
Spain USD 0.63 Billion Autonomous community procurement consolidation
Nordic Countries 7.10% of region Early adoption of extended-interval dosing
Russia 5.20% CAGR Domestic biosimilar substitution policy
Rest of Europe USD 0.75 Billion CEE access programs


European purchasers negotiate as blocs, which compresses launch prices but stabilizes volume. NHS England's framework agreements have cut per-dose anti-VEGF spending by more than 40% since biosimilar ranibizumab entry, freeing budget headroom that hospitals have redirected toward imaging capacity and additional injection clinics [18].

Asia-Pacific

Country Metric Key Driver
China 31.8% of region NRDL inclusion and provincial screening mandates
Japan USD 1.42 Billion High elderly prevalence and dense retina specialist network
India 11.40% CAGR Ayushman Bharat vision modules and low-cost biosimilars
South Korea 9.30% of region Domestic biosimilar manufacturing base
ASEAN 9.80% CAGR Expanding private ophthalmology chains
Rest of Asia-Pacific USD 0.61 Billion Donor-funded blindness prevention programs


Growth leadership in the Retinal Biologics Market belongs to Asia-Pacific because diagnosis, not therapy, was the historic bottleneck. China now screens tens of millions of diabetic patients annually through community health centres equipped with AI-assisted fundus cameras, converting undetected disease into treatment starts [16]. Korea's biosimilar manufacturers supply both domestic and export demand, keeping regional cost structures competitive.

South America

Country Metric Key Driver
Brazil 58.4% of region SUS coverage expansion for macular disease
Argentina 7.30% CAGR Private insurance uptake in urban centres
Rest of South America USD 0.34 Billion Regional tender harmonization


Brazil's public system covers anti-VEGF therapy through centralized procurement, but waiting lists in northern states routinely exceed six months. ANVISA's streamlined biosimilar pathway approved multiple ophthalmic candidates since 2023, and increased supply is beginning to shorten those queues [19].

Middle East & Africa

Country Metric Key Driver
Saudi Arabia 27.6% of region Vision 2030 health sector investment
UAE USD 0.24 Billion Mandatory insurance covering chronic eye disease
South Africa 7.90% CAGR Public sector diabetic retinopathy screening
Egypt 11.2% of region Presidential initiative for chronic disease detection
Rest of MEA USD 0.41 Billion Donor and NGO blindness prevention funding


Gulf sovereign health programs fund capacity ahead of demand, building tertiary retina units in Riyadh, Jeddah, and Abu Dhabi. Sub-Saharan access remains constrained by specialist density — under one ophthalmologist per 250,000 people in several markets — making task-shifting and imaging-based triage the practical near-term lever [15].


Retinal Biologics Market By Region, 2025-2035

Competitive Benchmarking

Concentration is moderate but top-heavy. The estimated Herfindahl-Hirschman Index sits near 1,750, and the top five suppliers together control roughly 72–78% of global revenue. Below that tier, the field fragments sharply among biosimilar sponsors and clinical-stage gene therapy developers competing for the durable-treatment position within the Retinal Biologics Market.

Company Est. Revenue Share Range Key Offerings for Retinal Biologics Market Strategic Positioning
Regeneron Pharmaceuticals ~26–30% Aflibercept, high-dose aflibercept Volume leader defending against biosimilar erosion
Roche / Genentech ~18–22% Faricimab, ranibizumab, port delivery system Durability-first portfolio with bispecific advantage
Bayer AG ~13–16% Aflibercept (ex-US territories) Territory-led franchise with strong EU tender access
Novartis AG ~7–10% Ranibizumab, brolucizumab, gene therapy pipeline Rebuilding position through AAV platform investment
AbbVie (Allergan) ~4–6% Corticosteroid implants, retinal pipeline Adjacent ophthalmology breadth and surgical channel
Apellis Pharmaceuticals ~3–5% Complement inhibitor for atrophic disease First-mover in a previously untreated indication
Astellas Pharma ~2–4% Complement therapeutics, cell therapy assets Acquisition-driven entry into retinal degeneration
Amgen Inc. ~2–4% Aflibercept and ranibizumab biosimilars Scale manufacturing and payer contracting strength
Samsung Bioepis ~1–3% Ophthalmic biosimilar portfolio Low-cost supply anchored in Korean capacity
Biogen Inc. ~1–3% Ranibizumab biosimilar Selective participation via partnership model
Sandoz Group ~1–2% Ranibizumab biosimilar European tender specialist
REGENXBIO Inc. <1% Subretinal and suprachoroidal gene therapy candidates Pure-play platform with partnership optionality


Recent News & Developments

Deal flow and regulatory activity across the Retinal Biologics Market accelerated sharply from 2023 onward.

  • U.S. Food and Drug Administration (2024): Cleared five aflibercept biosimilars, materially reshaping payer negotiating leverage and accelerating access for lower-income patients [1]
  • Merck & Co. (May 2024): Agreed to acquire EyeBio for approximately USD 3 billion upfront and milestone value, securing a bispecific candidate targeting vascular leakage [2]
  • Cencora (2024): Completed a roughly USD 4.6 billion acquisition of Retina Consultants of America, consolidating a national retina practice network [3]
  • Neurotech Pharmaceuticals (March 2025): Received U.S. approval for revakinagene taroretcel-lwey, the first encapsulated cell therapy for a retinal degenerative condition [7]
  • Roche (2023): Reported faricimab reaching blockbuster status within its second full year on market, validating extended-interval dosing demand [6]
  • Astellas Pharma (2024): Expanded its retinal degeneration portfolio through targeted acquisition of complement and cell therapy assets [11]
  • National Eye Institute (FY2024): Allocated more than USD 890 million to vision research, with growth concentrated in gene delivery and regenerative programs [4]
  • NHS England (2024): Extended national anti-VEGF tender framework, reporting cumulative savings exceeding GBP 500 million since biosimilar introduction [18]


Retinal Biologics Market Report Scope

Parameter Detail
Market Scope Global retinal biologic therapeutics including anti-VEGF agents, complement inhibitors, bispecific antibodies, gene therapies, and cell-based implants
Study Period 2021–2035 (Historical 2021–2024; Base Year 2025; Forecast 2026–2035)
CAGR 7.26% (2026–2035)
Market Size Checkpoints 2025: USD 25.42 Billion; 2026: USD 27.17 Billion; 2035: USD 51.04 Billion
Fastest Growing Segments Gene Therapies (drug class); Diabetic Retinopathy (indication); Suprachoroidal Delivery (route); Asia-Pacific (geography)
Companies Profiled 12 major suppliers spanning originators, biosimilar sponsors, and platform developers
Valuation Currency USD Billion
CAGR Driver Disclaimer Driver and restraint impact percentages are directional attributions and are not additive to the headline CAGR

FAQs

How should investors evaluate gene therapy assets in the Retinal Biologics Market versus recurring-revenue anti-VEGF franchises?
Recurring injection revenue offers predictable cash flow; one-time therapies front-load value and depend on payer amortization willingness. Weight gene assets on reimbursement precedent, not just efficacy data [4].
What contracting terms matter most when procuring biosimilars in the Retinal Biologics Market?
Prioritize guaranteed supply volumes, cold-chain penalty clauses, and prefilled syringe availability over headline discount depth. Supply interruption costs clinics more than a two-point price differential [1].
Does biosimilar competition threaten specialty clinic economics?
Lower acquisition cost compresses buy-and-bill margin per unit, but higher patient throughput generally offsets it. Clinics with imaging and diagnostic revenue streams absorb the shift better [10].
How do regulators treat manufacturing site changes for retinal biologics?
Post-approval site transfers require comparability data on aggregation, particulate burden, and potency. Approval typically takes nine to eighteen months depending on jurisdiction [13].
What integration challenges arise when adopting AI-based screening in the Retinal Biologics Market?
Image quality variability across camera models drives most false referrals. Successful deployments standardize hardware before scaling software [10].
Which emerging indications could expand addressable demand beyond current segments?
Inherited retinal dystrophies and non-infectious posterior uveitis are the nearest candidates, both supported by orphan incentives. Combined, they represent a modest but high-price opportunity [11].
How should procurement teams compare suprachoroidal and intravitreal delivery on total cost?
Suprachoroidal administration requires specialized microneedle devices, raising per-procedure consumable cost. Fewer required visits usually make the annualized comparison favourable [25].    
Author
Author
Author Profile
Rahul Gotadki LinkedIn
Research Manager
He holds an experience of about 9+ years in Market Research and Business Consulting, working under the spectrum of Life Sciences and Healthcare domains. Rahul conceptualizes and implements a scalable business strategy and provides strategic leadership to the clients. His expertise lies in market estimation, competitive intelligence, pipeline analysis, customer assessment, etc.
Co-Author
Co-Author Profile
Satyendra Maurya LinkedIn
Research Analyst
An accomplished research analyst with high proficiency in market forecasting, data visualization, competitive benchmarking, and others. He holds a pronounced track record in research and consulting projects for sectors such as life sciences, medical devices, and healthcare IT. His capabilities in qualitative and quantitative analysis have resulted in positive client outcomes. Working on niche market trends, opportunities, sales, and forecasted value is part of his skill set.
Share::
Request Free Sample

Research Approach


Secondary Research

The secondary research process involved comprehensive analysis of regulatory databases, peer-reviewed ophthalmology journals, clinical trial repositories, and authoritative vision health organizations. Key sources included the US Food & Drug Administration (FDA) Ophthalmic Devices and Biologics Division, European Medicines Agency (EMA) Advanced Therapy Medicinal Products (ATMP) Committee, National Eye Institute (NEI/NIH), ClinicalTrials.gov Registry, World Health Organization (WHO) World Report on Vision, Centers for Disease Control and Prevention (CDC) Vision Health Initiative, American Academy of Ophthalmology (AAO) IRIS Registry, American Society of Retina Specialists (ASRS) Preferences and Trends (PAT) Survey, European Society of Retina Specialists (EURETINA), Asia-Pacific Vitreo-retina Society (APVRS), National Center for Biotechnology Information (NCBI/PubMed), Cochrane Eyes and Vision Group, and national blindness registries from key markets. These sources were used to collect epidemiological data on age-related macular degeneration (AMD) and diabetic retinopathy, regulatory approval timelines for anti-VEGF agents and biosimilars, clinical safety profiles of intravitreal injections, treatment algorithm evolution, and real-world injection frequency patterns.


Primary Research

To gather both qualitative and quantitative insights, supply-side and demand-side stakeholders were interviewed during the primary research phase. CEOs, global heads of ophthalmology business units, heads of biosimilar development, regulatory affairs directors, and market access leads from biopharmaceutical companies creating gene therapies, sustained-release implants, and anti-VEGF treatments were among the supply-side sources. Board-certified vitreoretinal surgeons, retina specialists, heads of the ophthalmology departments at university medical centers, medical directors of outpatient retina clinics, and members of the pharmacy & therapeutics (P&T) committees at hospitals and ambulatory surgical centers were examples of demand-side sources. In addition to verifying biosimilar pipeline timelines and interchangeability studies, primary research validated market segmentation across wet AMD, diabetic macular edema (DME), and retinal vein occlusion (RVO) indications. It also collected information on injection interval preferences, switching patterns between branded and biosimilar products, reimbursement dynamics for office-based versus hospital-based administration, and formulary positioning strategies.

Primary Respondent Breakdown:

• By Designation: C-level Primaries (28%), Director Level (32%), Others (40%)

• By Region: North America (38%), Europe (30%), Asia-Pacific (25%), Rest of World (7%)


Market Size Estimation

Global market valuation was derived through patient epidemiology modeling and injection volume analysis. The methodology included:

• Identification of 25+ key manufacturers across North America, Europe, Asia-Pacific, and Latin America developing reference anti-VEGF biologics, biosimilars, and novel sustained-release formulations

• Product mapping across vascular endothelial growth factor (VEGF) inhibitors (aflibercept, ranibizumab, brolucizumab, faricimab), biosimilar equivalents, and emerging gene therapy candidates

• Analysis of reported and modeled annual revenues specific to ophthalmology portfolios and retinal biologics franchises

• Coverage of manufacturers representing 75-80% of global market share in 2024

• Extrapolation using bottom-up (prevalent patient population × diagnosed and treated rate × average injections per year × average selling price by country) and top-down (manufacturer revenue validation and biosimilar erosion modeling) approaches to derive indication-specific valuations across wet AMD, DME, and RVO segments

Share::
Request Free Sample
Download Free Sample

Kindly complete the form below to receive a free sample of this Report

* Please use a valid business email

Share::
Request Free Sample
Download PDF ×

We do not share your information with anyone. However, we may send you emails based on your report interest from time to time. You may contact us at any time to opt-out.
















