Set-Top Box (STB) Market (2025 - 2035)

Set-Top Box (STB) Market Size, Share and Research Report Product Type (Internet Protocol TV, Digital Terrestrial Television, Satellite, Cable, Over-The-Top Content, and Others), By Content Quality (High Definition, Standard Definition, and 4K), By Service (Managed Services, Interaction Services), By End-User (Commercial, Residential) And By Region (North America, Europe, Asia-Pacific, And Rest Of The World) – Industry Forecast Till 2035
ID: MRFR/SEM/3177-CR
100 Pages
Nirmit Biswas, Aarti Dhapte
Last Updated: July 06, 2026
Set-Top Box (STB) Market
Market Size
Forecast Period2025-2035
CAGR (2025-2035)3.25%
2025 Market SizeUSD 216.40 Billion
2035 Market SizeUSD 297.30 Billion
Key Players
CommScope
Huawei Technologies
Technicolor
Sagemcom
Samsung Electronics
Roku Inc.
Opportunities
  • Hybrid Broadcast-OTT Devices
  • Emerging-Market IPTV Greenfields
  • Data Monetization Through Viewership Analytics

Set-Top Box Market Summary

The Set-Top Box Market was valued at USD 216.40 billion in 2025 and is projected to reach USD 222.95 billion in 2026 before climbing to USD 297.30 billion by 2035, registering a CAGR of 3.25% across the 2026–2035 forecast window. Fibre-to-the-home rollouts across Europe and the Asia-Pacific, combined with aggressive 4K content acquisition by cable operators ahead of major global sporting events, are anchoring demand for next-generation receiver hardware. Government broadband subsidies — including programs that have directed over USD 42 billion toward last-mile connectivity in the United States alone — continue to expand the addressable installed base for IP-connected devices [1].

A structural technology shift is reshaping the Set-Top Box Market. Legacy proprietary middleware stacks are giving way to operator-grade open platforms such as Reference Design Kit and standardized Linux distributions, compressing product development cycles from 18 months to under 8 months. Operators that migrated to open platforms have reported 20–30% reductions in software maintenance costs, freeing capital for user-experience enhancements and cloud-DVR integration [2]. The result is a device category that increasingly resembles a managed smart TV appliance rather than a simple descrambler.

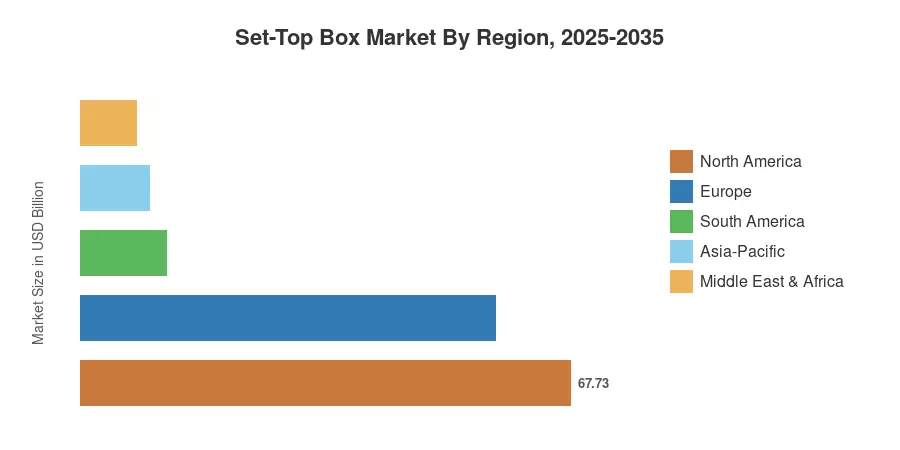
North America held approximately 31.3% of the Set-Top Box Market in 2025, supported by high average revenue per user among cable multisystem operators. Asia-Pacific is the fastest-growing region, forecast to expand at a 4.40% CAGR through 2035, driven by broadband densification in India and Southeast Asia. Europe contributed roughly 26.5% of global revenue, with IPTV uptake in France, Germany, and the Nordic nations offsetting satellite declines. The next decade will increasingly reward vendors capable of bridging linear broadcast and over-the-top streaming within a single hybrid architecture.

Key Report Takeaways

• By Technology

  • Satellite and direct-to-home platforms accounted for approximately 48.0% of the Set-Top Box Market in 2025, reflecting their entrenched position in regions with limited fixed broadband.
  • Internet protocol television is forecast to grow at a 4.10% CAGR from 2026 to 2035, fueled by telco triple-play bundling and fibre network expansion.

• By End User

  • Residential subscribers represented roughly 71.5% of the Set-Top Box Market in 2025, driven by multi-room viewing and whole-home networking requirements.
  • The transportation segment is projected to record the fastest end-user CAGR at approximately 4.15% through 2035.

• By Region

  • North America dominated with a 31.3% share of the Set-Top Box Market in 2025, underpinned by premium 4K unit pricing and bundled broadband strategies.
  • Asia-Pacific is set to expand at a 4.40% CAGR during 2026–2035, led by India's BharatNet broadband initiative and rising IPTV adoption across ASEAN economies.

Market Size and Forecast (2021–2035)

Market Research Future derives historical estimates from vendor shipment data, operator procurement disclosures, and regional trade statistics. Forecast projections layer in broadband penetration trajectories, content-licensing investment trends, and regulatory impact modeling across 35 countries.
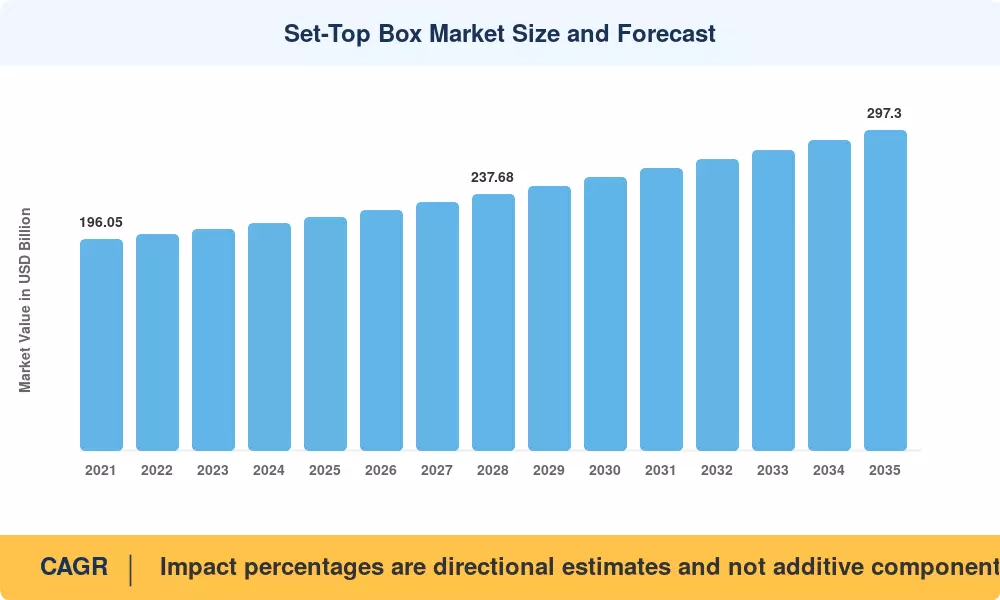
Set-Top Box Market Size and Forecast
Our Impact
Enabled $4.3B Revenue Impact for Fortune 500 and Leading Multinationals
Partnering with 2000+ Global Organizations Each Year
30K+ Citations by Top-Tier Firms in the Industry

Driver Impact Analysis

Driver ~% Impact on CAGR Geographic Relevance Impact Timeline
Fibre-to-the-home network buildouts +0.65% Asia-Pacific, Europe Medium-term
4K/UHD premium content expansion +0.50% Global Short-term
Operator platform standardization +0.40% North America, Europe Medium-term
Government broadband subsidies +0.35% India, US, Brazil Long-term
Multi-screen and whole-home DVR demand +0.25% North America Short-term
Hospitality and transportation vertical growth +0.20% Europe, Middle East Long-term
Voice-assistant integration in receivers +0.15% North America, Asia-Pacific Medium-term


Fibre-to-the-Home Network Buildouts

Telco operators across the Asia-Pacific and Europe are investing heavily in fibre access infrastructure, directly stimulating replacement demand for IPTV-capable receivers. India's BharatNet program targets 250,000 gram panchayats with high-speed broadband by 2027, creating a greenfield installed base estimated at over 60 million IPTV-ready households [5]. In Europe, Deutsche Telekom and Orange collectively plan to pass 30 million additional fibre premises between 2025 and 2030, with each fibre connection typically bundled with a managed set-top device. This infrastructure wave converts satellite-only households into hybrid or IP-only subscribers, raising both unit volumes and average selling prices for the Set-Top Box Market.

4K and UHD Premium Content Expansion

Major global sporting events — including the 2026 FIFA World Cup and the 2028 Los Angeles Olympic Games — are compelling pay-TV operators to upgrade their device fleets to 4K-capable hardware. ESPN's parent company committed over USD 2 billion in rights fees for 4K sports production through 2028, while the European Broadcasting Union has mandated UHD delivery for all flagship events from 2026 onward [4]. Each upgrade cycle translates into a device replacement event, lifting the Set-Top Box Market through both volume and price-mix improvement.

Operator Platform Standardization

The migration toward open middleware platforms, such as the Reference Design Kit, allows operators to deploy feature updates over-the-air rather than swapping hardware. Comcast reported a 28% reduction in annual CPE operating expenditure after transitioning to its open X1 platform [2]. Standardization also shortens time-to-market for new entrants, intensifying competitive pressure but expanding overall unit demand as smaller regional operators that previously relied on white-label devices now procure customizable, branded equipment.

Government Broadband Subsidies

The Set-Top Box Market has a structural tailwind in public funding initiatives. The U.S. Broadband Equity, Access, and Deployment initiative committed USD 42.5 billion to last-mile connections, with the majority of these funds dedicated to fibre projects that include controlled receivers [5]. Similarly to Brazil’s Norte Conectado and South Korea’s Digital New Deal, it dedicates state investment to network densification, thereby encouraging the purchase of devices at the home level.

Restraints Impact Analysis

The restraint estimates below are directional indicators of growth drag and should not be subtracted linearly from the headline CAGR.

Restraint ~% Impact on CAGR Geographic Relevance Impact Timeline
Cord-cutting and subscriber erosion –0.45% North America, Europe Short-term
Smart-TV app substitution –0.35% Global Medium-term
EU Ecodesign and WEEE compliance costs –0.20% Europe Medium-term
Semiconductor supply volatility –0.15% Global Short-term
Low-cost dongle cannibalization –0.10% Asia-Pacific, South America Long-term


Cord-Cutting and Subscriber Erosion

Between 2022 and 2025, the total number of traditional pay-TV homes in the United States fell by almost 6 million, reducing the total linear-TV subscriber base to fewer than 70 million for the first time [9]. Every lost subscriber eliminates one leased or purchased receiver from the active installed base, which puts direct volume pressure on the Set-Top Box Market. Operators partially offset the income loss with higher per-unit prices for 4K devices, but the net impact is still a considerable drag on volume growth in developed Western economies.

Smart-TV App Substitution

Built-in streaming operating systems on TVs, from Samsung’s Tizen to LG’s webOS, are gradually making standalone receivers unnecessary for cord-never families. >With 2024 approaching, more than 85% of televisions supplied globally included at least one integrated streaming application [10]. This tendency narrows the addressable market of the Set-Top Box Market in non-managed pay-TV service households, especially among the younger generation in metropolitan locations.

EU Ecodesign and WEEE Compliance Costs

European Union Regulation 2023/826 imposes standby power limits of 0.5 watts on networked consumer devices, requiring vendors to redesign power-supply architectures. Compliance redesigns add an estimated EUR 1.50–2.00 per unit in component and certification costs [11]. Coupled with Waste Electrical and Electronic Equipment take-back obligations, these regulations raise landed costs for vendors selling into the European portion of the Set-Top Box Market.


Set-Top Box Market Opportunities

Hybrid Broadcast-OTT Devices

Operators are combining linear broadcast and streaming aggregation in single hybrid receivers, offering a unified content gateway for households. Sky’s Sky Glass platform and Deutsche Telekom’s MagentaTV One shows the potential of hybrid systems to lower subscriber churn up to 15% compared to standalone linear packages. The Set-Top Box Market will be a beneficiary as operators worldwide embrace these aggregation tactics.


Emerging-Market IPTV Greenfields

India, Indonesia, and Nigeria collectively represent over 350 million broadband-addressable households that lack a managed receiver today. As fibre and fixed-wireless networks extend into tier-2 and tier-3 cities, the Set-Top Box Market in these geographies could generate incremental demand of over 40 million units annually by 2030.

Data Monetization Through Viewership Analytics

Operators are deploying return-path data platforms that capture anonymized viewing behavior across millions of households. Targeted advertising revenue enabled by set-top analytics grew an estimated 35% year-over-year in 2024, transforming the receiver from a cost center into a revenue-generating data endpoint [14]. This business-model shift strengthens operator willingness to subsidize hardware, indirectly supporting the Set-Top Box Market.

Hospitality and Transportation Verticals

Hotel chains and airlines are refreshing in-room and in-seat entertainment systems with IP-connected receivers that support guest-profile personalization and content casting from mobile devices. Marriott International disclosed plans to upgrade 500,000 rooms with managed IPTV receivers by 2028, representing a concentrated procurement opportunity for the Set-Top Box Market.

AI-Driven Content Personalization

Machine-learning recommendation engines embedded directly in receiver firmware enable operators to improve content-discovery metrics by 20–25%, boosting viewer engagement and reducing churn [15]. As edge AI chipsets decline in cost, personalization features will migrate from premium tiers to mid-range devices, broadening the addressable footprint of the Set-Top Box Market.

Set-Top Box Market Future Outlook

Edge AI and On-Device Intelligence

Receiver chipsets from Amlogic and Broadcom are embedding dedicated neural processing units capable of running content-recommendation and voice-interaction models directly on the device. By 2030, an estimated 60% of new receivers shipped globally will include on-device AI inference capabilities, reducing cloud compute costs for operators and enabling real-time content personalization even in bandwidth-constrained environments [15]. The Set-Top Box Market will increasingly differentiate on AI feature depth rather than raw decode performance.

Cloud-Native and Thin-Client Architectures

Operators are experimenting with cloud-rendering architectures where video decoding and user-interface compositing occur in the network rather than on the device. This thin-client approach could reduce per-unit hardware costs by 30–40%, making managed receivers economically viable in price-sensitive emerging markets [16]. The Set-Top Box Market may see a bifurcation between premium feature-rich devices in mature economies and low-cost cloud-dependent terminals in developing regions.

Sustainability and Circular-Economy Mandates

The European Commission's proposed extension of Ecodesign requirements to standby-mode network traffic management will affect receiver power architectures through 2030. Operators, including Vodafone and BT, have committed to carbon-neutral CPE supply chains by 2035, prompting device vendors to adopt recycled plastics and modular designs that facilitate refurbishment [11]. These sustainability imperatives will reshape bill-of-materials decisions across the Set-Top Box Market.

Platform Convergence and Super-Aggregation

The boundary between managed receivers and retail streaming devices continues to blur as operators license their platforms to third-party hardware. Comcast's licensing of the X1 operating system to Cox and Rogers, and Sky's partnership with Samsung to embed the Sky Glass interface in select television models, signal a future where the Set-Top Box Market increasingly generates revenue through software licensing alongside hardware sales [17].


Set-Top Box Market Segmentation

By Technology

Segment Key Metric Primary Demand Driver
Satellite/DTH 48.0% share (2025) Rural coverage, sports broadcasting
Cable USD 48.70 Billion (2025) MSO fleet upgrades in North America
IPTV 4.10% CAGR (2026–2035) Telco fibre-bundling strategies
DTT/Hybrid USD 22.15 Billion (2025) Government digital switchover mandates


Satellite and DTH platforms retain the largest technology share of the Set-Top Box Market because they serve geographies where fixed broadband alternatives remain unavailable or uneconomical. However, IPTV is steadily gaining ground as telco operators bundle managed receivers with fibre subscriptions, offering interactive features — electronic program guides, catch-up TV, and network DVR — that satellite alone cannot match.

Cable receivers continue to generate substantial revenue in North America, where MSOs invest in advanced platforms to retain subscribers against streaming alternatives. DTT and hybrid devices see concentrated demand in markets undergoing government-mandated analog-to-digital switchovers, particularly in Latin America and parts of Africa.

By Resolution

Segment Key Metric Primary Demand Driver
Standard Definition USD 24.80 Billion (2025) Budget segments in emerging markets
High Definition 44.5% share (2025) Mainstream broadcast standard
UHD/4K and Higher 3.95% CAGR (2026–2035) Sports content and premium tiers


High-definition receivers remain the volume workhorse across the Set-Top Box Market, serving as the default specification for most operator-managed deployments. UHD and 4K devices, while still priced at a 15–25% premium, are capturing an increasing share of new shipments as content libraries expand and chipset costs decline. Standard-definition units persist in price-sensitive developing markets but represent a shrinking proportion of global revenue.

By End User

Segment Key Metric Primary Demand Driver
Residential 71.5% share (2025) Multi-room and whole-home DVR demand
Commercial/Hospitality USD 28.60 Billion (2025) Hotel and venue IPTV modernization
Government and Education 3.05% CAGR (2026–2035) Digital classroom and public-venue broadcasting
Transportation 4.15% CAGR (2026–2035) Airline and rail IFE system upgrades


Residential subscribers dominate the Set-Top Box Market by volume, with households in mature economies frequently operating two or three receivers to support multi-room viewing. The commercial and hospitality segment generates above-average margins because hotel operators procure centrally managed IPTV systems that carry premium service-level agreements.

By Operating System

Segment Key Metric Primary Demand Driver
Android TV 44.0% share (2025) Google ecosystem, rapid app integration
Proprietary Linux USD 68.50 Billion (2025) Legacy operator deployments
Other (RDK, proprietary) 3.50% CAGR (2026–2035) Operator customization requirements


Android TV has become the dominant operating system in the Set-Top Box Market as mid-tier and regional operators adopt Google's turnkey software stack to accelerate time-to-market. Proprietary Linux variants persist among large cable MSOs that invested heavily in custom middleware, though even these operators increasingly evaluate open-platform migration to reduce long-term maintenance overhead.


Regional Market Share Analysis

Region Key Metric Primary Investment Themes
North America 31.3% share (2025) 4K fleet upgrades, broadband bundling
Europe USD 57.35 Billion (2025) IPTV migration, Ecodesign compliance
Asia-Pacific 4.40% CAGR (2026–2035) Fibre buildouts, emerging-market IPTV
South America USD 11.90 Billion (2025) DTT digitization, government subsidies
Middle East & Africa 3.55% CAGR (2026–2035) Satellite DTH, hospitality modernization
Total USD 216.40 Billion (2025)

The Set-Top Box Market exhibits pronounced regional variation shaped by broadband maturity, regulatory frameworks, and content-licensing ecosystems.


North America

Country Key Metric Key Driver
United States 72.5% of regional share Cable MSO 4K upgrades
Canada USD 12.95 Billion (2025) Telco IPTV bundling
Mexico 3.10% CAGR (2026–2035) DTT digitization mandate


The United States remains the largest single-country contributor to the Set-Top Box Market, where operators such as Comcast and Charter drive device refresh cycles tied to 4K content rights. Canada's Bell Fibe and Telus Optik platforms sustain steady IPTV receiver procurement, while Mexico's ongoing digital terrestrial transition creates replacement demand as analog shutoffs extend to secondary cities [6].

Europe

Country Key Metric Key Driver
Germany 22.0% of regional share Deutsche Telekom fibre push
United Kingdom USD 10.85 Billion (2025) Sky Glass hybrid platform
France 3.65% CAGR (2026–2035) Orange FTTH expansion
Italy USD 5.20 Billion (2025) TIM IPTV migration
Spain 3.30% CAGR (2026–2035) Movistar Plus+ integration
Nordic Countries USD 4.10 Billion (2025) High broadband penetration
Russia 3.40% CAGR (2026–2035) Domestic platform substitution
Rest of Europe USD 7.50 Billion (2025) Eastern Europe DTT modernization


Europe's Set-Top Box Market is shaped by aggressive fibre deployment and stringent energy regulations. France leads in IPTV penetration, with over 22 million fibre subscribers receiving managed receivers from Orange and Bouygues [11]. The United Kingdom's transition from Sky Q to the IP-native Sky Glass line demonstrates the broader European shift toward streaming-integrated devices.

Asia-Pacific

Country Key Metric Key Driver
China 36.5% of regional share IPTV mandate for China Telecom, China Unicom
India 5.10% CAGR (2026–2035) BharatNet fibre expansion
Japan USD 8.60 Billion (2025) 4K BS broadcast adoption
South Korea 4.25% CAGR (2026–2035) KT and SK Broadband IPTV
ASEAN USD 6.40 Billion (2025) Fixed-wireless broadband growth
Rest of Asia-Pacific 3.80% CAGR (2026–2035) Satellite DTH in rural areas


Asia-Pacific's share of the Set-Top Box Market is expanding rapidly, with China's three state-owned telcos deploying over 400 million IPTV connections by 2025. India represents the region's most dynamic growth story, as the transition from free-to-air DTH to managed IPTV receivers accelerates in states with newly deployed fibre infrastructure [5].

South America

Country Key Metric Key Driver
Brazil 58.0% of regional share DTT digitization, pay-TV bundling
Argentina USD 1.85 Billion (2025) Satellite DTH replacement
Rest of South America 3.20% CAGR (2026–2035) Government digital inclusion programs


Brazil dominates the South American Set-Top Box Market, with operators such as Claro and Vivo procuring hybrid receivers that combine satellite reception with broadband-delivered streaming. Argentina's economic volatility constrains consumer upgrade cycles, though satellite DTH remains the primary delivery platform in provincial markets.

Middle East & Africa

Country Key Metric Key Driver
Saudi Arabia 28.0% of regional share Vision 2030 digital infrastructure
UAE USD 2.40 Billion (2025) Hospitality IPTV modernization
South Africa 3.45% CAGR (2026–2035) MultiChoice DTH expansion
Egypt USD 1.30 Billion (2025) Government DTT transition
Rest of MEA 3.60% CAGR (2026–2035) Satellite DTH rural coverage


The Middle East & Africa Set-Top Box Market is anchored by satellite DTH platforms that serve dispersed rural populations. Saudi Arabia's Vision 2030 program is channeling investment into smart-city infrastructure that includes managed IPTV systems for residential developments, while the UAE's hospitality sector generates concentrated receiver procurement demand [7].


Set-Top Box Market By Region, 2025-2035

Competitive Benchmarking

The Set-Top Box Market exhibits moderate concentration, with the top five vendors collectively accounting for an estimated 35–42% of global revenue. The Herfindahl-Hirschman Index sits in the moderately concentrated range, reflecting a mix of global CPE specialists and regional device manufacturers. Competition centers on platform software capabilities, energy efficiency, and operator relationship depth.

Company Est. Revenue Share Range Key Offerings Strategic Positioning
CommScope (Arris) ~8–11% IPTV gateways, cable set-top platforms North America cable MSO incumbent
Huawei Technologies ~7–10% Hybrid IPTV receivers, fibre CPE Asia-Pacific and MEA telco partner
Technicolor (Vantiva) ~6–9% Android TV devices, satellite receivers European operator specialist
Sagemcom ~5–8% Broadband gateways, hybrid STBs French and European telco focus
Samsung Electronics ~4–7% Smart media receivers, Tizen ecosystem Retail and managed-device crossover
Roku Inc. ~3–6% Streaming players, operator-licensed OS Retail streaming and operator licensing
Kaon Broadband ~3–5% Cable and IPTV receivers Korean and APAC operator contracts
ZTE Corporation ~3–5% IPTV terminals, fibre ONT-STB combos China telco integrated CPE
Apple Inc. ~2–4% Apple TV streaming device Premium retail ecosystem play
Amazon (Fire TV) ~2–4% Fire TV Stick, operator editions Retail and operator co-branded devices


Recent News & Developments

  • Technicolor (Vantiva) (September 2022 ): Completed a corporate restructuring separating its connected-home division, enabling dedicated R&D investment in next-generation Android TV receiver platforms for operator customers [20].
  • European Commission (May 9, 2025, ): Published implementing guidelines for Regulation 2023/826, establishing 0.5-watt standby power limits for networked consumer equipment, including set-top receivers, effective January 2025 [11].
  • Amazon (October 2023 ): Released the Fire TV Stick 4K Max (2nd generation) with an upgraded quad-core processor and ambient display mode, targeting cord-cutting households, replacing managed operator devices [22].

Set-Top Box Market Report Scope

Parameter Detail
Market Scope Global Set-Top Box Market by Technology, Resolution, End User, Operating System, and Geography
Study Period 2021–2035
Historical Period 2021–2024
Base Year 2025
Forecast Period 2026–2035
CAGR (Forecast) 3.25%
Market Size (2025) USD 216.40 Billion
Market Size (2035) USD 297.30 Billion
Fastest Growing Region Asia-Pacific (4.40% CAGR)
Companies Profiled 10+ (CommScope, Huawei, Technicolor, Sagemcom, Samsung, Roku, Kaon, ZTE, Apple, Amazon)
Valuation Currency USD Billion
CAGR Driver Disclaimer Impact percentages are directional estimates and not additive components of the CAGR


FAQs

How does chipset selection affect total cost of ownership for operators deploying managed receivers?
Chipset choice determines decode capability, power draw, and AI feature support, directly influencing device lifespan and software-maintenance costs. Operators selecting system-on-chips with integrated Wi-Fi and neural processing units typically achieve 15–20% lower five-year TCO [15].
What procurement criteria should hospitality buyers prioritize when sourcing IPTV receivers?
Hospitality buyers should prioritize headend compatibility, remote device management, and guest-profile casting support. Centralized provisioning platforms reduce on-site technician visits and lower per-room operating costs over the contract period [7].
How do licensing fees for Android TV compare with proprietary Linux stacks for mid-tier operators?
Android TV eliminates upfront middleware licensing but requires per-unit Google certification fees and app-store revenue sharing. Proprietary Linux avoids these fees but demands higher in-house development resources [2].
What role does Wi-Fi 7 play in next-generation receiver architectures?
Wi-Fi 7 enables multi-link operation and 320 MHz channels, supporting simultaneous 4K streams to multiple displays without dedicated Ethernet cabling. This reduces installation complexity in multi-room residential deployments [19].
How are return-path data regulations affecting operator advertising strategies on managed devices?
GDPR and state-level privacy laws require explicit viewer consent for behavioral data collection, limiting addressable advertising scale. Operators are adopting on-device anonymization to maintain targeting accuracy within regulatory boundaries [14].
What battery and power-supply innovations address European Ecodesign standby limits?
Vendors are deploying GaN-based power supplies and deep-sleep network-wake protocols to meet the 0.5-watt standby requirement while maintaining instant-on responsiveness [11].
How do cloud-DVR platforms change the hardware requirements for next-generation receivers?
Cloud DVR shifts storage and transcoding to operator data centers, eliminating the need for internal hard drives and reducing device thermal output. This enables smaller, fanless enclosures that lower manufacturing and shipping costs [16].    
Author
Author
Author Profile
Nirmit Biswas LinkedIn
Senior Research Analyst
With 5+ years of expertise in Market Intelligence and Strategic Research, Nirmit Biswas specializes in ICT, Semiconductors, and BFSI. Backed by an MBA in Financial Services and a Computer Science foundation, Nirmit blends technical depth with business acumen. He has successfully led 100+ projects for global enterprises and startups, including Amazon, Cisco, L&T and Huawei, delivering market estimations, competitive benchmarking, and GTM strategies. His focus lies in transforming complex data into clear, actionable insights that drive growth, innovation, and investment decisions. Recognized for bridging engineering innovation with executive strategy, Nirmit helps businesses navigate dynamic markets with confidence.
Co-Author
Co-Author Profile
Aarti Dhapte LinkedIn
AVP - Research
A consulting professional focused on helping businesses navigate complex markets through structured research and strategic insights. I partner with clients to solve high-impact business problems across market entry strategy, competitive intelligence, and opportunity assessment. Over the course of my experience, I have led and contributed to 100+ market research and consulting engagements, delivering insights across multiple industries and geographies, and supporting strategic decisions linked to $500M+ market opportunities. My core expertise lies in building robust market sizing, forecasting, and commercial models (top-down and bottom-up), alongside deep-dive competitive and industry analysis. I have played a key role in shaping go-to-market strategies, investment cases, and growth roadmaps, enabling clients to make confident, data-backed decisions in dynamic markets.

Research Approach


Secondary Research

The secondary research process involved comprehensive analysis of telecommunications regulatory databases, broadcasting standards documentation, peer-reviewed engineering journals, and authoritative technology organizations. Key sources included the Federal Communications Commission (FCC), European Telecommunications Standards Institute (ETSI), International Telecommunication Union (ITU), Advanced Television Systems Committee (ATSC), Digital Video Broadcasting Project (DVB), Society of Cable Telecommunications Engineers (SCTE), National Cable & Telecommunications Association (NCTA), Asia-Pacific Broadcasting Union (ABU), Office of Communications (Ofcom UK), Federal Network Agency (BNetzA Germany), Ministry of Industry and Information Technology (MIIT China), Telecom Regulatory Authority of India (TRAI), National Bureau of Statistics (China), OECD Communications Outlook, Eurostat Digital Economy & Society Statistics, IEEE Xplore Digital Library, and National Centers for Education Statistics (BCA Indonesia, AGCOM Italy).

These sources were employed to gather data on broadcast penetration statistics, 4K/8K deployment, regulatory compliance mandates (including energy efficiency regulations and conditional access standards), pay-TV subscriber trends, and technology migration patterns across cable, satellite, terrestrial, and IP-based delivery platforms.


Primary Research

Qualitative and quantitative insights were obtained by interviewing supply-side and demand-side stakeholders during the primary research process. The supply-side sources consisted of CEOs, CTOs, VPs of Hardware Engineering, product development leaders, and regulatory affairs managers from semiconductor/OEM providers, conditional access system vendors, and set-top box manufacturers. From cable multiple system operators (MSOs), satellite broadcasters, telecommunications providers, and OTT aggregators, demand-side sources included chief technology officers, managers of video engineering, procurement directors, and content strategy leads.

The primary research validated market segmentation across cable, satellite, IPTV, and hybrid/OTT platforms, confirmed the timelines for 4K/UHD and Android TV migration, and gathered insights on the adoption of hardware security modules, conditional access transitions, and pay-TV ARPU dynamics.

Primary Respondent Breakdown:

By Designation: C-level Executives (28%), Director Level (35%), Others (37%)

By Region: North America (28%), Europe (20%), Asia-Pacific (42%), Rest of World (10%)


Market Size Estimation

Revenue mapping and unit shipment analysis were employed to determine the global market valuation for cable, satellite, IPTV, and OTT/hybrid categories. The methodology comprised the following:

The identification of over 50 key manufacturers in North America, Europe, Asia-Pacific, and Latin America

Product mapping for cable STBs (DOCSIS 3.0/3.1/4.0), satellite STBs (DVB-S2/S2X), IPTV boxes, and Android TV/hybrid streaming devices An analysis of resolution-based segmentation that encompasses the STB portfolios of HD, 4K/UHD, and emerging 8K

Examination of the annual revenues of connected TV devices and set-top box hardware portfolios, as reported and modeled

Manufacturers that account for 75-80% of the global market share in 2024 are included in the coverage.

Incorporating pay-TV subscriber forecasts and cord-cutting trend adjustments, segment-specific valuations are derived through extrapolation using bottom-up (unit shipments × ASP by country and broadcast platform) and top-down (manufacturer revenue validation) approaches.

Download Free Sample

Kindly complete the form below to receive a free sample of this Report

Download PDF ×

We do not share your information with anyone. However, we may send you emails based on your report interest from time to time. You may contact us at any time to opt-out.

















