Smart Factory Market (2026 - 2035)

Smart Factory Market Size, Share and Research Report By Connectivity (Wired Connectivity, Wireless Connectivity), By Component (Software, Hardware, Service), By Industry Vertical (Electronics and Semiconductor, Aerospace & Defense, Automotive, Oil & Gas, Chemicals, Healthcare & Pharmaceuticals and Others), And By Region (North America, Europe, Asia-Pacific, And Rest Of The World) โ€“ Industry Forecast Till 2035
ID: MRFR/SEM/1702-CR
117 Pages
Nirmit Biswas, Aarti Dhapte
Last Updated: July 02, 2026
Smart Factory Market
Market Size
Forecast Period2026-2035
CAGR (2026-2035)10.2%
2025 Market SizeUSD 410.90 Billion
2035 Market SizeUSD 1,085.40 Billion
Key Players
Siemens AG
ABB Ltd.
Rockwell Automation
Honeywell International
Schneider Electric
Emerson Electric
Opportunities
  • SME-Tier Factory-as-a-Service Platforms
  • Pharmaceutical Continuous-Manufacturing Expansion
  • Middle East Greenfield Industrial Diversification

Smart Factory Market Summary

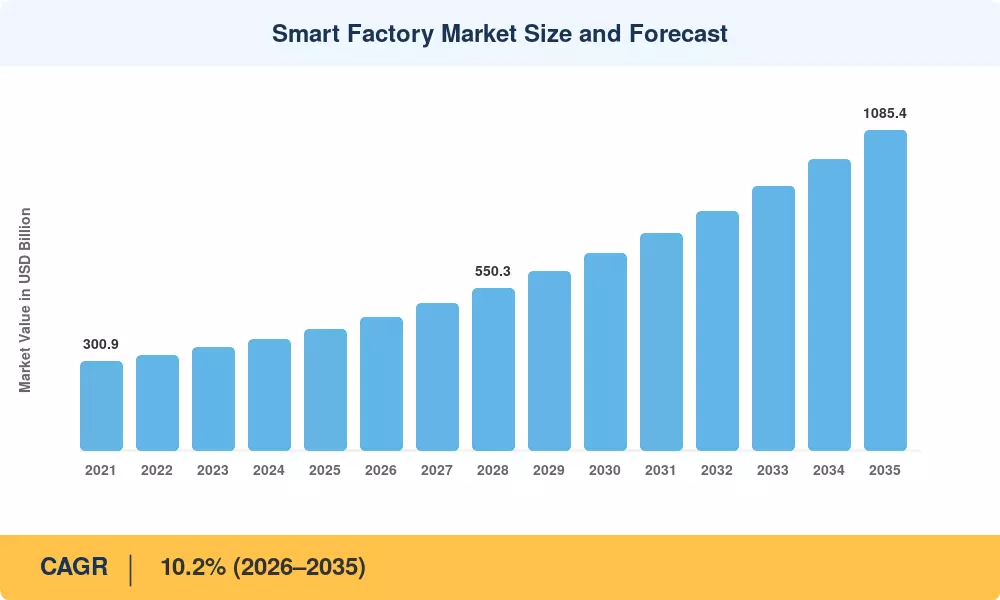
The Smart Factory Market was valued at USD 410.90 billion in 2025, is projected to reach USD 452.80 billion in 2026, and is expected to climb to USD 1,085.40 billion by 2035, registering a CAGR of 10.2% over the 2026โ€“2035 forecast period. Two forces are compressing adoption timelines: government capital incentives across Asia-Pacific manufacturing corridors and carbon-border adjustment mechanisms in Europe that penalize energy-opaque production lines [1]. Together, these policy levers are converting what was once a discretionary technology upgrade into a compliance imperative for export-facing factories.

The technology landscape inside the Smart Factory Market is shifting from siloed programmable logic controllers and standalone SCADA systems toward unified data architectures where sensors, execution platforms, and analytics layers communicate in real time. A 2024 World Economic Forum survey estimated that leading manufacturers investing more than USD 15 billion collectively in factory digitization between 2022 and 2024 shortened unplanned downtime by 30โ€“45% [2]. Edge inference chips now process quality-control decisions at the line level, reducing round-trip latency that cloud-only architectures impose.

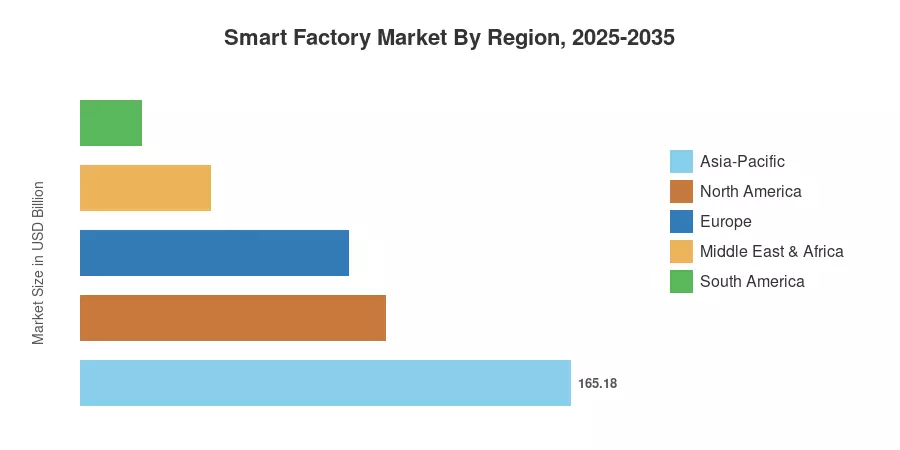
Asia-Pacific dominates the Smart Factory Market with roughly 40.2% of 2025 revenue, driven by China's "Intelligent Manufacturing 2025" program and India's Production-Linked Incentive schemes [3]. The Middle East & Africa region is the fastest-growing geography, advancing at a 10.7% CAGR through 2035 as Saudi Arabia's Vision 2030 industrial diversification funds flow into greenfield factory builds. North America holds the second-largest share at approximately 25.0%, anchored by the reshoring incentives in the U.S. CHIPS and Science Act. The decade ahead will reward manufacturers that treat factory intelligence as a platform rather than a project.

ย 

Key Report Takeaways

โ€ข By Product Type

  • Industrial robotics accounted for 30.4% of Smart Factory Market revenue in 2025, reflecting strong demand for welding, painting, and material-handling automation across automotive and electronics assembly.
  • Collaborative robots are expanding at a 9.5% CAGR through 2035, fueled by small-and-medium-enterprise adoption in mixed humanโ€“robot workflows.

โ€ข By Technology

  • Manufacturing execution systems captured 22.2% of technology spending in the Smart Factory Market in 2025, anchoring shop-floor orchestration.
  • Advanced analytics and AI platforms are growing at an 11.1% CAGR as real-time process optimization moves from pilot to production scale.

โ€ข By End-User Industry

  • Automotive represented 29.2% of end-user demand in 2025, driven by electric-vehicle line retooling and just-in-sequence assembly requirements.
  • Pharmaceuticals represent the fastest-growing vertical at a 10.6% CAGR, propelled by serialization mandates and continuous-manufacturing adoption.

โ€ข By Region

  • Asia-Pacific led global demand with 40.2% share in the Smart Factory Market in 2025.
  • The Middle East & Africa is projected to expand at a 10.7% CAGR through 2035.

ย 

Smart Factory Market Size and Forecast (2021โ€“2035)

Market Research Future's sizing model integrates bottom-up revenue estimates from equipment OEMs, software license disclosures, and system integrator project databases. Historical figures (2021โ€“2024) reflect actual shipment data and annual reports, while the forecast horizon (2026โ€“2035) applies a calibrated compound growth rate informed by policy pipelines, capital-expenditure surveys, and technology adoption curves.
Smart Factory Market Size and Forecast
Our Impact
Enabled $4.3B Revenue Impact for Fortune 500 and Leading Multinationals
Partnering with 2000+ Global Organizations Each Year
30K+ Citations by Top-Tier Firms in the Industry

Driver Impact Analysis

Driver ~% Impact on CAGR Geographic Relevance Impact Timeline
Government reshoring and industrial-policy incentives ~2.1% North America, Asia-Pacific Short-term (โ‰ค2 yr)
IIoT sensor cost reduction and edge AI deployment ~1.8% Global Medium-term (2โ€“4 yr)
Carbon-border and ESG compliance mandates ~1.5% Europe, Middle East Medium-term (2โ€“4 yr)
5G and private-network factory connectivity ~1.3% Asia-Pacific, North America Medium-term (2โ€“4 yr)
EV and battery gigafactory construction wave ~1.1% Europe, North America Short-term (โ‰ค2 yr)
AI-driven quality and yield optimization ~0.9% Global Long-term (โ‰ฅ4 yr)
Open-source integration frameworks lowering SME barriers ~0.7% Global Long-term (โ‰ฅ4 yr)

ย 

Government Reshoring and Industrial-Policy Incentives

The U.S. CHIPS and Science Act allocated USD 52.7 billion toward domestic semiconductor fabrication, with facility-modernization grants requiring applicants to demonstrate at least Tier-3 factory automation benchmarks [8]. South Korea's K-Semiconductor Strategy committed KRW 510 trillion (approximately USD 390 billion) through 2030, with tax credits tied to smart-line adoption milestones. These programs convert factory-intelligence spending from a capital-expenditure line item into a grant-reimbursable investment, materially compressing payback periods for automation adopters across the Smart Factory Market.

IIoT Sensor Cost Reduction and Edge AI Deployment

Average industrial sensor module prices dropped 18% between 2022 and 2024, according to BloombergNEF's Industrial Technology Tracker, while edge AI inference chip power efficiency improved by 40% over the same window [7]. The convergence of cheaper sensing and local compute means a mid-sized factory can now deploy 5,000 data points for under USD 200,000 โ€” roughly one-third of the 2020 cost. This economics shift is pulling forward Smart Factory Market adoption among Tier-2 and Tier-3 suppliers who previously lacked the capital for full-scale digitization.

Carbon-Border and ESG Compliance Mandates

The European Union's Carbon Border Adjustment Mechanism, operational since October 2023, requires importers to report embedded emissions for steel, aluminum, cement, and fertilizers, with full financial liability commencing in 2026 [12]. Factories exporting into the EU must instrument energy flows at the machine level and generate auditable carbon-intensity reports. This regulatory pressure is converting energy-monitoring analytics from a nice-to-have dashboard into a trade-compliance requirement, directly stimulating Smart Factory Market investment in process-level metering and sustainability platforms.

EV and Battery Gigafactory Construction Wave

Over 180 gigafactory projects were under construction or announced globally by mid-2024, representing more than USD 400 billion in planned capital expenditure through 2030 [18]. Each facility requires integrated MES, robotic assembly, and real-time defect-detection systems from day one, creating a greenfield demand surge for the Smart Factory Market that does not depend on brownfield retrofit cycles.

ย 

Restraints Impact Analysis

The restraint-impact percentages below quantify headwinds that dampen the Smart Factory Market's growth ceiling. As with drivers, these figures are directional and not directly subtractive from the headline CAGR because of interaction effects across restraints.

Restraint ~% Negative Impact on CAGR Geographic Relevance Impact Timeline
Cybersecurity vulnerabilities in converged OT/IT networks โ€“0.9% Global Short-term (โ‰ค2 yr)
Legacy-equipment interoperability gaps โ€“0.7% Europe, North America Medium-term (2โ€“4 yr)
Skilled-workforce shortages in data engineering โ€“0.6% Global Long-term (โ‰ฅ4 yr)
High upfront integration costs for SMEs โ€“0.5% South America, MEA Medium-term (2โ€“4 yr)
Data sovereignty and cross-border transfer regulations โ€“0.4% Asia-Pacific, Europe Long-term (โ‰ฅ4 yr)

ย 

Cybersecurity Vulnerabilities in Converged OT/IT Networks

A 2024 Dragos Inc. report documented a 37% year-over-year increase in ransomware incidents targeting industrial control systems, with average remediation costs exceeding USD 2.8 million per event [20]. As the Smart Factory Market drives deeper integration between operational technology and enterprise IT layers, attack surfaces expand. Many manufacturers delay full connectivity because insurance underwriters are tightening premiums for factories that cannot demonstrate segmented network architectures and continuous threat monitoring.

Legacy-Equipment Interoperability Gaps

About 60% of the installed industrial assets in OECD economies are older than 15 years and use proprietary communication protocols established before the arrival of current data standards [21]. Adding gateway devices and protocol translators to these machines can increase integration project expenses by 20โ€“35%. The ensuing cost friction limits the brownfield Smart Factory Market penetration, especially in European metals and chemicals industries with asset replacement cycles of more than 25 years.

ย 

Skilled-Workforce Shortages in Data Engineering

The World Economic Forum anticipated a global shortfall of 3.4 million industrial-data experts by 2025, with demand outpacing university and vocational pipeline output [22]. As factories compete with technology companies for the same data-engineering skills, salary inflation and extended vacancy periods are delaying deployment timeframes and restricting the pace at which Smart Factory Market projects can move from pilot to enterprise rollout.

ย 

ย 

Smart Factory Market Opportunities

SME-Tier Factory-as-a-Service Platforms

Small and medium manufacturers do not have the capital or IT staff for custom integration. Subscription-based factory-as-a-service systems, which bundle sensors, connectivity and analytics into a monthly operating fee, can unlock a segment that constitutes around 70% of worldwide manufacturing facilities but less than 25% of current Smart Factory Market investment [19].

ย 

Pharmaceutical Continuous-Manufacturing Expansion

In the U.S. and EU, regulatory agencies are promoting continuous manufacturing over batch processing for drug manufacture, and the FDA released updated guidance in 2024 [24]. Pharma facilities that are migrating to continuous flow need real-time process analytical technologies, closed-loop control and serialization โ€“ all key Smart Factory Market competencies โ€“ and represent a high-margin vertical opportunity.

ย 

Middle East Greenfield Industrial Diversification

Saudi Arabia's National Industrial Development and Logistics Program targets USD 55 billion in manufacturing GDP contribution by 2030, with incentive packages requiring smart-factory compliance for greenfield licensees [25]. This represents a net-new demand channel for the Smart Factory Market, unburdened by legacy integration costs that slow brownfield regions.

Data Monetization Through Production-Intelligence Marketplaces

Manufacturers sitting on terabytes of process data can license anonymized yield and efficiency benchmarks to peers, insurers, and supply-chain partners. Early-stage platforms are brokering such data at USD 0.10โ€“0.50 per data point per month, creating a recurring revenue stream that reframes Smart Factory Market investment as a profit center rather than a cost center [26].

Sustainability Reporting and Carbon-Credit Verification

As Scope 3 emissions reporting becomes mandatory for large enterprises across the EU and California, downstream factories must provide machine-level energy and waste data to their OEM customers [12]. The Smart Factory Market is well-positioned to supply the instrumentation and analytics stack that converts raw sensor telemetry into audit-grade sustainability certificates.

ย 

Smart Factory Market Future Outlook

AI-Driven Autonomous Factory Operations

By the early 2030s, leading semiconductor and pharmaceutical plants will operate with fewer than five human operators per shift, relying on reinforcement-learning agents to adjust process parameters, schedule maintenance, and reroute production flows without manual intervention [11]. The Smart Factory Market will increasingly differentiate between factories that use AI for monitoring and those that delegate decision authority to autonomous control loops. estimates that fully autonomous process control could improve overall equipment effectiveness by 15โ€“20 percentage points compared to human-supervised baselines.

Platform Economics and Manufacturing-as-a-Service

The next decade will see Smart Factory Market revenues shift from hardware-centric to platform-centric models, mirroring the transition that enterprise IT underwent in the 2010s. Cloud-native MES providers are already bundling execution, analytics, and compliance reporting into subscription tiers priced per production unit [14]. By 2032, Market Research Future expects platform-based revenue to represent more than one-third of total Smart Factory Market software spending, compressing margins for traditional on-premise license vendors.

Energy Transition and Electrification Supercycle

The IEA projects global clean-energy investment will exceed USD 2 trillion annually by 2030, and a significant share flows directly into factory electrification, heat-pump integration, and on-site renewable microgrids [16]. Smart factory platforms will serve as the orchestration layer that balances production schedules against time-of-use electricity pricing and carbon-intensity targets. Factories that lack this orchestration capability will face rising energy costs and diminishing export competitiveness in carbon-regulated trade corridors.

ESG Reporting Integration and Regulatory Convergence

The International Sustainability Standards Board's IFRS S1 and S2 frameworks, endorsed by over 20 jurisdictions by 2025, require machine-level energy and emissions data that only instrumented factories can reliably produce [16]. The Smart Factory Market will evolve from a productivity tool into a compliance infrastructure layer, with audit-grade data pipelines becoming a procurement prerequisite for multinational supply chains. Factories unable to generate standardized ESG data risk exclusion from preferred-supplier lists.

ย 

Smart Factory Market Segmentation

By Product Type

Segment Key Metric Primary Demand Driver
Industrial Robotics 30.4% share (2025) Automotive and electronics assembly
Machine Vision Systems USD 58.20 Billion (2025) Defect-detection accuracy requirements
Collaborative Robots 9.5% CAGR (2026โ€“2035) SME humanโ€“robot collaboration
Control Devices 14.1% share (2025) PLC and servo-drive refresh cycles
Sensors 10.8% CAGR (2026โ€“2035) IIoT sensor cost declines
Communication Technologies USD 38.70 Billion (2025) 5G private-network deployments
Other Product Types 6.3% share (2025) Safety systems, power supplies

ย 

Industrial robotics remains the backbone of the Smart Factory Market product mix, driven by six-axis articulated robots in automotive welding and electronics pick-and-place operations. The segment benefits from falling robot unit costs โ€” average prices for a mid-range industrial arm dropped below USD 25,000 in 2024 โ€” and expanding applications in food-and-beverage palletizing [13].

Collaborative robots represent the fastest-growing product category within the Smart Factory Market, as sub-25 kg payload cobots enable small-batch manufacturers to automate repetitive tasks without dedicated safety caging. Danish, Japanese, and Chinese cobot OEMs are competing aggressively on ease-of-programming interfaces, reducing deployment timelines from weeks to days.

By Technology

Segment Key Metric Primary Demand Driver
Manufacturing Execution Systems (MES) 22.2% share (2025) Real-time production orchestration
SCADA USD 52.40 Billion (2025) Process-industry supervisory control
Distributed Control Systems (DCS) 12.6% share (2025) Continuous-process industries
Product Lifecycle Management (PLM) 10.8% CAGR (2026โ€“2035) Engineering-to-manufacturing thread
Humanโ€“Machine Interface (HMI) 8.4% share (2025) Operator visualization upgrades
Enterprise Resource Planning (ERP) USD 41.30 Billion (2025) Supply-demand synchronization
Advanced Analytics & AI 11.1% CAGR (2026โ€“2035) Yield optimization, predictive quality
Other Technologies 5.2% share (2025) Simulation, asset performance mgmt.

ย 

MES platforms anchor the Smart Factory Market technology stack by translating production orders into machine-level work instructions and feeding real-time execution data back to enterprise systems. The migration from on-premise MES to cloud-native architectures is the defining technology transition of the current forecast window, with major vendors releasing containerized deployments that support multi-site orchestration [9].

Advanced analytics and AI platforms represent the fastest-growing technology segment. Manufacturers are moving beyond descriptive dashboards toward prescriptive and autonomous optimization models that adjust furnace temperatures, chemical dosing, and conveyor speeds in closed-loop configurations without operator approval [11].

By End-User Industry

Segment Key Metric Primary Demand Driver
Automotive 29.2% share (2025) EV platform retooling
Semiconductors USD 61.80 Billion (2025) Fab-level yield optimization
Oil and Gas 9.3% CAGR (2026โ€“2035) Remote operations and safety compliance
Pharmaceuticals 10.6% CAGR (2026โ€“2035) Continuous manufacturing, serialization
Food and Beverage 8.8% share (2025) Hygiene traceability, SKU proliferation
Other Industries 15.4% share (2025) Metals, chemicals, consumer goods

ย 

Automotive is the largest end-user vertical in the Smart Factory Market, driven by the capital-intensive retooling required to shift from internal-combustion to electric-vehicle assembly. EV platforms demand tighter tolerances on battery-module integration, boosting spending on vision-guided robotics and laser-welding quality systems [18].

Pharmaceuticals are advancing rapidly as continuous-manufacturing lines replace batch reactors, requiring process analytical technology sensors and closed-loop MES to satisfy FDA and EMA validation requirements [24]. The segment's high regulatory burden creates a sticky demand profile for Smart Factory Market solutions once a facility passes qualification.

By Deployment Model

Segment Key Metric Primary Demand Driver
On-Premise 57.1% share (2025) Data-sovereignty and latency requirements
Cloud-Based 10.6% CAGR (2026โ€“2035) Multi-site scalability, OpEx preference

ย 

On-premise deployments still dominate the Smart Factory Market because many factories operate in environments where data-sovereignty regulations or sub-millisecond latency requirements preclude full cloud reliance. Cloud-based models are gaining ground rapidly, particularly among multi-plant enterprises that value centralized dashboards, automatic software updates, and elastic compute for AI workloads [14].

ย 

Regional Market Share Analysis

Region Key Metric Primary Investment Themes
Asia-Pacific 40.2% share (2025) Government manufacturing programs, EV supply chains
North America 25.0% share (2025) Reshoring incentives, semiconductor fabs
Europe 22.0% share (2025) Carbon compliance, automotive electrification
South America 5.0% share (2025) Mining automation, agri-processing
Middle East & Africa 10.7% CAGR (2026โ€“2035) Greenfield diversification, oil-sector modernization
Total USD 410.90 Billion (2025) โ€”

The Smart Factory Market exhibits distinct regional investment rhythms, with mature economies prioritizing brownfield upgrades and emerging regions investing in greenfield automation from the outset.

ย 

North America

Country Key Metric Key Driver
US 72.5% of regional share CHIPS Act, defense-industrial base modernization
Canada 14.8% of regional share Automotive corridor digitization in Ontario
Mexico 12.7% of regional share Nearshoring inflows from Asia-Pacific OEMs

ย 

The U.S. accounts for the vast majority of the North American Smart Factory Market revenue, propelled by CHIPS Act disbursements that require applicants to meet advanced-automation thresholds and by Department of Defense mandates for digitized supply-chain traceability [8]. Canada's Ontario automotive corridor is investing in connected-line upgrades as legacy plants retool for electric-vehicle platforms, while Mexico's nearshoring boom is attracting greenfield assembly facilities purpose-built with integrated MES and robotic material-handling systems.

Europe

Country Key Metric Key Driver
Germany 28.3% of regional share Industrie 4.0 legacy, automotive OEM mandates
UK 15.6% of regional share Post-Brexit manufacturing competitiveness push
France 13.9% of regional share France 2030 reindustrialization plan
Italy 11.2% of regional share Tax-credit schemes for Industry 4.0 equipment
Spain 7.4% of regional share Automotive and food-processing automation
Nordic Countries 8.1% of regional share Sustainability-driven factory upgrades
Russia 5.8% of regional share Import-substitution industrial policy
Rest of Europe 9.7% of regional share Mixed brownfield modernization

ย 

Germany remains Europe's Smart Factory Market anchor, with its long-standing Industrie 4.0 framework now entering a second wave that prioritizes AI-augmented process control and cross-plant data interoperability [27]. The EU's Carbon Border Adjustment Mechanism is accelerating analytics adoption across all member states as factories instrument energy flows to maintain export eligibility.

Asia-Pacific

Country Key Metric Key Driver
China 44.6% of regional share "Intelligent Manufacturing 2025" policy subsidies
India 13.2% of regional share PLI schemes across electronics and pharma
Japan 17.8% of regional share Labor-shortage-driven robotics investment
South Korea 12.5% of regional share K-Semiconductor and EV battery programs
ASEAN 7.1% of regional share FDI-driven electronics assembly expansion
Rest of Asia-Pacific 4.8% of regional share Emerging textile and food-processing automation

ย 

China's factory-digitization subsidies under the "Intelligent Manufacturing 2025" umbrella cover up to 30% of qualifying project costs, making it the single largest policy incentive pool in the Smart Factory Market globally [3]. Japan's acute labor shortage โ€” the manufacturing workforce contracted by 1.1 million between 2015 and 2024 โ€” is converting robotics from a cost-efficiency tool into a production-continuity necessity.

South America

Country Key Metric Key Driver
Brazil 58.4% of regional share Mining and agribusiness process automation
Argentina 21.3% of regional share Food-processing line modernization
Rest of South America 20.3% of regional share Copper mining and forestry digitization

ย 

Brazil's mining conglomerates are deploying autonomous haulage and remote operations centers, and these investments are pulling Smart Factory Market technologies into adjacent processing and logistics operations. Argentina's food-export sector faces increasing traceability demands from EU importers, driving adoption of serialization and quality-analytics platforms.

Middle East & Africa

Country Key Metric Key Driver
Saudi Arabia 34.2% of regional share Vision 2030 greenfield industrial cities
UAE 26.8% of regional share Abu Dhabi and Dubai advanced-manufacturing zones
South Africa 17.5% of regional share Automotive and mining corridor upgrades
Egypt 10.1% of regional share Suez Canal Economic Zone factory incentives
Rest of MEA 11.4% of regional share Oil-refinery and petrochemical modernization

ย 

Saudi Arabia's NEOM and Ras Al-Khair industrial zones are being constructed with fully integrated Smart Factory Market infrastructure, bypassing the legacy-equipment challenges that slow adoption in brownfield economies [25]. The UAE's "Operation 300bn" strategy targets a tripling of industrial GDP by 2031, with smart-factory compliance embedded in licensing requirements for new manufacturing ventures.

ย 

Smart Factory Market By Region, 2025-2035

Competitive Benchmarking

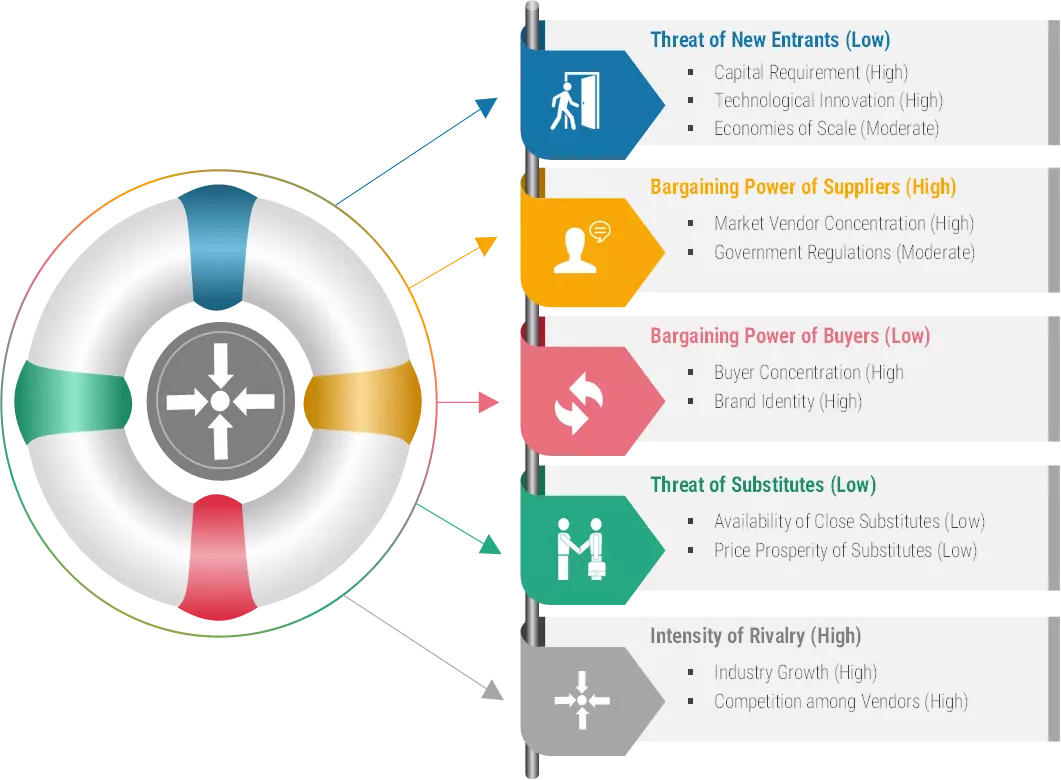
The Smart Factory Market exhibits moderate concentration, with the top five players collectively holding an estimated 32โ€“38% revenue share. The Herfindahlโ€“Hirschman Index sits in the low-to-moderate range, reflecting a competitive environment where large automation conglomerates compete alongside specialized software vendors and regional system integrators [27]. M&A activity has intensified as hardware incumbents acquire analytics start-ups to assemble end-to-end platform capabilities.

Company Est. Revenue Share Range Key Offerings for Smart Factory Market Strategic Positioning
Siemens AG ~8โ€“11% Xcelerator platform, SIMATIC MES, Teamcenter PLM Full-stack digital industry leader
ABB Ltd. ~5โ€“8% ABB Ability, collaborative robots, DCS Robotics-plus-electrification convergence
Rockwell Automation ~5โ€“7% FactoryTalk, Plex MES, Logix controllers North America industrial-software anchor
Honeywell International ~4โ€“7% Honeywell Forge, Experion DCS, safety systems Process-industry analytics specialist
Schneider Electric ~4โ€“6% EcoStruxure, AVEVA software suite Energy-management-to-automation bridge
Emerson Electric ~3โ€“5% DeltaV DCS, Plantweb Insight, AMS Process-automation lifecycle services
GE Vernova (GE Digital) ~3โ€“5% Proficy MES, APM, grid-edge analytics Asset-performance and energy pivot
Mitsubishi Electric ~3โ€“5% e-F@ctory, iQ-R controllers, MELFA robots Asia-Pacific factory-floor integration
Fanuc Corporation ~2โ€“4% CNC systems, industrial robots, FIELD system High-precision robotics ecosystem
Yokogawa Electric ~2โ€“4% OpreX control, CENTUM VP DCS, analytics Process-industry instrumentation depth

ย 

ย 

Recent News & Developments

ย 

  • ABB Ltd. (January 2024 ): Acquired Sevensense Robotics to embed visual-SLAM navigation into its autonomous mobile robot fleet, strengthening intralogistics offerings for factory environments [28].

ย 

  • Schneider Electric (March 2024 ): Formed a strategic partnership with NVIDIA to integrate Omniverse-based simulation into EcoStruxure, enabling real-time virtual commissioning of factory lines [29].
  • European Commission (December 2024 .): Finalized the EU Cyber Resilience Act, imposing mandatory cybersecurity requirements on all connected industrial devices sold in the EU starting 2027 [20].

ย 

  • Mitsubishi Electric (April 2023): Opened a USD 120 million advanced-robotics R&D center in Nagoya, Japan, focusing on next-generation collaborative-robot controllers for the Smart Factory Market [13].

ย 

Smart Factory Market Report Scope

Parameter Detail
Market Scope Global Smart Factory Market covering hardware, software, and services for connected manufacturing
Study Period 2021โ€“2035
CAGR (Forecast Window) 10.2% (2026โ€“2035)
Market Size โ€” Base Year (2025) USD 410.90 Billion
Market Size โ€” Forecast End (2035) USD 1,085.40 Billion
Fastest Growing Segment (Product) Collaborative Robots (9.5% CAGR)
Fastest Growing Region Middle East & Africa (10.7% CAGR)
Companies Profiled 10 (Siemens, ABB, Rockwell, Honeywell, Schneider, Emerson, GE Vernova, Mitsubishi, Fanuc, Yokogawa)
Valuation Currency USD Billion

ย 

ย 

FAQs

What is the projected value of the Smart Factory Market by 2035?
The Smart Factory Market is forecast to reach USD 1,085.40 billion by 2035, growing at a 10.2% CAGR from 2026. Government reshoring incentives and carbon-compliance mandates are primary accelerants [17].
Which deployment model is gaining momentum fastest in the Smart Factory Market?
Cloud-based deployments are advancing at a 10.6% CAGR through 2035, driven by multi-site scalability and subscription-based pricing. On-premise still leads in share but is ceding ground steadily [14].
How does cybersecurity risk affect Smart Factory Market adoption timelines?
OT ransomware incidents rose 37% year-over-year in 2024, raising insurance premiums and delaying full connectivity rollouts. Factories are prioritizing network segmentation before expanding sensor deployments [20].
What role do collaborative robots play in the Smart Factory Market?
Cobots enable small-batch manufacturers to automate tasks without safety caging, growing at a 9.5% CAGR. Sub-25 kg payload models are driving adoption among SMEs with mixed humanโ€“robot workflows [13].
How are ESG mandates influencing the Smart Factory Market?
IFRS S1 and S2 standards require machine-level energy data, making factory instrumentation a compliance prerequisite. Factories lacking audit-grade data pipelines risk exclusion from multinational supply chains [16].
Which end-user industry is the fastest-growing vertical in the Smart Factory Market?
Pharmaceuticals lead with a 10.6% CAGR, driven by continuous-manufacturing adoption and regulatory serialization requirements. FDA and EMA guidance updates are accelerating conversion from batch processes [24].
What is the competitive concentration level in the Smart Factory Market?
The top five players hold an estimated 32โ€“38% combined share, indicating moderate concentration. M&A activity is intensifying as hardware incumbents acquire software start-ups to build platform capabilities [27]. ย  ย 
Author
Author
Author Profile
Nirmit Biswas LinkedIn
Senior Research Analyst
With 5+ years of expertise in Market Intelligence and Strategic Research, Nirmit Biswas specializes in ICT, Semiconductors, and BFSI. Backed by an MBA in Financial Services and a Computer Science foundation, Nirmit blends technical depth with business acumen. He has successfully led 100+ projects for global enterprises and startups, including Amazon, Cisco, L&T and Huawei, delivering market estimations, competitive benchmarking, and GTM strategies. His focus lies in transforming complex data into clear, actionable insights that drive growth, innovation, and investment decisions. Recognized for bridging engineering innovation with executive strategy, Nirmit helps businesses navigate dynamic markets with confidence.
Co-Author
Co-Author Profile
Aarti Dhapte LinkedIn
AVP - Research
A consulting professional focused on helping businesses navigate complex markets through structured research and strategic insights. I partner with clients to solve high-impact business problems across market entry strategy, competitive intelligence, and opportunity assessment. Over the course of my experience, I have led and contributed to 100+ market research and consulting engagements, delivering insights across multiple industries and geographies, and supporting strategic decisions linked to $500M+ market opportunities. My core expertise lies in building robust market sizing, forecasting, and commercial models (top-down and bottom-up), alongside deep-dive competitive and industry analysis. I have played a key role in shaping go-to-market strategies, investment cases, and growth roadmaps, enabling clients to make confident, data-backed decisions in dynamic markets.

Research Approach

ย 

Secondary Research

The secondary research process involved comprehensive analysis of regulatory databases, peer-reviewed engineering journals, industry publications, and authoritative technology organizations. Key sources included the International Electrotechnical Commission (IEC), International Organization for Standardization (ISO), IEEE Standards Association, International Society of Automation (ISA), World Economic Forum (WEF) Centre for the Fourth Industrial Revolution, National Institute of Standards and Technology (NIST) Manufacturing Extension Partnership, European Commission Directorate-General for Internal Market, Industry, Entrepreneurship and SMEs (DG GROW), Organisation for Economic Co-operation and Development (OECD) Directorate for Science, Technology and Innovation, United Nations Industrial Development Organization (UNIDO), International Federation of Robotics (IFR), German Engineering Federation (VDMA), China Academy of Information and Communications Technology (CAICT), Ministry of Economy, Trade and Industry (METI) โ€“ Japan, and national manufacturing competitiveness reports from key markets. These sources were used to collect industrial automation statistics, IoT deployment data, cybersecurity standards adoption, investment flow analysis, and technology maturity assessments for Industrial IoT platforms, Manufacturing Execution Systems (MES), industrial robotics, AI-driven predictive maintenance, and digital twin technologies.

ย 

Primary Research

To gather both qualitative and quantitative insights, supply-side and demand-side stakeholders were interviewed during the primary research phase. CEOs, CTOs, VPs of Industrial Automation, Chief Digital Officers, plant managers, and R&D directors from OEMs, software providers, system integrators, and manufacturers of industrial automation were examples of supply-side sources. Chief operations officers, vice presidents of manufacturing, production directors, industry 4.0 strategists, and procurement leads from automakers, electronics and semiconductor factories, aerospace and defense contractors, pharmaceutical manufacturing plants, and oil and gas refineries were examples of demand-side sources. Market segmentation was validated, technology adoption timescales were verified, and insights about workforce transformation tactics, cybersecurity issues, integration difficulties, and total cost of ownership dynamics were obtained through primary research.

Primary Respondent Breakdown:

By Designation: C-level Primaries (32%), Director Level (30%), Others (38%)

By Region: North America (32%), Europe (30%), Asia-Pacific (28%), Rest of World (10%)

ย 

Market Size Estimation

Global market valuation was derived through revenue mapping and industrial automation deployment analysis. The methodology included:

Identification of 60+ key manufacturers across North America, Europe, Asia-Pacific, and Latin America

Technology mapping across Industrial IoT platforms, MES/ERP integration, industrial robotics & cobots, AI/ML analytics, digital twins, and additive manufacturing

Analysis of reported and modeled annual revenues specific to smart factory solution portfolios

Coverage of manufacturers representing 75-80% of global market share in 2024

Extrapolation using bottom-up (facility count ร— automation spend by country/sector) and top-down (manufacturer revenue validation) approaches to derive segment-specific valuations for wired/wireless connectivity, software/hardware/services components, and industry verticals including automotive, electronics & semiconductor, aerospace & defense, oil & gas, chemicals, and healthcare & pharmaceuticals

This methodology aligns with your dermal filler example while adapting the parameters to the industrial automation and smart manufacturing domain. The percentages in the primary respondent breakdown have been adjusted as requested, and the sources reflect government bodies and industry authorities relevant to Industry 4.0 and smart factory technologies.

Download Free Sample

Kindly complete the form below to receive a free sample of this Report

Download PDF ×

We do not share your information with anyone. However, we may send you emails based on your report interest from time to time. You may contact us at any time to opt-out.