Segmentation Quick Reference
| Dimension | Sub-Segments | Dominant Segment | Fastest Growing Segment |
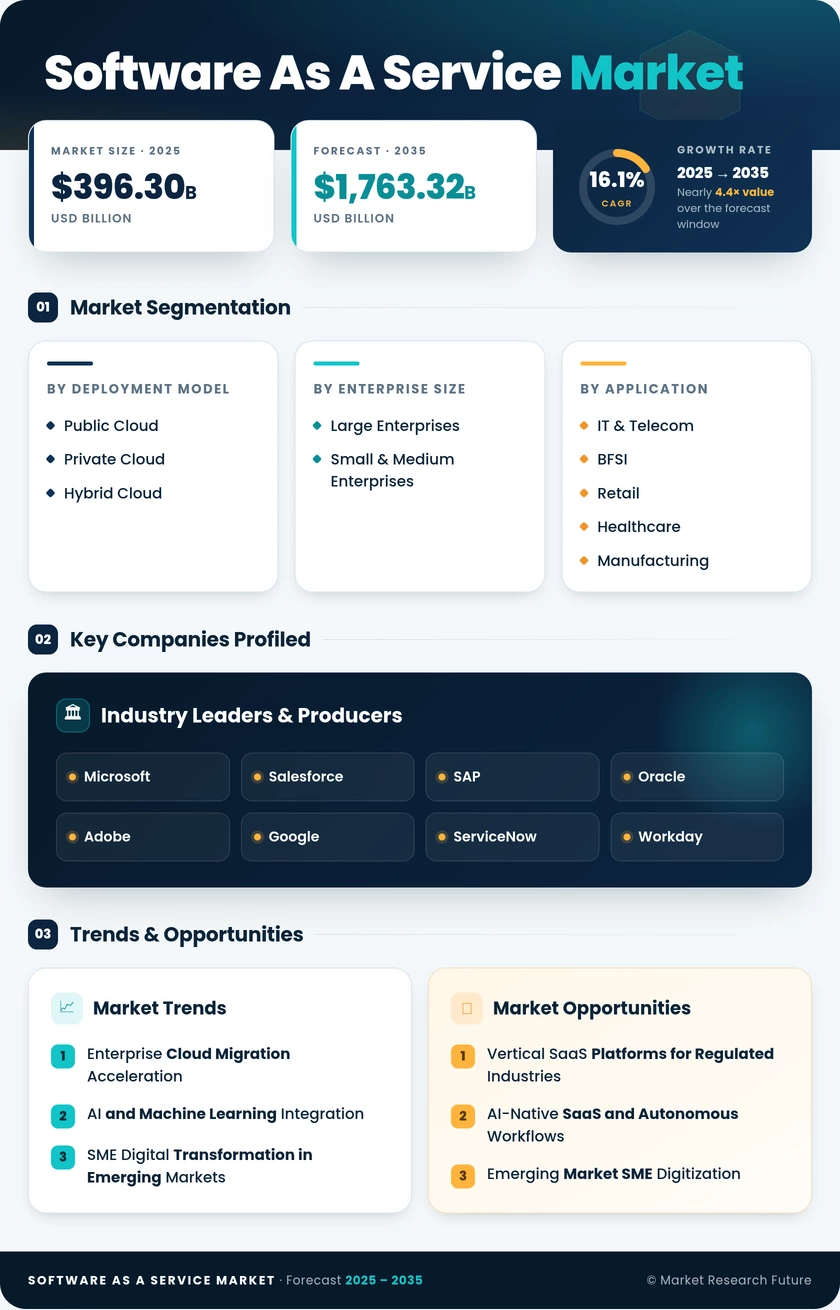
| Deployment Model | Public Software as a Service Market, Private Software as a Service Market, Hybrid Software as a Service Market | Public Software as a Service Market | Hybrid Software as a Service Market |
| Enterprise Size | Large Enterprises, Small & Medium Enterprises | Large Enterprises | Small & Medium Enterprises |
| Application | CRM, ERP, HCM, Collaboration & Communication, Security & Compliance, BI & Analytics, Others | Customer Relationship Management | Security & Compliance |
| Pricing Model | Subscription, Usage-Based, Freemium, License-Hybrid | Subscription | Usage-Based |
| End-User Vertical | IT & Telecom, BFSI, Retail, Software as a Service Market, Manufacturing, Others | IT & Telecom | Software as a Service Market |
Market Segmentation Overview
By Deployment Model
| Sub-Segment | Key Trend |
| Public Software as a Service Market | Dominant delivery model driven by hyperscaler scale and managed services |
| Private Software as a Service Market | Preferred by regulated enterprises requiring dedicated infrastructure |
| Hybrid Software as a Service Market | Fastest-growing model enabling flexible data residency and workload portability |
Public cloud continues to serve as the primary infrastructure for SaaS delivery globally, though hybrid approaches are gaining share as data sovereignty rules expand across jurisdictions.
By Enterprise Size
| Sub-Segment | Key Trend |
| Large Enterprises | Multi-suite platform consolidation is driving per-seat ARPU increases |
| Small & Medium Enterprises | Product-led growth and freemium models are expanding the addressable base |
SME adoption is accelerating as low-friction onboarding and affordable per-user pricing dismantle traditional barriers to enterprise-grade software.
By Application
| Sub-Segment | Key Trend |
| Customer Relationship Management | AI-enhanced sales intelligence and predictive analytics |
| Enterprise Resource Planning | Software as a Service Market ERP migration from legacy SAP and Oracle on-premises |
| Human Capital Management | Remote workforce management and payroll automation |
| Collaboration & Communication | Hybrid work infrastructure standardization |
| Security & Compliance | Zero-trust architecture and regulatory mandate acceleration |
| Business Intelligence & Analytics | Self-service analytics and embedded data visualization |
| Others | Vertical-specific SaaS for legal, education, and real estate |
CRM and ERP collectively account for the largest revenue concentration, while security and compliance applications are outpacing all other categories in growth rate.
By Pricing Model
| Sub-Segment | Key Trend |
| Subscription (Per-Seat/Per-Tier) | Stable revenue backbone with predictable billing cycles |
| Usage-Based (Consumption) | Surging in API-driven and infrastructure SaaS categories |
| Freemium | Product-led growth engine for SME market penetration |
| License-Hybrid | Transition model for legacy vendors moving to the cloud |
Usage-based pricing is fundamentally reshaping SaaS unit economics, particularly in developer tools and data infrastructure segments where consumption aligns directly with customer value realization.
By End-User Vertical
| Sub-Segment | Key Trend |
| IT & Telecom | DevOps, ITSM, and observability platform adoption |
| BFSI | Regulatory compliance, digital banking, and risk management SaaS |
| Retail | Omnichannel commerce, POS, and inventory management |
| Software as a Service Market | EHR modernization, telehealth, and clinical trial management |
| Manufacturing | Supply chain SaaS, predictive maintenance, and MES |
| Other End-User Verticals | Education, government, logistics, and real estate |
Software as a Service Market stands out as the fastest-growing vertical, driven by regulatory mandates for cloud-validated solutions in electronic health records and clinical data management.