Segmentation Quick Reference
| Dimension | Sub-Segments | Dominant Segment | Fastest Growing Segment |
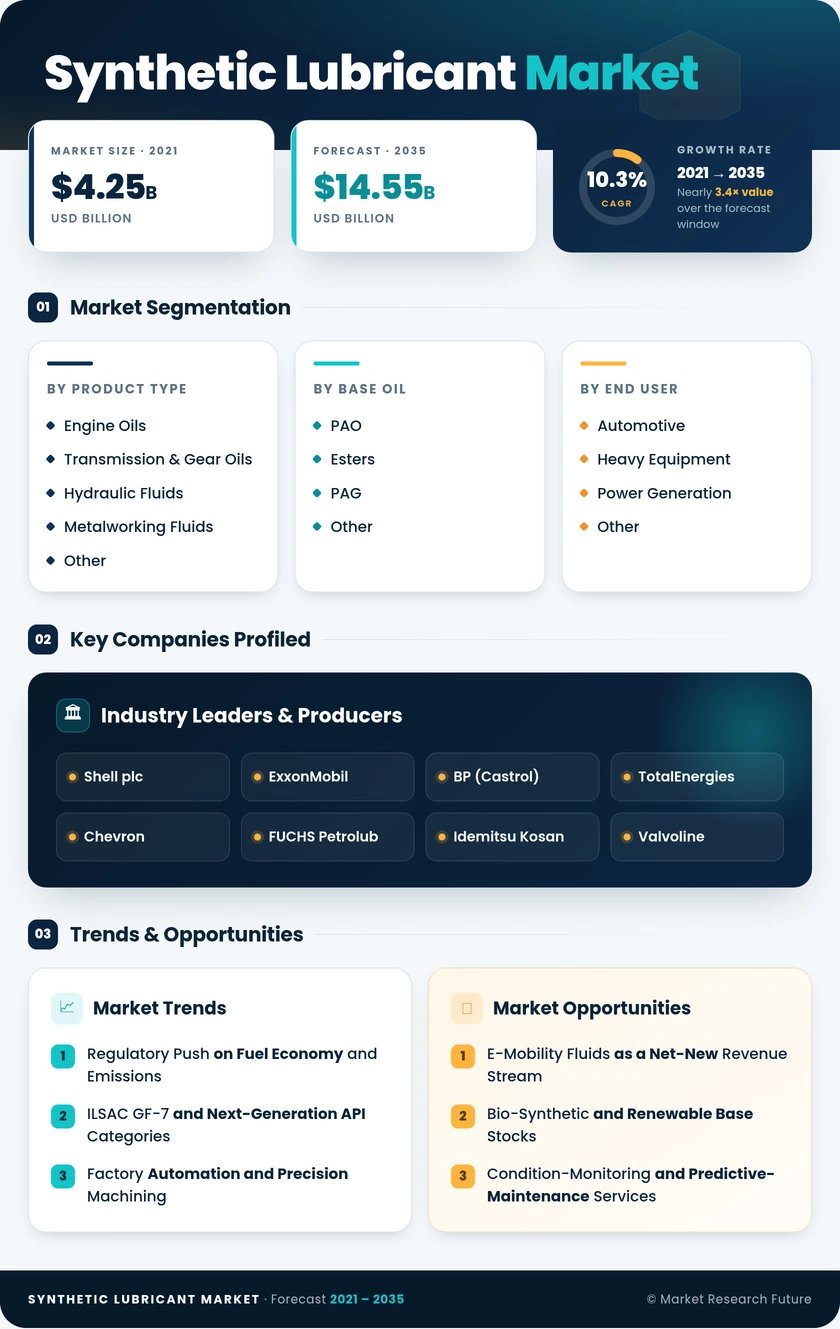
| By Product Type | Engine Oils; Transmission & Gear Oils; Hydraulic Fluids; Metalworking Fluids; Other | Engine Oils (36.5% share, 2025) | Metalworking Fluids (11.6% CAGR) |
| By Base Oil | PAO; Esters; PAG; Other | PAO (49.0% share, 2025) | PAG (11.7% CAGR) |
| By End User | Automotive; Heavy Equipment; Power Generation; Other | Automotive (38.0% share, 2025) | Heavy Equipment (11.1% CAGR) |
| By Region | Asia-Pacific; North America; Europe; South America; MEA | Asia-Pacific (43.0% share, 2025) | Asia-Pacific (11.4% CAGR) |
Market Segmentation Overview
By Product Type
| Sub-Segment | Key Trend |
| Engine Oils | GF-7 and ACEA C6 mandates converting semi-synthetic to full-synthetic fills |
| Transmission & Gear Oils | Proliferation of dual-clutch and CVT transmissions requiring low-viscosity synthetics |
| Hydraulic Fluids | Industrial automation driving demand for high-VI, shear-stable formulations |
| Metalworking Fluids | Five-axis CNC and additive-manufacturing post-processing creating the fastest growth |
| Other (Greases, Compressor, Turbine) | Wind-turbine gearbox greases and refrigeration compressor oils driving niche volumes |
Engine oils dominate the product-type dimension, reflecting global OEM first-fill requirements and the massive aftermarket replacement cycle for passenger and commercial vehicles. Metalworking fluids represent the highest-growth pocket, propelled by the expansion of precision manufacturing across Asia-Pacific and European automotive supply chains.
By Base Oil
| Sub-Segment | Key Trend |
| Polyalpha-Olefin (PAO) | Metallocene-catalyst production reducing costs and broadening mid-tier penetration |
| Esters | Rising demand for biodegradable formulations in marine and forestry applications |
| Polyalkylene Glycol (PAG) | Transition to low-GWP refrigerants driving compressor-oil reformulation |
| Other (PAG Blends, Silicones, PIB) | Specialty applications in extreme-temperature and vacuum environments |
PAO holds the largest base-oil share, valued for its wide operating-temperature range and additive compatibility. PAG is the fastest-growing base-oil type, benefiting from regulatory transitions in HVAC-R systems and expanding food-grade lubrication requirements.
By End User
| Sub-Segment | Key Trend |
| Automotive | Extended drain-interval mandates and e-axle fluids expanding synthetic adoption |
| Heavy Equipment | Global infrastructure spending pipeline supporting hydraulic and gear oil demand |
| Power Generation | Wind-turbine fleet growth and gas-turbine efficiency programs driving volumes |
| Other (Marine, Aerospace, Food) | Compliance-driven segments with high margins and specialized formulation needs |
Automotive remains the largest end-user segment, though its share will gradually moderate as the vehicle parc electrifies. Heavy equipment is the fastest-growing category, underpinned by sustained government infrastructure programs in Asia-Pacific, the Middle East, and South America.