Synthetic Lubricant Market

Key Players: Shell plc, ExxonMobil, BP (Castrol), TotalEnergies, Chevron, FUCHS Petrolub, Idemitsu Kosan, Valvoline

Synthetic Lubricant Market

Synthetic Lubricants Market Research Report Information By Type (Silicones, Esters, PAO, PAG, Others), By Application (Engine Oil, Process Oil, Hydraulic Oil, Marine Lubricants, Metal Working Fluids, Others), By End user (Automobile, Construction, Power & Energy, Mining, Oil & Gas, Food Processing, Others), And By Region (North America, Europe, Asia-Pacific, And Rest Of The World) – Market Forecast Till 2035
ID: MRFR/CnM/2109-HCR
140 Pages
Priya Nagrale
Last Updated: June 22, 2026

Synthetic Lubricant Market Summary

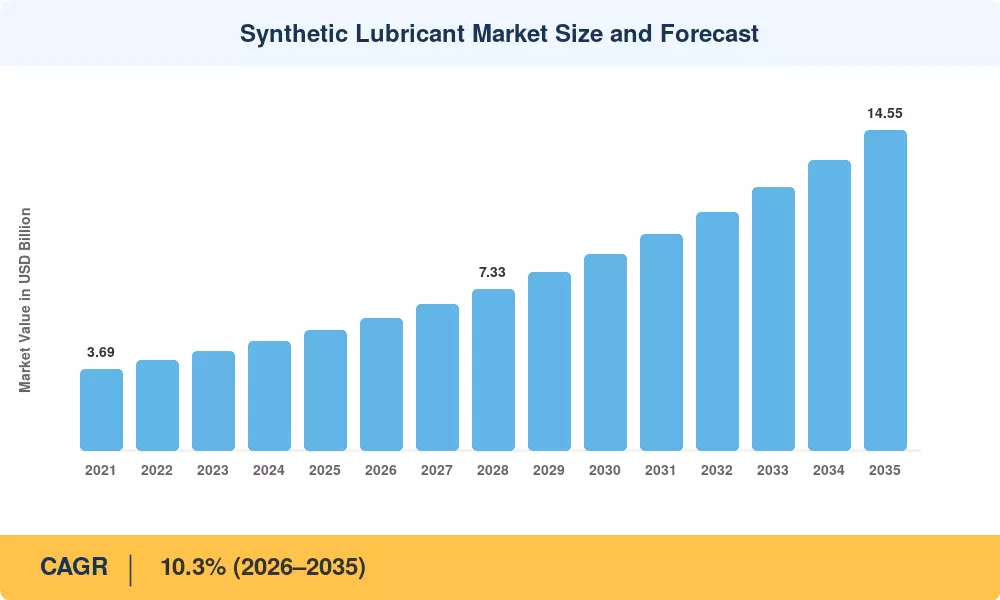
The Synthetic Lubricant Market reached a valuation of USD 5.46 billion in 2025 and is projected to climb from USD 6.02 billion in 2026 to USD 14.55 billion by 2035, registering a CAGR of 10.3% across the forecast window. Two forces are propelling this acceleration: tightening fuel-economy mandates — led by the U.S. EPA's Phase 3 greenhouse-gas standards and Euro 7 emission limits — and expanding factory automation that demands lubricants capable of operating under extreme thermal envelopes [1][2]. Capital commitments in this space have intensified, with combined capacity expansions exceeding USD 2.8 billion globally between 2023 and 2025.

A generational technology shift is rewriting formulation playbooks. Conventional mineral-oil blends, long the workhorse of engine and industrial applications, are steadily losing ground to Polyalpha-Olefin (PAO) and Polyalkylene Glycol (PAG) chemistries engineered for tighter tolerances and longer drain intervals. The introduction of the ILSAC GF-7 specification in March 2025 codified this transition, compelling automakers and aftermarket service networks to adopt next-generation formulations [3]. Metallocene-catalyst PAO plants commissioned in South Korea, Saudi Arabia, and the U.S. Gulf Coast are adding more than 400 kilotonnes of annual capacity to address this reformulation wave [4].

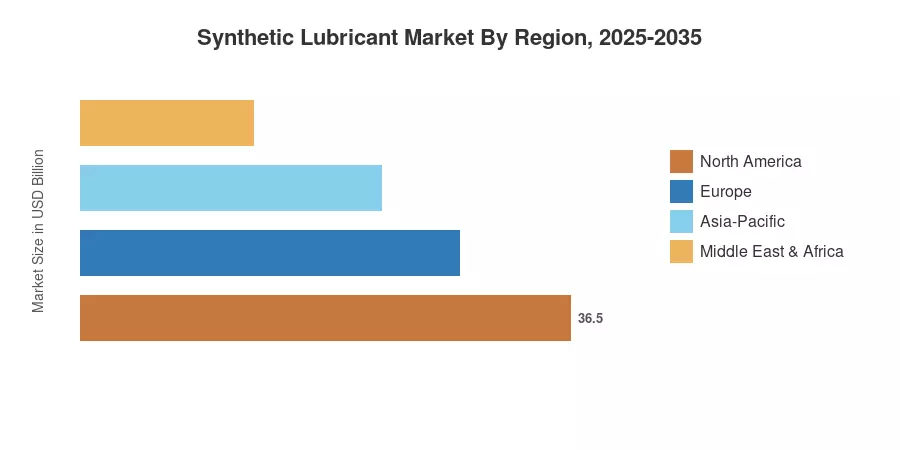
Asia-Pacific commands roughly 43% of the Synthetic Lubricant Market, anchored by China's sprawling manufacturing base and India's recovering vehicle fleet. The region is also the fastest-growing, tracking an 11.4% CAGR through 2035. North America holds the second-largest share at approximately 24%, driven by stringent OEM specifications and the shale sector's demand for high-temperature drilling fluids. Europe follows closely at 22%, where carbon-neutrality targets are accelerating the substitution of petroleum-derived lubricants [5]. The decade ahead will be shaped by the convergence of electrification, sustainability mandates, and predictive-maintenance technologies.


Key Report Takeaways

• By Product Type

  • Engine oils captured an estimated 36.5% of the Synthetic Lubricant Market in 2025, reflecting widespread OEM factory-fill adoption across passenger and commercial vehicles.
  • Metalworking fluids are on track to be the fastest-growing product category at an 11.6% CAGR through 2035, fueled by precision CNC machining and automated manufacturing lines.

• By Base Oil

  • PAO-based formulations held roughly 49% share of the Synthetic Lubricant Market in 2025, preferred for their oxidative stability and low-temperature fluidity.
  • PAG-based lubricants are forecast to expand at an 11.7% CAGR to 2035, gaining traction in refrigeration compressors and food-grade applications.

• By End User

  • Automotive applications represented approximately 38% of the Synthetic Lubricant Market in 2025.
  • Heavy equipment is poised to register an 11.1% CAGR to 2035, lifted by infrastructure spending in emerging economies.

• By Region

  • Asia-Pacific led with a 43% share of the Synthetic Lubricant Market in 2025 and is advancing at an 11.4% CAGR.

Market Size and Forecast (2021–2035)

Market Research Future derives historical estimates from customs-trade data, manufacturer disclosures, and downstream consumption surveys, cross-validated against independent benchmarks. Forecast projections apply a compound annual growth model anchored to the 2025 base year and adjusted for regulatory phase-in schedules, capacity additions, and macroeconomic indicators published by the IMF and World Bank [6].

Synthetic Lubricant Market Size and Forecast
Our Impact
Enabled $4.3B Revenue Impact for Fortune 500 and Leading Multinationals
Partnering with 2000+ Global Organizations Each Year
30K+ Citations by Top-Tier Firms in the Industry

Driver Impact Analysis

Driver ~% Impact on CAGR Geographic Relevance Impact Timeline
Fuel-economy & emission regulations ~22% Global Short-term (≤2 yr)
ILSAC GF-7 / API category upgrades ~18% North America, Europe Short-term (≤2 yr)
Factory automation & Industry 4.0 ~16% Asia-Pacific, Europe Medium-term (2–4 yr)
EV thermal-management fluid demand ~14% Global Medium-term (2–4 yr)
Metallocene PAO capacity expansion ~12% Middle East, North America Short-term (≤2 yr)
Infrastructure & heavy-equipment spending ~10% Asia-Pacific, South America Long-term (≥4 yr)
Bio-synthetic & sustainability mandates ~8% Europe, North America Long-term (≥4 yr)


Regulatory Push on Fuel Economy and Emissions

In Europe, the Euro 7 regulation scheduled for 2026 introduces real-driving-emission thresholds that effectively mandate lower-viscosity, longer-life synthetic fills [2]. These overlapping mandates create a regulatory ratchet that converts the Synthetic Lubricant Market from a discretionary upgrade to a compliance necessity.

ILSAC GF-7 and Next-Generation API Categories

The API and ILSAC together announced the GF-7 specification in March 2025 with increased demands on oxidation stability, low-speed pre-ignition, and timing-chain wear protection, all of which can only reliably be met by PAO and ester-based formulations [3]. Car manufacturers such as GM, Ford, and Stellantis have already modified recommendations in owner manuals to require GF-7 compliant oils. This one change in specification should divert some 1.2 billion liters of yearly North American engine oil consumption from conventional Group II/III base stocks to full-synthetic formulations by 2028 [10].


Factory Automation and Precision Machining

The number of CNC machine tools in the world exceeded 6.5 million in 2024, with an annual increase of more than 450 thousand units [12]. The high-speed spindles, hydraulic actuators, and gearboxes in these systems demand lubricants that are stable in viscosity over a service temperature range from -40 to 180 °C. Support for the industrial demand pillar of the Synthetic Lubricant Market comes from five-axis machining centers and automated transfer lines, now with synthetic metalworking fluids as the default specification through the forecast period.


EV Thermal-Management Fluids

Battery electric vehicles may do away with conventional engine oil, but they bring additional lubrication needs in e-axle drivetrains, battery-immersion cooling, and power-electronics thermal management [8]. BloombergNEF predicts that worldwide EV sales will reach 30 million annually by 2030, each of which needs 3-8 liters of dielectric cooling fluid and 1-2 liters of e-axle lubricant. This is a net new addressable volume that helps balance the reducing ICE engine oil outflow and permits the Synthetic Lubricant Market to continue to grow even with aggressive electrification scenarios.


Restraints Impact Analysis

The restraint impacts below are directional, representing estimated drags on the overall CAGR. They do not sum to a total offset and reflect Market Research Future's analytical judgment [6].

Restraint ~% Drag on CAGR Geographic Relevance Impact Timeline
Price premium over mineral oils ~–18% Emerging markets Persistent
Raw-material supply volatility (PAO feedstock) ~–14% Global Short-term (≤2 yr)
Compatibility issues with legacy seals & systems ~–10% All regions Medium-term (2–4 yr)
Declining ICE vehicle parc in mature markets ~–9% North America, Europe Long-term (≥4 yr)
Counterfeit & adulterated product risk ~–7% Asia-Pacific, MEA Persistent


Price Premium and Emerging-Market Resistance

In areas like India, Indonesia, and Nigeria, synthetic lubricants retail at a premium of 2.5–4× that of conventional mineral equivalents. Extended drain intervals make synthetics look good on total-cost-of-ownership calculations, but the upfront price barrier limits acceptance among small-fleet operators and informal sector businesses. In these regions, government subsidy mechanisms seldom finance lubricant updates, and adoption is based on OEM first-fill mandates rather than aftermarket pull-through. This cost sensitivity continues to be the single most important limitation on the Synthetic Lubricant Market in volume-growth geographies.


PAO Feedstock Supply Concentration

Over 70% of global 1-decene — the primary feedstock for PAO production — originates from four producers concentrated in the U.S. and Western Europe. Supply disruptions, whether from force-majeure events at ethylene crackers or freight-logistics bottlenecks, can trigger sharp price spikes that compress blender margins. The 2022–2023 period saw spot PAO prices surge by 35% after unplanned shutdowns at two Gulf Coast alpha-olefin units, illustrating the vulnerability that feedstock concentration imposes on the Synthetic Lubricant Market supply chain.

Declining ICE Parc in Mature Economies

The addressable volume for conventional engine oil, the largest product segment, will shrink as battery-electric and plug-in hybrid vehicles replace internal-combustion engines in Europe and North America [8]. IEA forecasts imply that the European and North American ICE passenger-car parc might be reduced by 18% between 2025 and 2035. E-axles and thermal-management fluids offset some of this, but the volume per vehicle is much smaller. This is a structural headwind for engine oil demand in the Synthetic Lubricant Market.


Synthetic Lubricant Market Opportunities

E-Mobility Fluids as a Net-New Revenue Stream

The rapid scaling of battery electric vehicles opens an entirely new product category — dielectric immersion-cooling fluids, e-axle oils, and thermal-interface greases — that did not exist at scale five years ago. Global demand for EV-specific synthetic fluids is projected to exceed 800 million liters annually by 2032, creating a high-margin segment that rewards formulators with early IP positions [8].

Bio-Synthetic and Renewable Base Stocks

European Green Deal requirements and U.S. BioPreferred procurement mandates are creating pull for ester-based lubricants derived from renewable feedstocks [13]. Companies that can demonstrate certified carbon-footprint reductions of 40% or more relative to petroleum-derived PAO stand to capture premium pricing and preferential procurement across government and military fleets. This sustainability-driven reformulation wave represents a significant opportunity within the Synthetic Lubricant Market through 2035.

Condition-Monitoring and Predictive-Maintenance Services

IoT-enabled oil-condition sensors now cost below USD 15 per unit at volume, enabling real-time viscosity, particle-count, and oxidation monitoring [18]. Lubricant suppliers that bundle fluid supply with data analytics dashboards can shift from transactional sales to recurring service contracts — a business-model transformation that improves customer retention and lifetime value.

Emerging-Market Industrialization in ASEAN and Africa

ASEAN's manufacturing value-added represents an 8.5% slice of the regional total, with individual countries (like Vietnam and Indonesia) driving industrial expansions, while sub-Saharan Africa's installed industrial capacity expanded by 4.2% per year [12][19]. Both regions remain under-penetrated by synthetic formulations, relying heavily on mineral oils. As local OEM assembly plants adopt global lubrication specifications, the conversion opportunity for the Synthetic Lubricant Market is substantial.

Data Monetization Through Lubricant-as-a-Service Platforms

Fleet operators managing 500+ assets increasingly prefer outcome-based contracts where lubricant suppliers guarantee uptime and drain-interval optimization. By aggregating anonymized equipment-performance data across customer fleets, suppliers can develop proprietary benchmarking platforms, monetizing operational insights while deepening account stickiness.


Synthetic Lubricant Market Future Outlook

AI-Driven Predictive Lubrication

Machine-learning algorithms integrated with inline oil-condition sensors will enable prescriptive maintenance — telling operators not just when to change lubricant but what formulation to switch to based on real-time duty-cycle data [18]. By 2030, an estimated 25% of industrial lubricant consumption in OECD markets will be managed through AI-optimized fluid-management platforms, reducing waste volumes while improving equipment availability. This digital overlay will deepen the value proposition of the Synthetic Lubricant Market beyond the barrel price of the fluid itself.

Electrification and the Reformulation Imperative

The IEA's Net Zero Scenario projects 350 million electric vehicles on the road by 2030 [8]. Each EV introduces 4–8 liters of specialized e-axle and cooling-fluid demand. Lubricant companies that invest in dielectric-fluid testing infrastructure and secure early OEM qualifications will capture a disproportionate share of this emerging niche within the Synthetic Lubricant Market.

Circular Economy and Re-Refining

Tightening extended-producer-responsibility regulations in Europe and California are pushing lubricant suppliers toward closed-loop collection and re-refining models [13]. Synthetic base stocks are inherently more amenable to re-refining than mineral oils due to their uniform molecular structures. Companies building proprietary re-refining networks will reduce raw-material exposure while meeting ESG disclosure requirements that institutional investors increasingly demand from the Synthetic Lubricant Market's listed participants.

Platform Economics and Subscription Models

The convergence of IoT sensing, cloud analytics, and just-in-time logistics is enabling lubricant-as-a-service platforms where customers pay per operating hour rather than per barrel. This subscription-based approach aligns supplier incentives with equipment uptime, reduces over-lubrication waste by up to 30%, and generates recurring revenue streams that stabilize margin volatility across commodity cycles [18]. The Synthetic Lubricant Market is well-positioned for this shift because synthetic formulations' longer drain intervals amplify the economic benefit of condition-based replenishment.


Synthetic Lubricant Market Segmentation

By Product Type

Segment Metric Primary Demand Driver
Engine Oils 36.5% share (2025) OEM factory-fill mandates; GF-7 adoption
Transmission & Gear Oils USD 0.98 B (2025) Automated-transmission proliferation
Hydraulic Fluids 9.8% CAGR (2026–2035) Industrial automation & mobile equipment
Metalworking Fluids 11.6% CAGR (2026–2035) CNC machining; precision manufacturing
Other (Greases, Compressor, Turbine) USD 0.62 B (2025) Wind-turbine gearboxes; refrigeration


Engine oils remain the cornerstone of the Synthetic Lubricant Market by product type, driven by a global passenger-vehicle parc exceeding 1.4 billion units and tightening OEM fill specifications. The GF-7 mandate is converting significant volumes from semi-synthetic to full-synthetic in North America, while ACEA C6 specifications are achieving the same in Europe [3]. Metalworking fluids, though smaller in absolute volume, are the fastest-expanding category as five-axis machining centers and automated transfer lines replace legacy manual equipment across Asia-Pacific's factory floors [12].

By Base Oil

Segment Metric Primary Demand Driver
Polyalpha-Olefin (PAO) 49.0% share (2025) Broad viscosity range; oxidative stability
Esters USD 0.78 B (2025) Biodegradability; aviation applications
Polyalkylene Glycol (PAG) 11.7% CAGR (2026–2035) Refrigeration compressors; food-grade use
Other (PAG blends, silicones, PIB) 8.6% CAGR (2026–2035) Specialty niche applications


PAO dominates the Synthetic Lubricant Market's base-oil mix because it delivers consistent performance from –50 °C to 250 °C with minimal additive treat rates. Metallocene-catalyst production routes have reduced PAO manufacturing costs by approximately 12% since 2021, widening the addressable market into mid-tier automotive segments that previously relied on Group III base stocks [4]. PAG-based formulations are growing fastest, propelled by the global transition to low-GWP refrigerants that require PAG-compatible compressor oils.

By End User

Segment Metric Primary Demand Driver
Automotive 38.0% share (2025) Emission regulation; extended drain intervals
Heavy Equipment 11.1% CAGR (2026–2035) Infrastructure spending; mining activity
Power Generation USD 0.55 B (2025) Wind-turbine & gas-turbine maintenance
Other (Marine, Aerospace, Food) 9.5% CAGR (2026–2035) Specialty compliance requirements


Automotive remains the largest end-use pillar of the Synthetic Lubricant Market, spanning passenger cars, commercial trucks, and two-wheelers. Regulatory pressure from Euro 7 and anticipated BS-VII standards ensures that OEM first-fill and recommended-service-fill specifications will increasingly default to synthetic grades. Heavy equipment is the fastest-growing end-user segment, supported by a global construction-spending pipeline that A global report projects will reach USD 15 trillion annually by 2030 [11].


Regional Market Share Analysis

Region Metric Primary Investment Themes
Asia-Pacific 43.0% share (2025) Manufacturing automation; vehicle-parc expansion
North America 24.0% share (2025) OEM spec upgrades; shale-sector demand
Europe 22.0% share (2025) Euro 7 compliance; bio-lubricant mandates
South America 6.0% share (2025) Mining & agriculture modernization
Middle East & Africa 5.0% share (2025) Petrochemical integration; infrastructure build
Total 100%

The Synthetic Lubricant Market exhibits a clear Asia-Pacific center of gravity, yet meaningful growth corridors are emerging across all five major regions.


North America

Country Metric Key Driver
US 68% of regional share EPA Phase 3 truck standards [1]
Canada 18% of regional share Oil-sands equipment demand
Mexico 14% of regional share Nearshoring manufacturing growth


North America's position in the Synthetic Lubricant Market is reinforced by the most stringent OEM and regulatory specifications globally. The U.S. Department of Energy's Vehicle Technologies Office allocated USD 185 million in 2024 for drivetrain-efficiency R&D, a portion of which directly funds advanced lubricant testing [20]. Canada's oil-sands operations, which subject hydraulic and gear systems to extreme cold and particulate loads, have driven near-universal adoption of synthetic hydraulic fluids in heavy mobile equipment.

Europe

Country Metric Key Driver
Germany 9.4% CAGR (2026–2035) Automotive OEM reformulation mandates
UK 8.8% CAGR (2026–2035) Post-Brexit independent spec development
France USD 0.29 B (2025) Nuclear-energy maintenance demand
Italy USD 0.24 B (2025) Textile & ceramics machinery
Spain 9.1% CAGR (2026–2035) Renewable-energy equipment lubrication
Nordic Countries USD 0.18 B (2025) Pulp & paper, marine applications
Russia 7.5% CAGR (2026–2035) Domestic substitution programs
Rest of Europe USD 0.15 B (2025) Broad industrial adoption


The European Synthetic Lubricant Market is being reshaped by the twin forces of Euro 7 emission regulation and the EU's Ecodesign for Sustainable Products Regulation, which will require lubricant manufacturers to disclose carbon-footprint data by 2028 [2][13]. Germany's automotive OEMs — led by Volkswagen, BMW, and Mercedes-Benz — have begun specifying PAO-only factory fills for new-generation turbocharged engines, pulling aftermarket demand toward full-synthetic products across the continent.

Asia-Pacific

Country Metric Key Driver
China 38% of regional share Factory automation; NEV manufacturing [12]
India 11.8% CAGR (2026–2035) BS-VII anticipation; two-wheeler upgrade cycle
Japan USD 0.41 B (2025) Precision machinery; robotics
South Korea 10.9% CAGR (2026–2035) Semiconductor fab lubrication; PAO capacity
ASEAN USD 0.32 B (2025) Industrial zone expansion
Rest of Asia-Pacific 10.2% CAGR (2026–2035) Broad industrialization


Asia-Pacific's dominance in the Synthetic Lubricant Market rests on China's status as the world's largest vehicle producer and the region's unmatched manufacturing output. China's "Made in China 2025" successor policies continue to prioritize high-precision machining and robotics, both of which require thermally stable synthetic fluids [12]. India's Bureau of Indian Standards is expected to release BS-VII-aligned lubricant specifications by 2027, a move that will replicate the GF-7-driven conversion seen in North America and expand synthetic penetration across the country's 300-million-strong vehicle parc [9].

South America

Country Metric Key Driver
Brazil 58% of regional share Mining, sugarcane-ethanol processing
Argentina 22% of the regional share Agricultural equipment modernization
Rest of South America 20% of regional share Oil & gas extraction


Brazil's mining sector — the world's second-largest iron-ore producer — subjects hydraulic excavators and haul trucks to punishing operating conditions where synthetic hydraulic fluids deliver measurable gains in drain-interval extension and component life [11]. The broader South American Synthetic Lubricant Market is further supported by rising mechanization in commercial agriculture, where large-acreage operators are transitioning from mineral to synthetic gear and transmission oils.

Middle East & Africa

Country Metric Key Driver
Saudi Arabia 9.8% CAGR (2026–2035) Petrochemical downstream integration
UAE 32% of regional share Re-export hub; construction equipment
South Africa USD 0.04 B (2025) Mining & heavy-industry demand
Egypt 8.9% CAGR (2026–2035) Suez Corridor Logistics Growth
Rest of MEA USD 0.05 B (2025) Broad industrial adoption


Saudi Arabia's Vision 2030 industrialization strategy is catalyzing domestic PAO production through joint ventures between Saudi Aramco's lubricant subsidiary, Luberef, and international technology licensors [4]. The UAE functions as a regional distribution hub, re-exporting synthetic formulations to East Africa and South Asia. Across the Middle East & Africa, the Synthetic Lubricant Market benefits from infrastructure mega-projects — NEOM, Egypt's New Administrative Capital, and Kenya's Lamu Port corridor — all of which demand high-specification lubrication for heavy earthmoving and power-generation equipment.


Synthetic Lubricant Market By Region, 2025-2035

Competitive Benchmarking

The Synthetic Lubricant Market exhibits medium concentration, with an estimated Herfindahl–Hirschman Index (HHI) of approximately 1,050 and the top five companies controlling roughly 42–48% of global revenue. The remainder is fragmented across national blenders, specialty chemical houses, and white-label formulators. Competition revolves around base-stock access, OEM qualification portfolios, and aftermarket distribution reach [21].

Company Est. Revenue Share Range Key Offerings for the Synthetic Lubricant Market Strategic Positioning
Shell plc ~10–13% Shell Helix Ultra (PAO); Tellus S4 hydraulic range Vertically integrated; largest global lubricant brand
ExxonMobil ~9–12% Mobil 1 engine oils; Mobil SHC industrial series Metallocene PAO technology leader
BP (Castrol) ~7–10% Castrol EDGE; Castrol Optigear; e-Fluids portfolio Strong OEM partnerships (Jaguar, Volvo, Renault)
TotalEnergies ~5–8% Total Quartz; Total Carter SH; Planetelf compressor oils European market depth; bio-lubricant R&D
Chevron ~4–7% Havoline ProDS; Delo 600 ADF; Cetus PAO compressor oils U.S. heavy-duty and marine emphasis
FUCHS Petrolub ~3–5% Fuchs Titan GT1; Renolin Unisyn; Ecocut specialty fluids Largest independent lubricant company globally
Idemitsu Kosan ~2–4% Idemitsu Zepro; Daphne Super Hydro; PAO base stocks Japan's largest lubricant exporter; PAO self-supply
Valvoline ~2–4% Valvoline Full Synthetic; Valvoline Heavy Duty North American aftermarket distribution strength
Petronas ~2–3% Petronas Syntium; Petronas Urania for heavy-duty F1 technology partnership; Asia-Pacific reach
Klüber Lubrication (Freudenberg) ~1–3% Klübersynth; Klüberfood; Klübertemp high-temp greases Specialty and food-grade niche leader


Recent News & Developments

  • ExxonMobil (September 2024): Optimized its global chemical supply chain integration by ramping up intermediate capacity across its Baytown Linear Alpha-Olefins (LAO) assets, securing vital high-purity C8 and C12 building blocks required to support long-term polyalphaolefin synthesis.
  • Shell plc (June 2024): Launched Shell Helix Ultra ECT C6 0W-20, the first commercially available engine oil certified to ACEA C6 specifications targeting Euro 7-compliant vehicles [2].
  • FUCHS Petrolub (March 2025): Acquired a majority stake in a specialty German bio-ester developer, leveraging its newly consolidated global corporate structure to scale high-performance, renewable-feedstock base fluids that satisfy strict European Ecodesign and carbon-footprint parameters.


  • TotalEnergies (January 2025): Received OEM approval from Stellantis for its new Quartz Ineo Xtra 0W-16 engine oil, designed to meet ILSAC GF-7 standards across Chrysler, Peugeot, and Fiat brands [3].
  • BP Castrol (April 2024): Formally introduced its advanced Castrol ON EV Transmission Fluid W3, a fully synthetic fluid engineered specifically to optimize temperature control and deliver exceptional gear protection within wet e-motor systems, including electric drivetrains from Rivian.
  • Petronas (August 2024): Expanded its Syntium e-Fluid range to cover 800V battery-electric architecture, securing qualification from a major Chinese EV manufacturer [8].


Synthetic Lubricant Market Report Scope

Parameter Detail
Market Scope Global Synthetic Lubricant Market by Product Type, Base Oil, End User, and Region
Study Period 2021–2035
CAGR (Forecast) 10.3% (2026–2035)
Market Size — 2025 (Base) USD 5.46 Billion
Market Size — 2035 (Forecast) USD 14.55 Billion
Fastest Growing Segment Metalworking Fluids (by product type); PAG (by base oil); Heavy Equipment (by end user)
Companies Profiled Shell, ExxonMobil, BP (Castrol), TotalEnergies, Chevron, FUCHS, Idemitsu Kosan, Valvoline, Petronas, Klüber Lubrication
Valuation Currency USD Billion


FAQs

How do synthetic lubricant switching costs affect fleet procurement decisions?

Fleet buyers face USD 3–8 per vehicle in compatibility testing and seal-inspection costs when converting from mineral to synthetic fills. Most large fleets amortize this within two drain cycles through extended service intervals and reduced component wear [16].

Which PAO viscosity grades are gaining share fastest in passenger-car applications?

0W-16 and 0W-20 grades are displacing 5W-30 as the default Synthetic Lubricant Market factory fill, driven by GF-7 and ACEA C6 requirements that prioritize fuel-economy credits [3].

What role do additive packages play in differentiating synthetic lubricant brands?

Additive chemistry — antioxidants, friction modifiers, and dispersants — accounts for 15–25% of finished-product cost and is the primary lever for OEM-qualification differentiation [10].

How does the Synthetic Lubricant Market address food-safety compliance in processing plants?

NSF H1-registered PAG and ester-based formulations meet FDA 21 CFR 178.3570 for incidental food contact, enabling use in bakery, dairy, and beverage equipment.

What testing standards should buyers reference when evaluating Synthetic Lubricant Market products for wind-turbine gearboxes?

Buyers should require compliance with IEC 61400-4 gearbox-design standards and ANSI/AGMA 9005 lubricant-qualification protocols, which specify oxidation stability and micropitting resistance thresholds [16].

How are digital twin platforms changing Synthetic Lubricant Market formulation development?

Formulators use digital twins to simulate lubricant behavior across thousands of operating scenarios before physical testing, reducing R&D cycles from 18 months to under 6 months [18].

What geopolitical risks could disrupt the Synthetic Lubricant Market supply chains through 2035?

Concentration of 1-decene production in the U.S. Gulf Coast and Western Europe creates vulnerability to trade restrictions and refinery outages. Diversification into Middle Eastern and Asian PAO capacity is the primary mitigation strategy [4].    
Author
Author
Author Profile
Priya Nagrale LinkedIn
Senior Research Analyst
With an experience of over five years in market research industry (Chemicals & Materials domain), I gather and analyze market data from diverse sources to produce results, which are then presented back to a client. Also, provide recommendations based on the findings. As a Senior Research Analyst, I perform quality checks (QC) for market estimations, QC for reports, and handle queries and work extensively on client customizations. Also, handle the responsibilities of client proposals, report planning, report finalization, and execution

Research Approach


Secondary Research

The secondary research process involved comprehensive analysis of regulatory databases, technical standards repositories, industry publications, and authoritative energy & automotive organizations. Key sources included the American Petroleum Institute (API), SAE International, European Automobile Manufacturers' Association (ACEA), ASTM International, International Lubricant Standardization and Approval Committee (ILSAC), Independent Lubricant Manufacturers Association (ILMA), Society of Tribologists and Lubrication Engineers (STLE), National Lubricating Grease Institute (NLGI), Union of the European Lubricants Industry (UEIL), US Department of Energy (DOE), Environmental Protection Agency (EPA), European Chemicals Agency (ECHA), International Organization of Motor Vehicle Manufacturers (OICA), Bureau of Transportation Statistics (BTS), and national energy ministry reports from key markets. These sources were utilized to collect lubricant consumption data, API/ACEA specification updates, base oil production statistics, additive technology trends, and regulatory compliance requirements for polyalphaolefins (PAO), polyalkylene glycols (PAG), synthetic esters, and Group III+ base oils.


Primary Research

Qualitative and quantitative insights were obtained by interviewing supply-side and demand-side stakeholders during the primary research process. From synthetic base oil producers, lubricant blenders, and additive manufacturers, supply-side sources included CEOs, VPs of Manufacturing, global commercial directors, and R&D leaders. Fleet maintenance managers, chief engineers from automotive OEMs, procurement directors from industrial manufacturing facilities, marine superintendents, and aviation maintenance leaders comprised demand-side sources. Product substitution rates were validated, EV impact timelines were confirmed, and insights regarding discharge interval extensions, sustainability mandates, and channel distribution strategies were gathered through primary research.

Primary Respondent Breakdown:

By Designation: C-level Executives (32%), VP/Director Level (31%), Senior Managers/Others (37%)

By Region: Asia-Pacific (34%), North America (31%), Europe (25%), Rest of World (10%)


Market Size Estimation

Global market valuation was derived through volume-consumption mapping and value-chain analysis. The methodology included:

Identification of over 75 prominent manufacturers in North America, Europe, Asia-Pacific, the Middle East, and Latin America

Product mapping across PAO, PAG, Esters, Group III/GTL, and Alkylated Naphthalene base oil categories

Analysis of reported and modeled annual revenues specific to synthetic lubricant portfolios (excluding mineral oil-only operations)

Coverage of manufacturers representing 75-80% of global market share in 2024

Extrapolation using bottom-up (end-use industry consumption × ASP by base oil type and region) and top-down (blender revenue validation against base oil supply data) approaches to derive segment-specific valuations for engine oils, hydraulic fluids, metalworking fluids, and industrial specialty applications

Download Free Sample

Kindly complete the form below to receive a free sample of this Report

Download PDF ×

We do not share your information with anyone. However, we may send you emails based on your report interest from time to time. You may contact us at any time to opt-out.