Request Free Sample ×

Kindly complete the form below to receive a free sample of this Report

* Please use a valid business email

Leading companies partner with us for data-driven Insights

clients tt-cursor
Hero Background

US Drilling Waste Management Market

ID: MRFR/EnP/13637-HCR
100 Pages
Garvit Vyas
Last Updated: April 06, 2026
US Drilling Waste Management Market Research Report By Service Type (Waste Treatment, Waste Disposal, Waste Recycling, Consulting), By Source of Waste (Drilling Operations, Reservoir Fluids, Completion and Workover Waste, Production Waste), By Technology (Solids Control, Cuttings Treatment, Thermal Desorption, Bioremediation) and By End User (Onshore, Offshore, Geothermal, Mining) - Forecast to 2035
Download PDF ×

We do not share your information with anyone. However, we may send you emails based on your report interest from time to time. You may contact us at any time to opt-out.

  1. 1 SECTION I: EXECUTIVE SUMMARY AND KEY HIGHLIGHTS
    1. 1.1 EXECUTIVE SUMMARY
      1. 1.1.1 Market Overview
      2. 1.1.2 Key Findings
      3. 1.1.3 Market Segmentation
      4. 1.1.4 Competitive Landscape
      5. 1.1.5 Challenges and Opportunities
      6. 1.1.6 Future Outlook
  2. 2 SECTION II: SCOPING, METHODOLOGY AND MARKET STRUCTURE
    1. 2.1 MARKET INTRODUCTION
      1. 2.1.1 Definition
      2. 2.1.2 Scope of the study
        1. 2.1.2.1 Research Objective
        2. 2.1.2.2 Assumption
        3. 2.1.2.3 Limitations
    2. 2.2 RESEARCH METHODOLOGY
      1. 2.2.1 Overview
      2. 2.2.2 Data Mining
      3. 2.2.3 Secondary Research
      4. 2.2.4 Primary Research
        1. 2.2.4.1 Primary Interviews and Information Gathering Process
        2. 2.2.4.2 Breakdown of Primary Respondents
      5. 2.2.5 Forecasting Model
      6. 2.2.6 Market Size Estimation
        1. 2.2.6.1 Bottom-Up Approach
        2. 2.2.6.2 Top-Down Approach
      7. 2.2.7 Data Triangulation
      8. 2.2.8 Validation
  3. 3 SECTION III: QUALITATIVE ANALYSIS
    1. 3.1 MARKET DYNAMICS
      1. 3.1.1 Overview
      2. 3.1.2 Drivers
      3. 3.1.3 Restraints
      4. 3.1.4 Opportunities
    2. 3.2 MARKET FACTOR ANALYSIS
      1. 3.2.1 Value chain Analysis
      2. 3.2.2 Porter's Five Forces Analysis
        1. 3.2.2.1 Bargaining Power of Suppliers
        2. 3.2.2.2 Bargaining Power of Buyers
        3. 3.2.2.3 Threat of New Entrants
        4. 3.2.2.4 Threat of Substitutes
        5. 3.2.2.5 Intensity of Rivalry
      3. 3.2.3 COVID-19 Impact Analysis
        1. 3.2.3.1 Market Impact Analysis
        2. 3.2.3.2 Regional Impact
        3. 3.2.3.3 Opportunity and Threat Analysis
  4. 4 SECTION IV: QUANTITATIVE ANALYSIS
    1. 4.1 Chemicals and Materials, BY Service Type (USD Million)
      1. 4.1.1 Waste Treatment
      2. 4.1.2 Waste Disposal
      3. 4.1.3 Waste Recycling
      4. 4.1.4 Consulting
    2. 4.2 Chemicals and Materials, BY Source of Waste (USD Million)
      1. 4.2.1 Drilling Operations
      2. 4.2.2 Reservoir Fluids
      3. 4.2.3 Completion and Workover Waste
      4. 4.2.4 Production Waste
    3. 4.3 Chemicals and Materials, BY Technology (USD Million)
      1. 4.3.1 Solids Control
      2. 4.3.2 Cuttings Treatment
      3. 4.3.3 Thermal Desorption
      4. 4.3.4 Bioremediation
    4. 4.4 Chemicals and Materials, BY End User (USD Million)
      1. 4.4.1 Onshore
      2. 4.4.2 Offshore
      3. 4.4.3 Geothermal
      4. 4.4.4 Mining
  5. 5 SECTION V: COMPETITIVE ANALYSIS
    1. 5.1 Competitive Landscape
      1. 5.1.1 Overview
      2. 5.1.2 Competitive Analysis
      3. 5.1.3 Market share Analysis
      4. 5.1.4 Major Growth Strategy in the Chemicals and Materials
      5. 5.1.5 Competitive Benchmarking
      6. 5.1.6 Leading Players in Terms of Number of Developments in the Chemicals and Materials
      7. 5.1.7 Key developments and growth strategies
        1. 5.1.7.1 New Product Launch/Service Deployment
        2. 5.1.7.2 Merger & Acquisitions
        3. 5.1.7.3 Joint Ventures
      8. 5.1.8 Major Players Financial Matrix
        1. 5.1.8.1 Sales and Operating Income
        2. 5.1.8.2 Major Players R&D Expenditure. 2023
    2. 5.2 Company Profiles
      1. 5.2.1 Halliburton (US)
        1. 5.2.1.1 Financial Overview
        2. 5.2.1.2 Products Offered
        3. 5.2.1.3 Key Developments
        4. 5.2.1.4 SWOT Analysis
        5. 5.2.1.5 Key Strategies
      2. 5.2.2 Schlumberger (US)
        1. 5.2.2.1 Financial Overview
        2. 5.2.2.2 Products Offered
        3. 5.2.2.3 Key Developments
        4. 5.2.2.4 SWOT Analysis
        5. 5.2.2.5 Key Strategies
      3. 5.2.3 Baker Hughes (US)
        1. 5.2.3.1 Financial Overview
        2. 5.2.3.2 Products Offered
        3. 5.2.3.3 Key Developments
        4. 5.2.3.4 SWOT Analysis
        5. 5.2.3.5 Key Strategies
      4. 5.2.4 National Oilwell Varco (US)
        1. 5.2.4.1 Financial Overview
        2. 5.2.4.2 Products Offered
        3. 5.2.4.3 Key Developments
        4. 5.2.4.4 SWOT Analysis
        5. 5.2.4.5 Key Strategies
      5. 5.2.5 Weatherford International (US)
        1. 5.2.5.1 Financial Overview
        2. 5.2.5.2 Products Offered
        3. 5.2.5.3 Key Developments
        4. 5.2.5.4 SWOT Analysis
        5. 5.2.5.5 Key Strategies
      6. 5.2.6 Severfield (GB)
        1. 5.2.6.1 Financial Overview
        2. 5.2.6.2 Products Offered
        3. 5.2.6.3 Key Developments
        4. 5.2.6.4 SWOT Analysis
        5. 5.2.6.5 Key Strategies
      7. 5.2.7 Aker Solutions (NO)
        1. 5.2.7.1 Financial Overview
        2. 5.2.7.2 Products Offered
        3. 5.2.7.3 Key Developments
        4. 5.2.7.4 SWOT Analysis
        5. 5.2.7.5 Key Strategies
      8. 5.2.8 Tetra Tech (US)
        1. 5.2.8.1 Financial Overview
        2. 5.2.8.2 Products Offered
        3. 5.2.8.3 Key Developments
        4. 5.2.8.4 SWOT Analysis
        5. 5.2.8.5 Key Strategies
      9. 5.2.9 Veolia (FR)
        1. 5.2.9.1 Financial Overview
        2. 5.2.9.2 Products Offered
        3. 5.2.9.3 Key Developments
        4. 5.2.9.4 SWOT Analysis
        5. 5.2.9.5 Key Strategies
    3. 5.3 Appendix
      1. 5.3.1 References
      2. 5.3.2 Related Reports
  6. 6 LIST OF FIGURES
    1. 6.1 MARKET SYNOPSIS
    2. 6.2 US MARKET ANALYSIS BY SERVICE TYPE
    3. 6.3 US MARKET ANALYSIS BY SOURCE OF WASTE
    4. 6.4 US MARKET ANALYSIS BY TECHNOLOGY
    5. 6.5 US MARKET ANALYSIS BY END USER
    6. 6.6 KEY BUYING CRITERIA OF CHEMICALS AND MATERIALS
    7. 6.7 RESEARCH PROCESS OF MRFR
    8. 6.8 DRO ANALYSIS OF CHEMICALS AND MATERIALS
    9. 6.9 DRIVERS IMPACT ANALYSIS: CHEMICALS AND MATERIALS
    10. 6.10 RESTRAINTS IMPACT ANALYSIS: CHEMICALS AND MATERIALS
    11. 6.11 SUPPLY / VALUE CHAIN: CHEMICALS AND MATERIALS
    12. 6.12 CHEMICALS AND MATERIALS, BY SERVICE TYPE, 2024 (% SHARE)
    13. 6.13 CHEMICALS AND MATERIALS, BY SERVICE TYPE, 2024 TO 2035 (USD Million)
    14. 6.14 CHEMICALS AND MATERIALS, BY SOURCE OF WASTE, 2024 (% SHARE)
    15. 6.15 CHEMICALS AND MATERIALS, BY SOURCE OF WASTE, 2024 TO 2035 (USD Million)
    16. 6.16 CHEMICALS AND MATERIALS, BY TECHNOLOGY, 2024 (% SHARE)
    17. 6.17 CHEMICALS AND MATERIALS, BY TECHNOLOGY, 2024 TO 2035 (USD Million)
    18. 6.18 CHEMICALS AND MATERIALS, BY END USER, 2024 (% SHARE)
    19. 6.19 CHEMICALS AND MATERIALS, BY END USER, 2024 TO 2035 (USD Million)
    20. 6.20 BENCHMARKING OF MAJOR COMPETITORS
  7. 7 LIST OF TABLES
    1. 7.1 LIST OF ASSUMPTIONS
  8. 7.1.1
    1. 7.2 US MARKET SIZE ESTIMATES; FORECAST
      1. 7.2.1 BY SERVICE TYPE, 2025-2035 (USD Million)
      2. 7.2.2 BY SOURCE OF WASTE, 2025-2035 (USD Million)
      3. 7.2.3 BY TECHNOLOGY, 2025-2035 (USD Million)
      4. 7.2.4 BY END USER, 2025-2035 (USD Million)
    2. 7.3 PRODUCT LAUNCH/PRODUCT DEVELOPMENT/APPROVAL
  9. 7.3.1
    1. 7.4 ACQUISITION/PARTNERSHIP
  10. 7.4.1

US Chemicals and Materials Market Segmentation

Chemicals and Materials By Service Type (USD Million, 2025-2035)
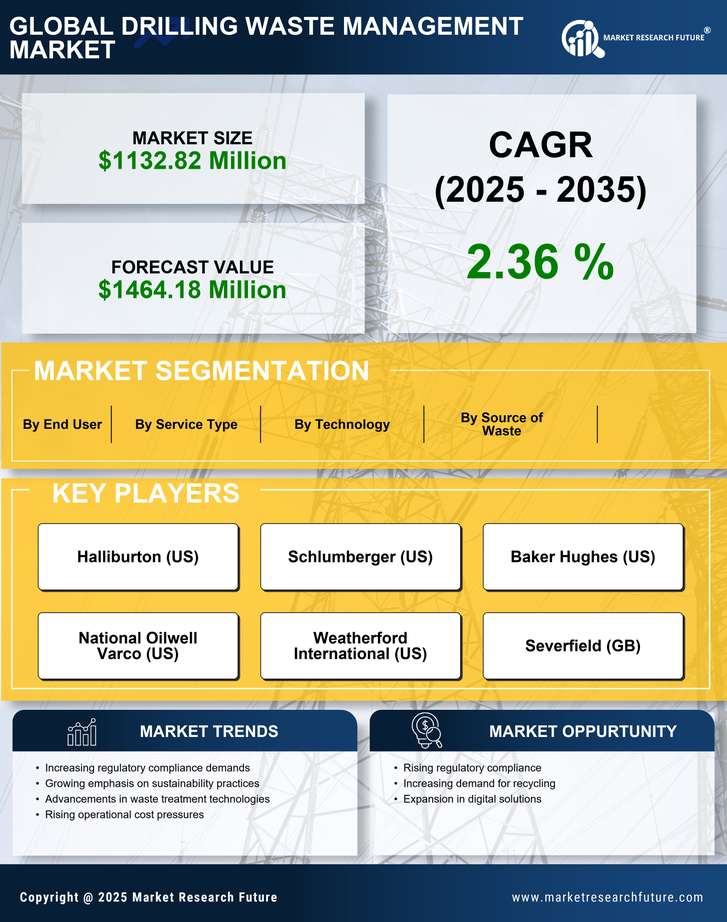
  • Waste Treatment
  • Waste Disposal
  • Waste Recycling
  • Consulting

Chemicals and Materials By Source of Waste (USD Million, 2025-2035)

  • Drilling Operations
  • Reservoir Fluids
  • Completion and Workover Waste
  • Production Waste

Chemicals and Materials By Technology (USD Million, 2025-2035)

  • Solids Control
  • Cuttings Treatment
  • Thermal Desorption
  • Bioremediation

Chemicals and Materials By End User (USD Million, 2025-2035)

  • Onshore
  • Offshore
  • Geothermal
  • Mining