US Fruit Vinegar Market Segmentation
US Fruit Vinegar Market By Source (USD Million, 2025-2035)
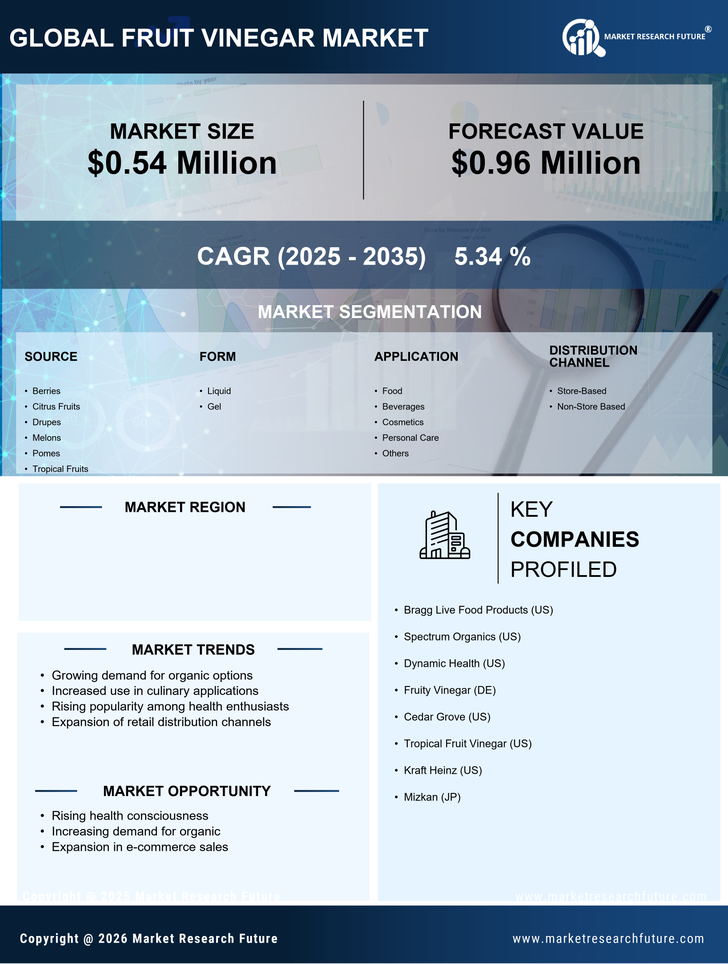
- Berries
- Citrus Fruits
- Drupes
- Melons
- Pomes
- Tropical Fruits
US Fruit Vinegar Market By Form (USD Million, 2025-2035)
- Liquid
- Gel
US Fruit Vinegar Market By Application (USD Million, 2025-2035)
- Food
- Beverages
- Cosmetics
- Personal Care
- Others
US Fruit Vinegar Market By Distribution Channel (USD Million, 2025-2035)
- Store-Based
- Non-Store Based